
🔖 4 – Analysis Dashboard
🔬 Overview
The Analysis Dashboard is GermainUX's root-cause investigation interface.
It helps teams understand why a business, user-experience, workflow, or technology KPI is behaving the way it is by automatically bringing together the evidence needed for investigation:
-
Baselines and trends
-
Relationships with other issues
-
Conversion, Adoption, Experience, and Technology Frictions
-
Leading factors
-
Segmentation
-
Affected users, sessions, and instances
-
Comparison with what worked
-
Technical traces
-
Session Replay
-
Ai-powered analysis
-
Recommendations
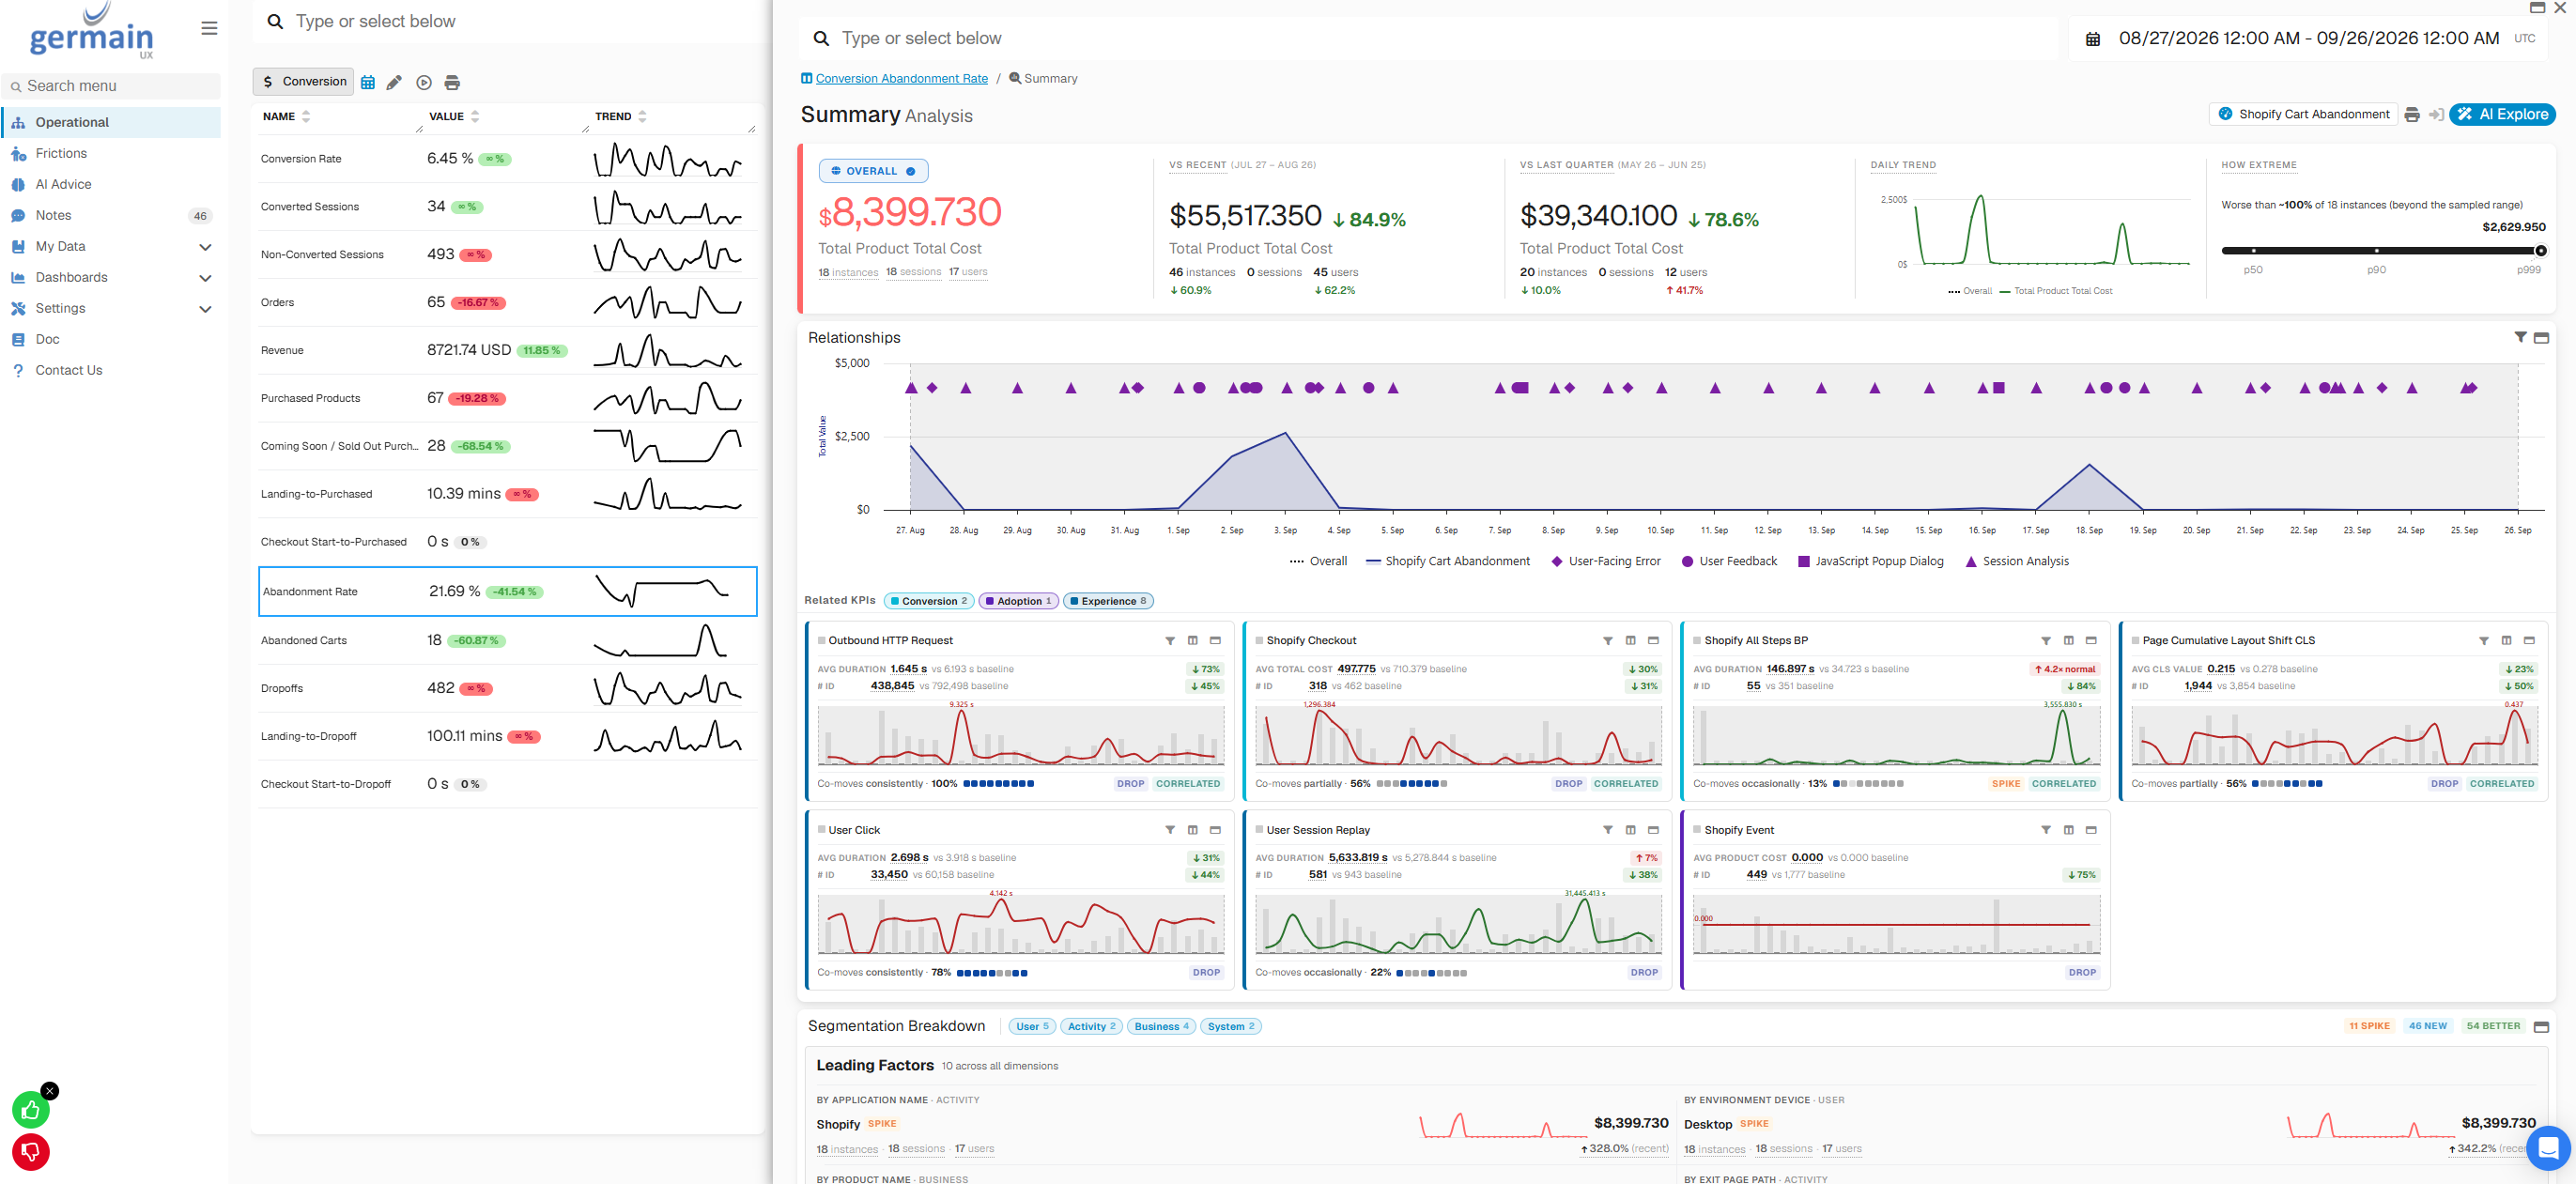
Instead of manually searching across dashboards, logs, traces, and user sessions, teams can move from symptom → impact → likely cause → supporting evidence within one analytical workflow.
The Analysis Dashboard helps answer:
-
Is this abnormal?
-
What changed with it?
-
What frictions may be related?
-
Where is the issue concentrated?
-
Who or what is affected?
-
What is the likely root cause?
📊 Aggregate View vs. Instance view
One of the key benefits of the Analysis Dashboard is the ability to investigate an issue from two complementary perspectives: Aggregate and Instance Analysis.
|
Analysis |
Purpose |
Example |
|---|---|---|
|
Aggregate Analysis |
Understand what is driving a KPI across many users, sessions, transactions, or systems. |
Why did conversion decrease across thousands of sessions? |
|
Instance Analysis |
Understand exactly what happened during one specific occurrence. |
Why did this particular user fail to complete checkout? |
🌎 Aggregate Analysis — Find What Matters at Scale
Aggregate Analysis looks across the entire selected population and time period to identify patterns that would be difficult or impossible to discover by investigating individual instances one at a time.
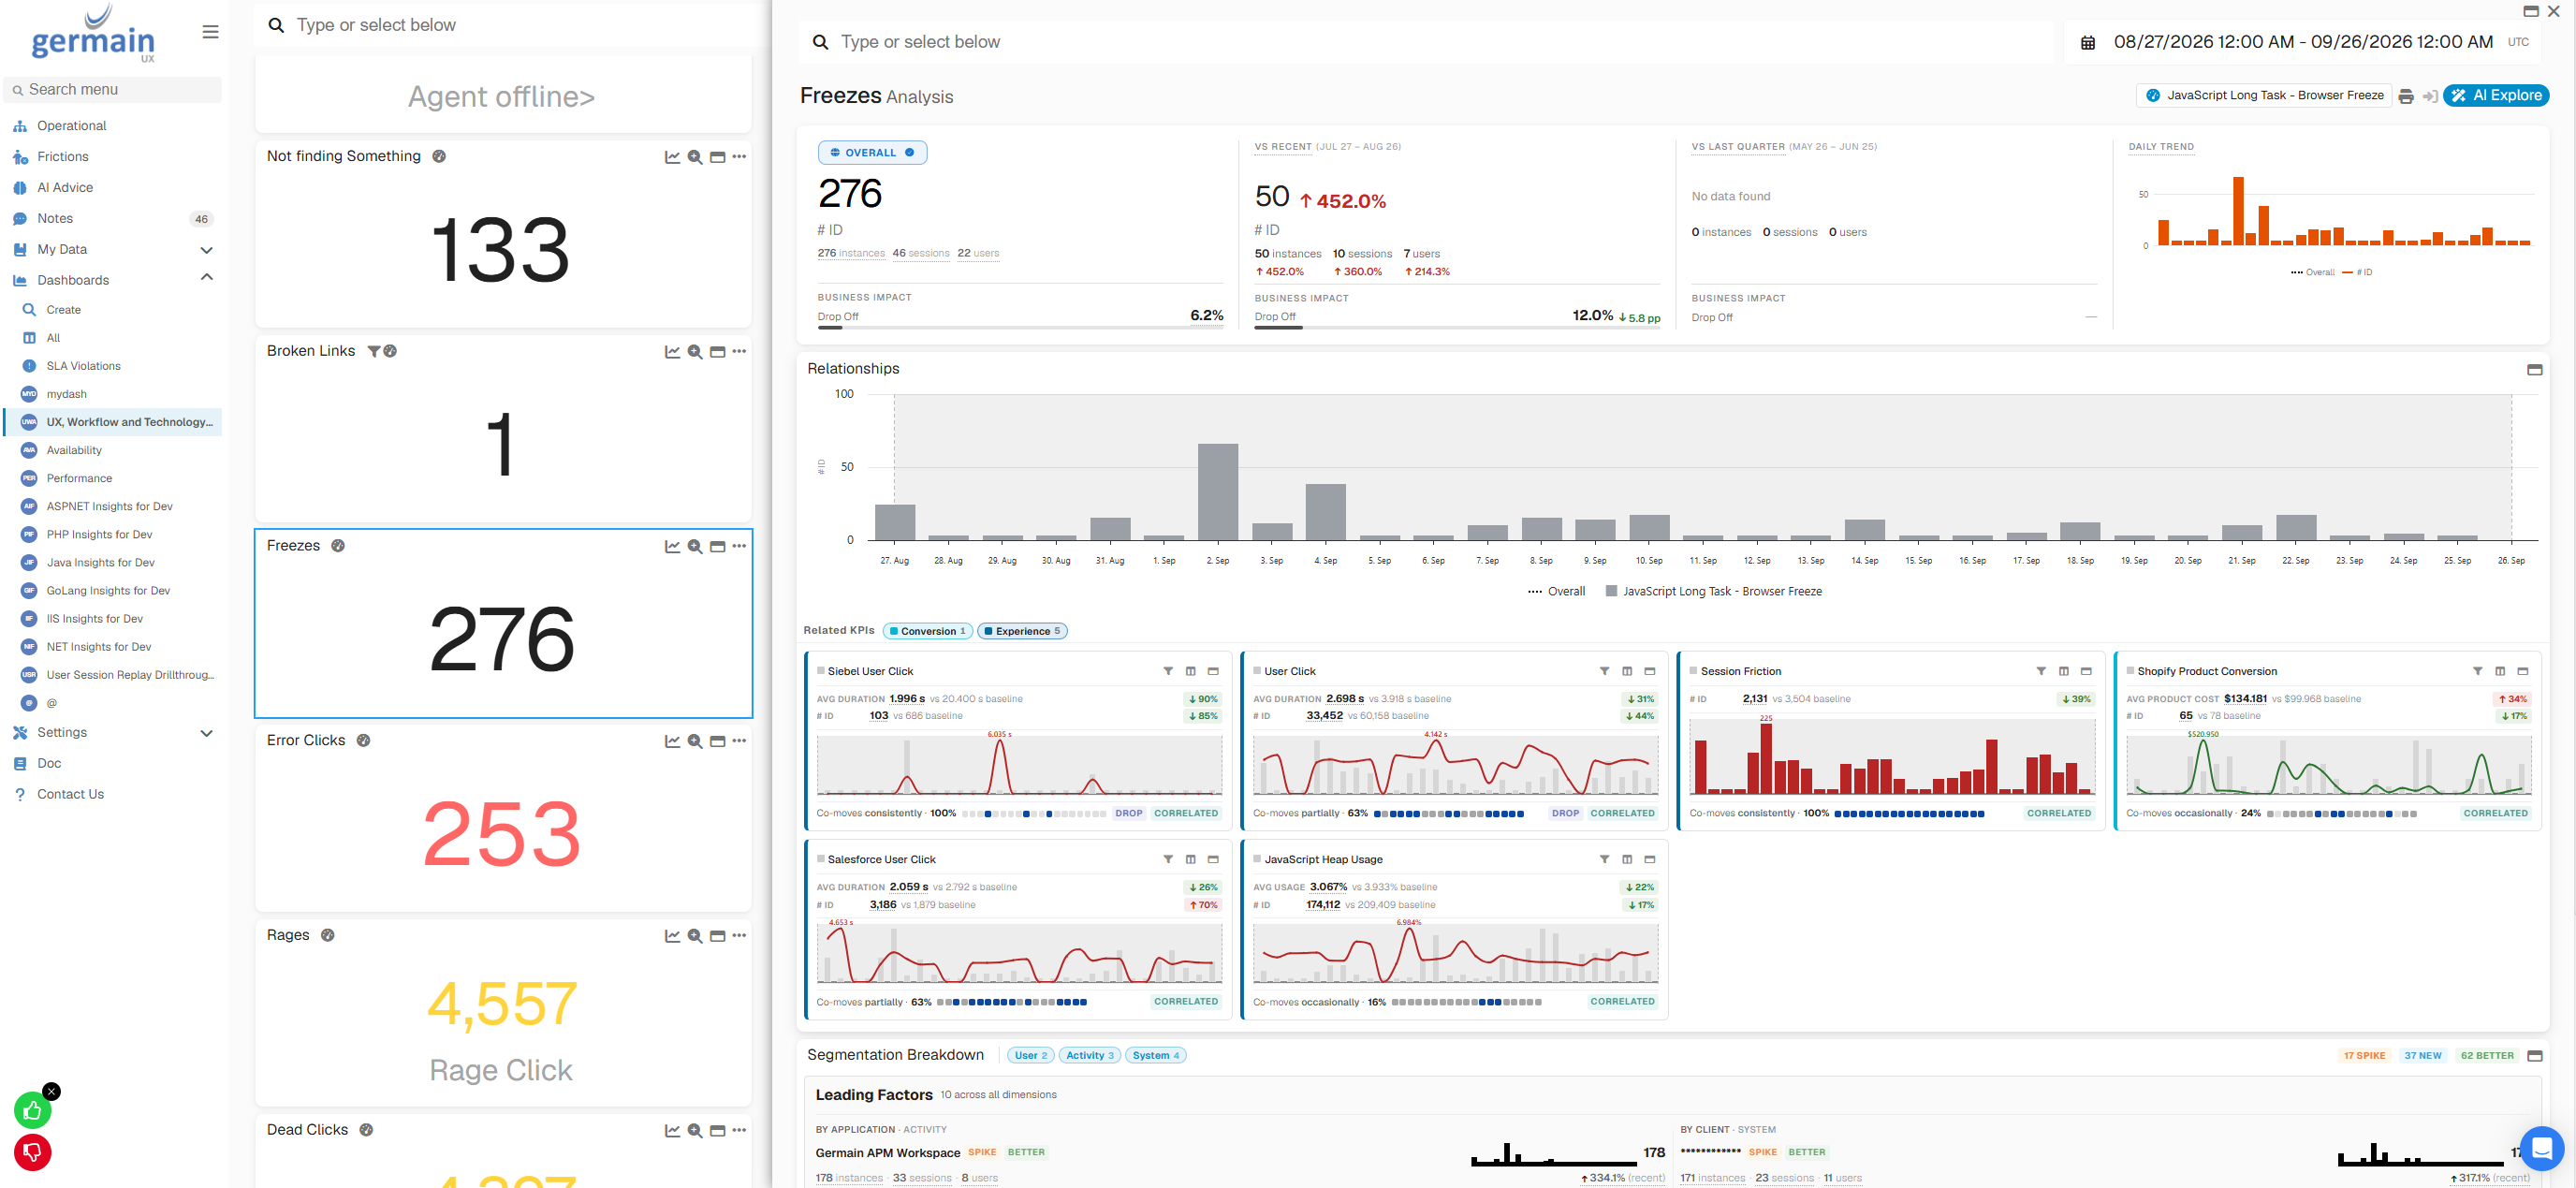
It helps answer:
-
What are the largest factors associated with the issue?
-
Which users, sessions, workflows, applications, products, regions, devices, browsers, or versions are most affected?
-
Which related KPIs changed at the same time?
-
Is the problem widespread or concentrated within a specific segment?
-
How many users, sessions, or instances are affected?
-
Which issues should be investigated first?
For example, if conversion drops across 100,000 sessions, reviewing individual sessions would not efficiently reveal what is affecting the population.
Aggregate Analysis can identify that the decrease is concentrated among a particular checkout step, browser version, product, error, performance condition, or user segment, helping teams quickly focus on the factors with the greatest impact.
Benefit: Find the patterns, relationships, and leading factors affecting the population without manually investigating thousands of individual occurrences.
🔎 Instance Analysis — Explain a Specific Occurrence
Once Aggregate Analysis identifies an important pattern or affected population, users can drill into an individual instance to understand exactly what happened.
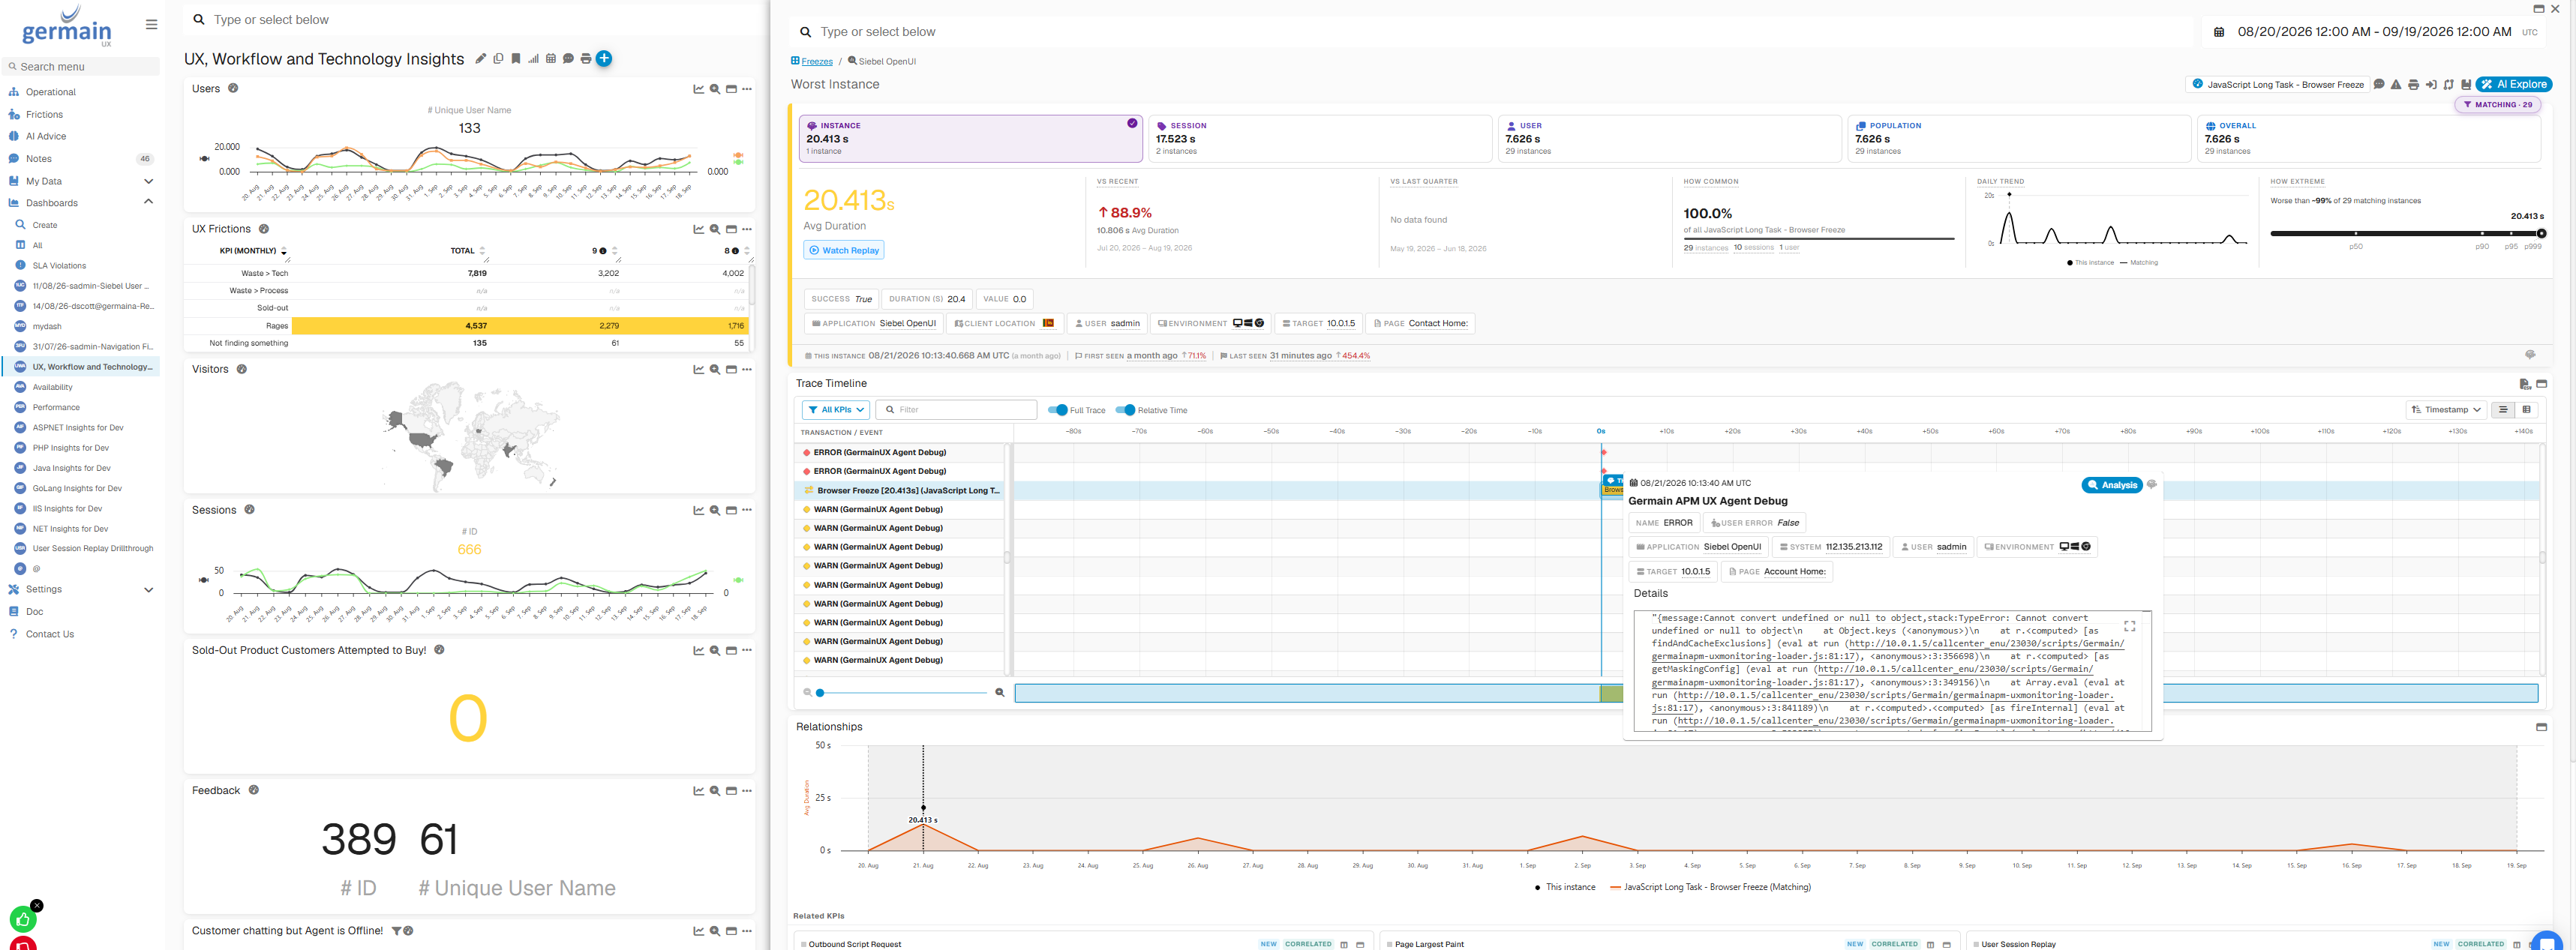
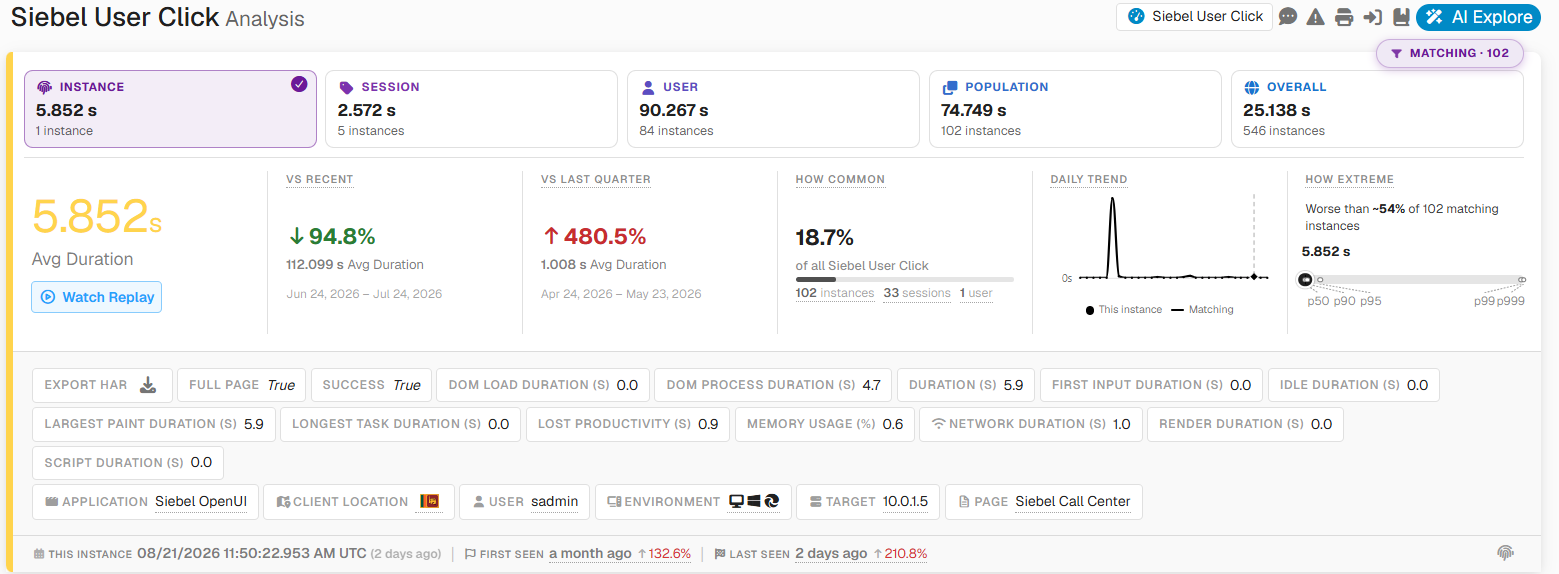
GermainUX can compare the selected instance across:
INSTANCE → SESSION → USER → POPULATION → OVERALL
This helps determine whether the behavior is:
-
Isolated to one occurrence
-
Specific to one session
-
Specific to one user
-
Concentrated within a population
-
System-wide
Depending on the KPI and available data, the investigation can include:
-
Duration breakdown
-
Technical traces
-
HTTP activity
-
Errors
-
Related transactions
-
User activity
-
Events occurring before and after the issue
-
Session Replay
Benefit: Move from identifying what is affecting users at scale to understanding exactly why a representative occurrence happened.
🔄 From Population-Level Insight to Individual Evidence
Aggregate and Instance Analysis are designed to work together:
Detect a KPI change
→ Analyze the population
→ Identify leading factors
→ Find affected segments
→ Measure users/sessions/instances affected
→ Open a representative instance
→ Analyze its trace and surrounding activity
→ Replay the user session
→ Identify the likely root cause
This approach avoids two common investigation problems:
Looking only at aggregate data can reveal a pattern without showing exactly what happened to an individual user or transaction.
Looking only at individual instances can explain one occurrence without showing whether it represents the broader population.
GermainUX combines both views so teams can understand what matters at scale and then validate it with instance-level evidence.
📈 Summary
The Summary helps determine whether the selected KPI is behaving abnormally.

Depending on the KPI and available history, GermainUX can compare:
-
Vs Recent
-
Vs Last Quarter
-
Trend
-
How Extreme
Percentiles can also help determine whether an issue affects the overall population or only a subset.
For example, a normal median combined with a high p95 or p99 may indicate that most users are unaffected while a smaller population is experiencing significant degradation.
🔗 Relationships
The Relationships view overlays the KPI being analyzed with related signals on a common timeline.

It can include:
-
Selected KPI
-
Overall population
-
Related KPIs
-
Frictions (Conversion, Adoption, Experience or Technology)
-
Discrete events
-
Errors
-
Alerts
-
Dimensional pivots
This helps identify signals that changed at the same time as the KPI being investigated and provides direction for further analysis.
Filter KPI by Friction
The Relationships graph can be filtered by the type of friction relevant to the investigation:
-
Conversion Frictions — conditions that may interfere with a visitor's ability to convert or complete a desired business outcome.
-
Adoption Frictions — conditions that may interfere with successful application, feature, or workflow adoption.
-
Experience Frictions — conditions affecting the user's experience, such as errors, failed interactions, or other detected user friction.
-
Technology Frictions — application or technology conditions such as errors, failures, or performance issues that may affect users or business outcomes.
Select one or more friction categories to focus the Relationships graph on the signals most relevant to the investigation.
For example:
Conversion Rate Declines
→ Filter on Conversion Frictions
→ Identify frictions occurring around the decline
→ Determine which populations are affected
→ Investigate representative instances
→ Review Session Replay and related technical evidence
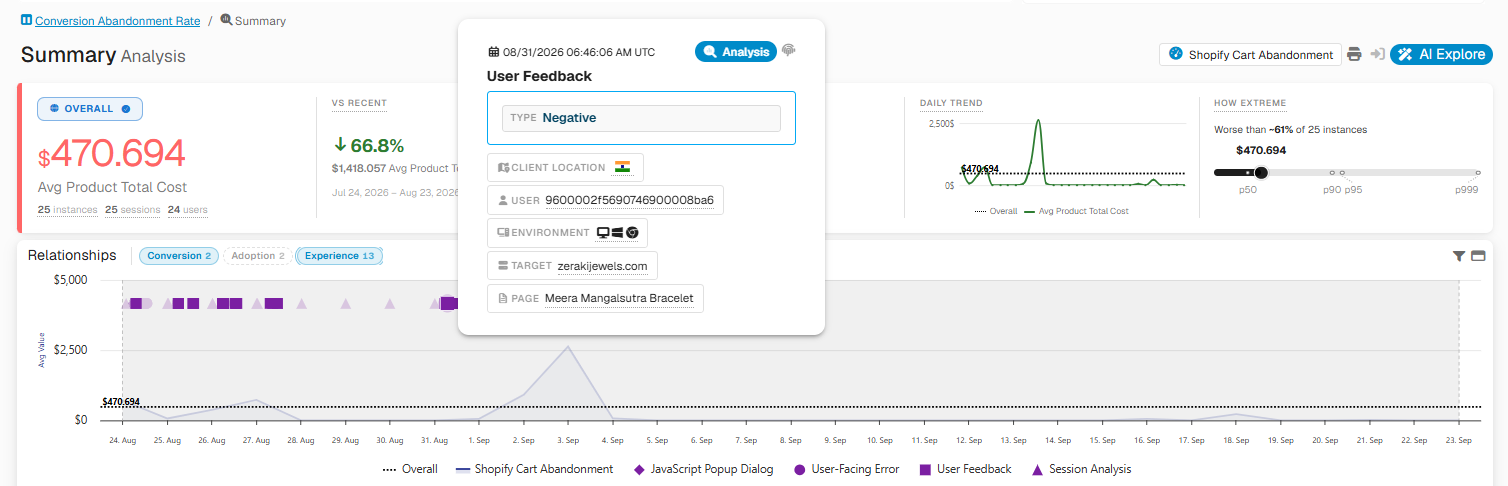
And you can replay the session behind that negative user feedback to understand the context around the cart abandonment.
Or:
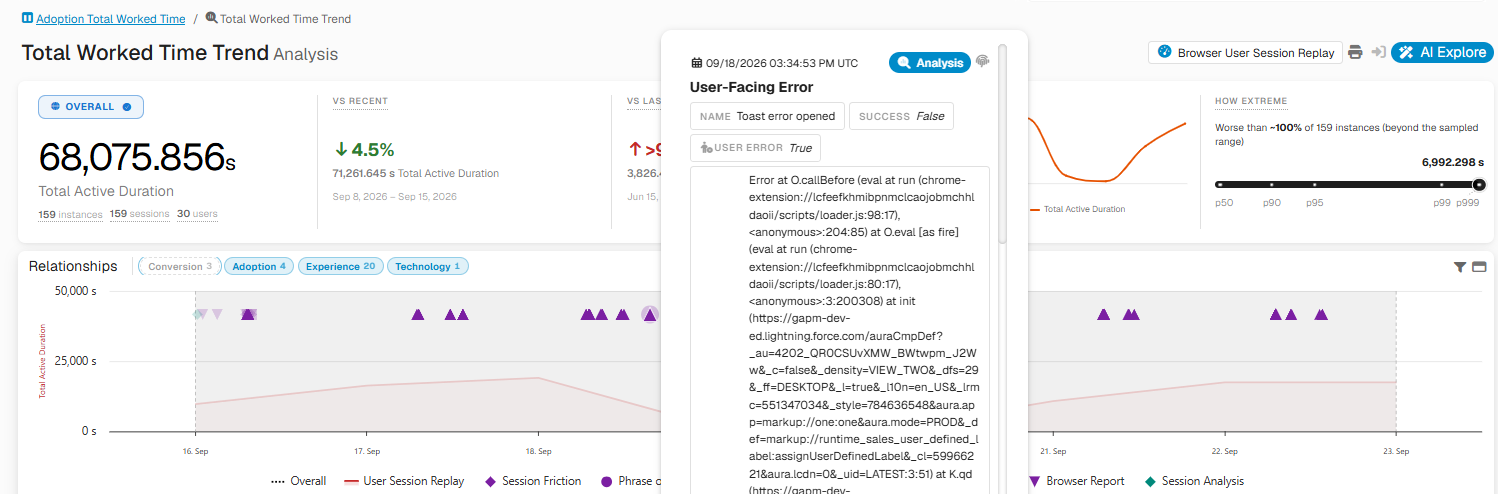
CRM Adoption Declines
→ Filter on Adoption Frictions
→ Identify relevant workflow or user frictions
→ Compare affected populations
→ Investigate individual sessions
→ Identify likely contributing factors
Friction filtering helps reduce noise and focus the investigation on the type of outcome being analyzed.
⛓️ Related KPIs
Configured KPI Relationships allow GermainUX to automatically surface related signals during an investigation.
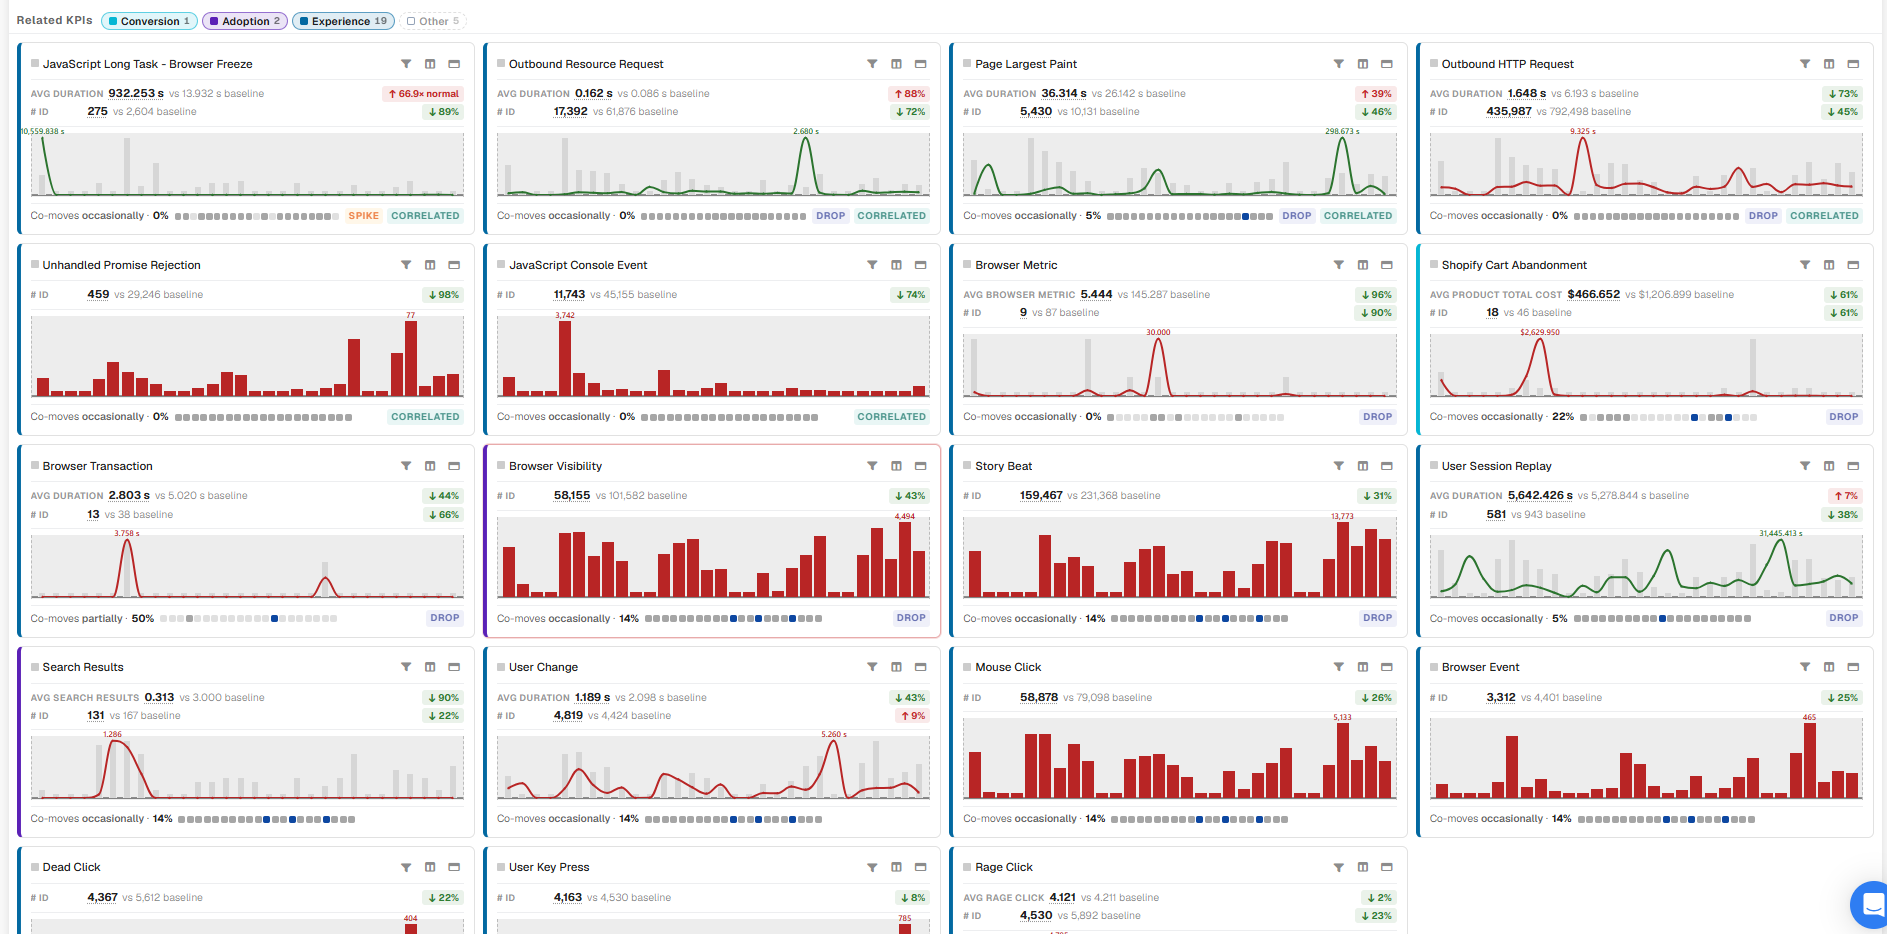
Related KPI information can include:
-
Spike or drop
-
Current value
-
Baseline
-
Variation
-
Trend
-
Co-movement
These signals help identify where to investigate next. Relationships and correlation provide supporting evidence but do not, by themselves, prove causation.
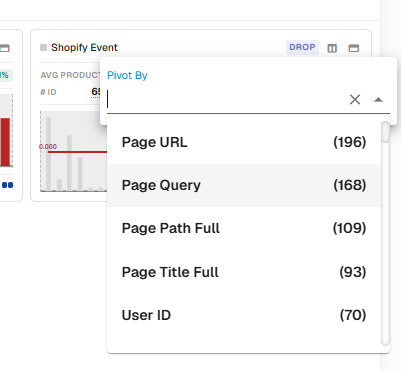
And you can pivot to further understand an issue:
🧭 Leading Factors
Leading Factors analyze available KPI dimensions to identify the populations or conditions most strongly associated with the observed outcome.
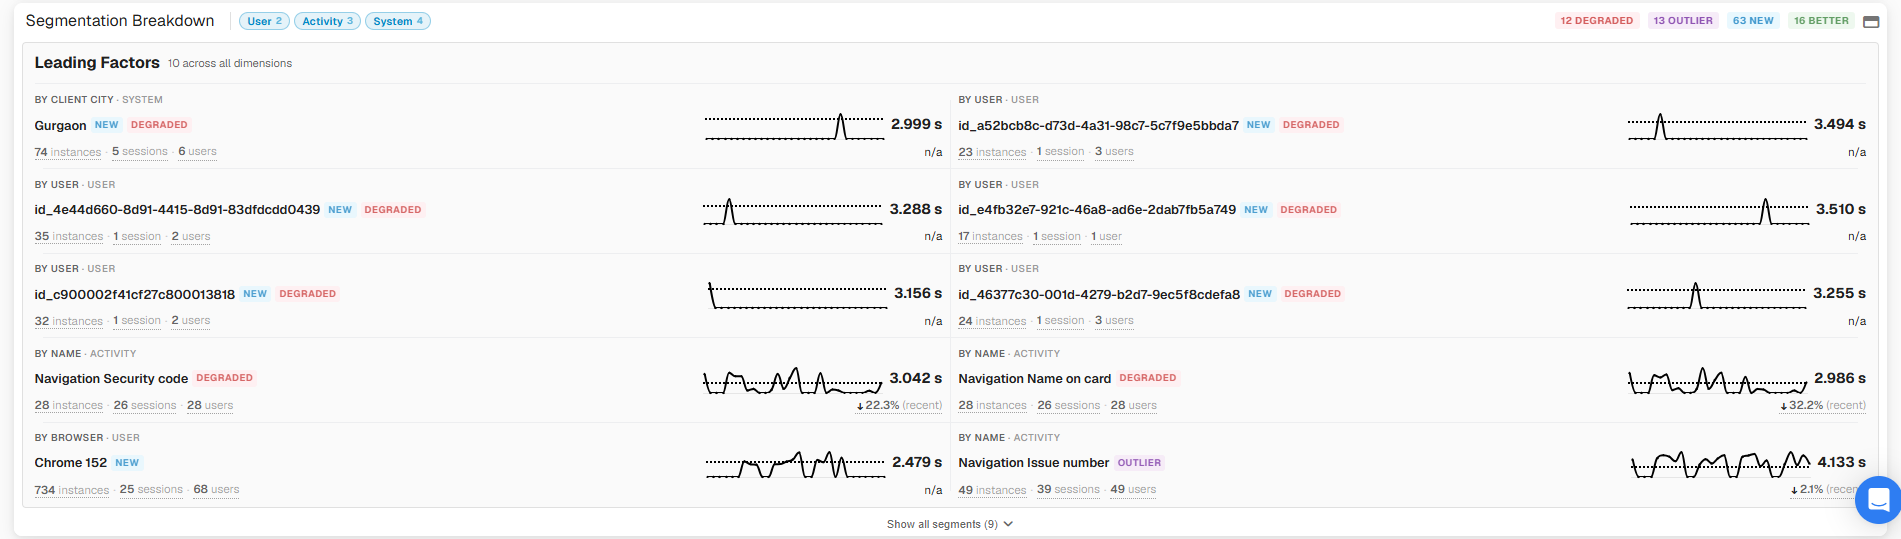
Depending on the KPI, dimensions can include:
-
User
-
Session
-
Page
-
Application
-
Product
-
Journey step
-
Workflow
-
Region
-
Device
-
Browser
-
Version
Segments can be identified as:
-
DEGRADED
-
OUTLIER
-
NEW
-
BETTER
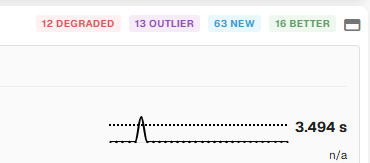
Affected instance, session, and user counts help determine both the scale and concentration of the issue.
⏱️ Duration Breakdown
For supported duration-based KPIs, elapsed time can be separated into areas such as:
-
Service
-
Network
-
Rendering
-
Document Processing
-
Idle or Unmonitored
Duration can be analyzed using Exclusive or Cumulative time to identify where time is actually being spent.
🕰️ Trace Timeline
The Trace Timeline displays the selected transaction and related activity on a common timeline.
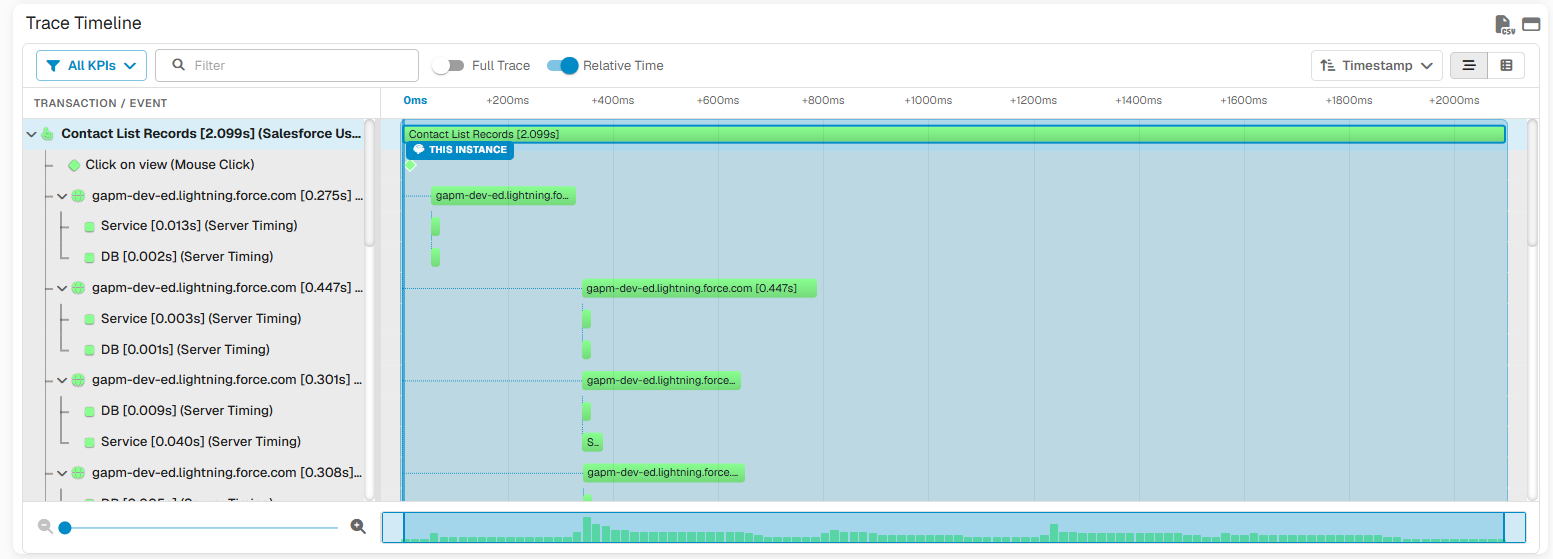
Depending on the monitored data, it can include:
-
Child spans
-
Server timings
-
HTTP requests
-
Browser activity
-
Errors
-
Related transactions
-
User activity
For HTTP activity, available evidence can include connection timing, SSL, waiting time, download time, response size, caching, compression, URL, response information, and HAR export.
✨ Extended Context
Expand the Trace Timeline to investigate what occurred before and after the selected transaction.
Available context can include:
-
Console errors
-
User-facing errors
-
Rage clicks
-
Popups
-
Navigations
-
Related requests
-
Related transactions
This is particularly important when the event responsible for a symptom occurred before the symptom itself became visible.
🔁 Recursive Analysis
Analysis does not have to stop at the original KPI.
Select Analysis from a supported trace span to investigate that KPI independently.
For example:
Slow User Click → Slow HTTP Request → Slow Service Call → Slow Database Operation
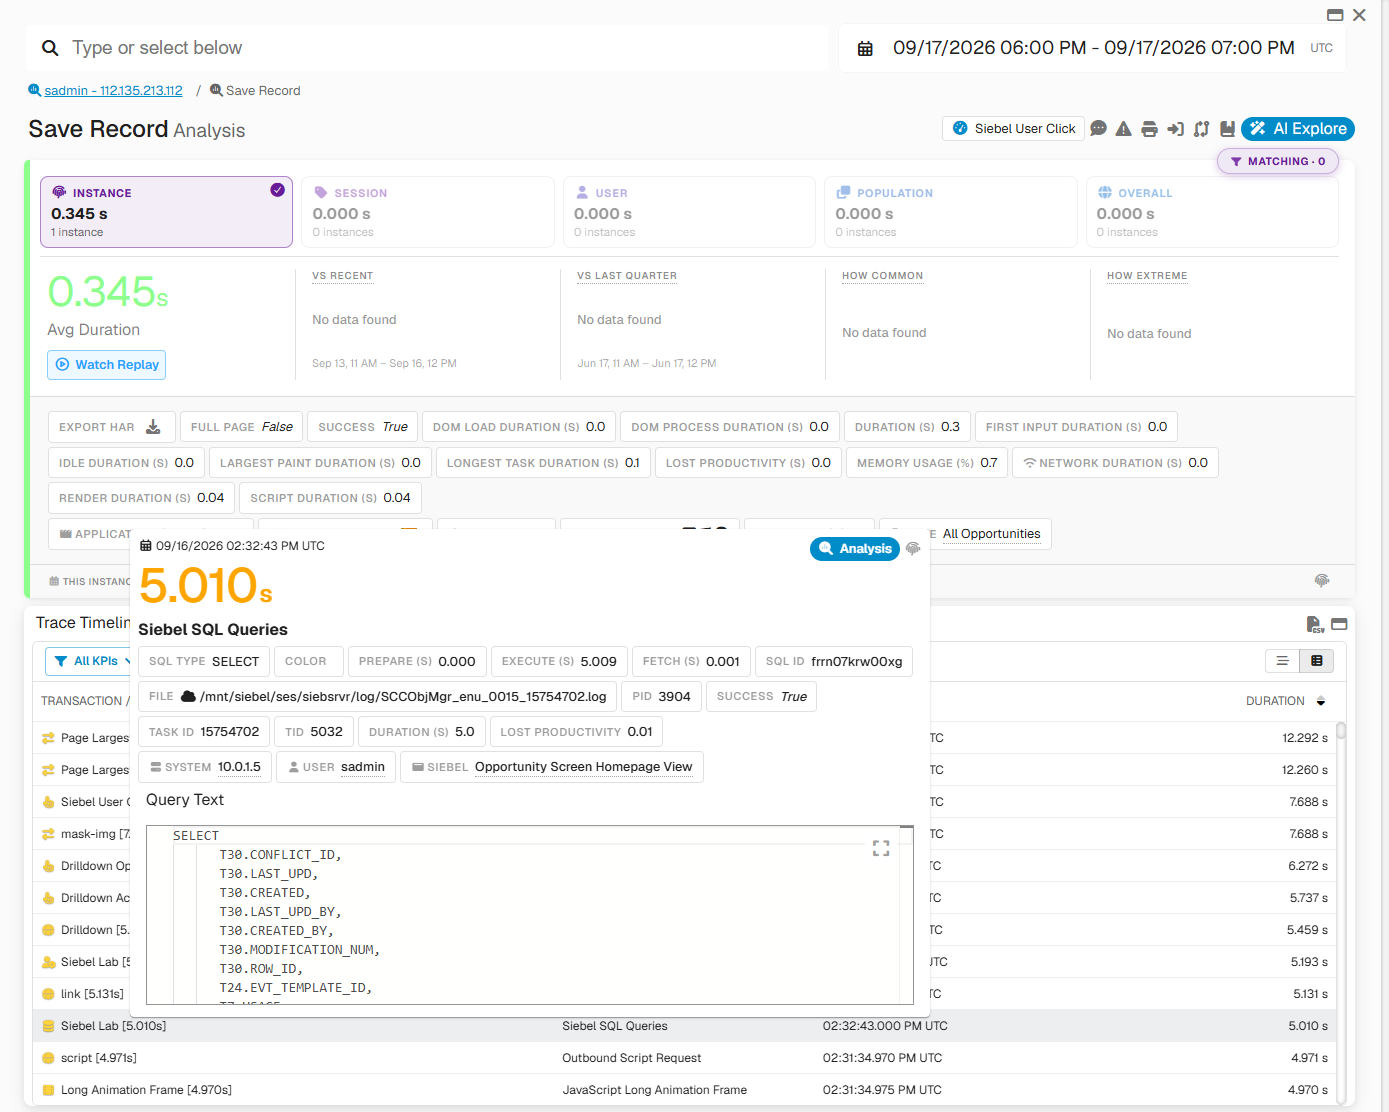
Each level can then be analyzed using its own baselines, relationships, segmentation, aggregate patterns, and instance evidence.
🎥 Session Replay
When Session Replay is available, open the affected user's session to see what the user was actually doing and experiencing around the issue.
This connects analytical and technical evidence with the actual user experience.
Learn more about Session Replay.
📋 Investigation Workflow
A typical GermainUX investigation becomes:
Symptom
→ Confirm abnormal behavior
→ Analyze impact across the population
→ Review Related KPIs
→ Identify Leading Factors
→ Identify affected segments
→ Measure users, sessions, and instances affected
→ Select a representative instance
→ Review duration and trace
→ Review surrounding activity
→ Open Session Replay
→ Identify likely root cause
→ Take action
→ Validate
The result is a continuous investigation path from population-level impact to instance-level evidence.
⚙️ Configure Analysis
Analysis behavior depends on KPI configuration, including:
-
Fact Type
-
Fact Category
-
Measures
-
SLAs
-
Statistical SLAs
-
Dimensions
-
KPI Relationships
-
Matching fields
Configuration is available under:
Germain Workspace > Settings > Analytics
📚 Related Documentation
ℹ️ Get Help
The Germain Team can help you set this up. Contact GermainUX Support.
Feature Availability: 2014.1 or later