
Drill-through Dashboard: Investigating Individual Records Behind KPIs
🚦 Overview
The Drill-through Dashboard is the third level of GermainUX Analytics Dashboards.
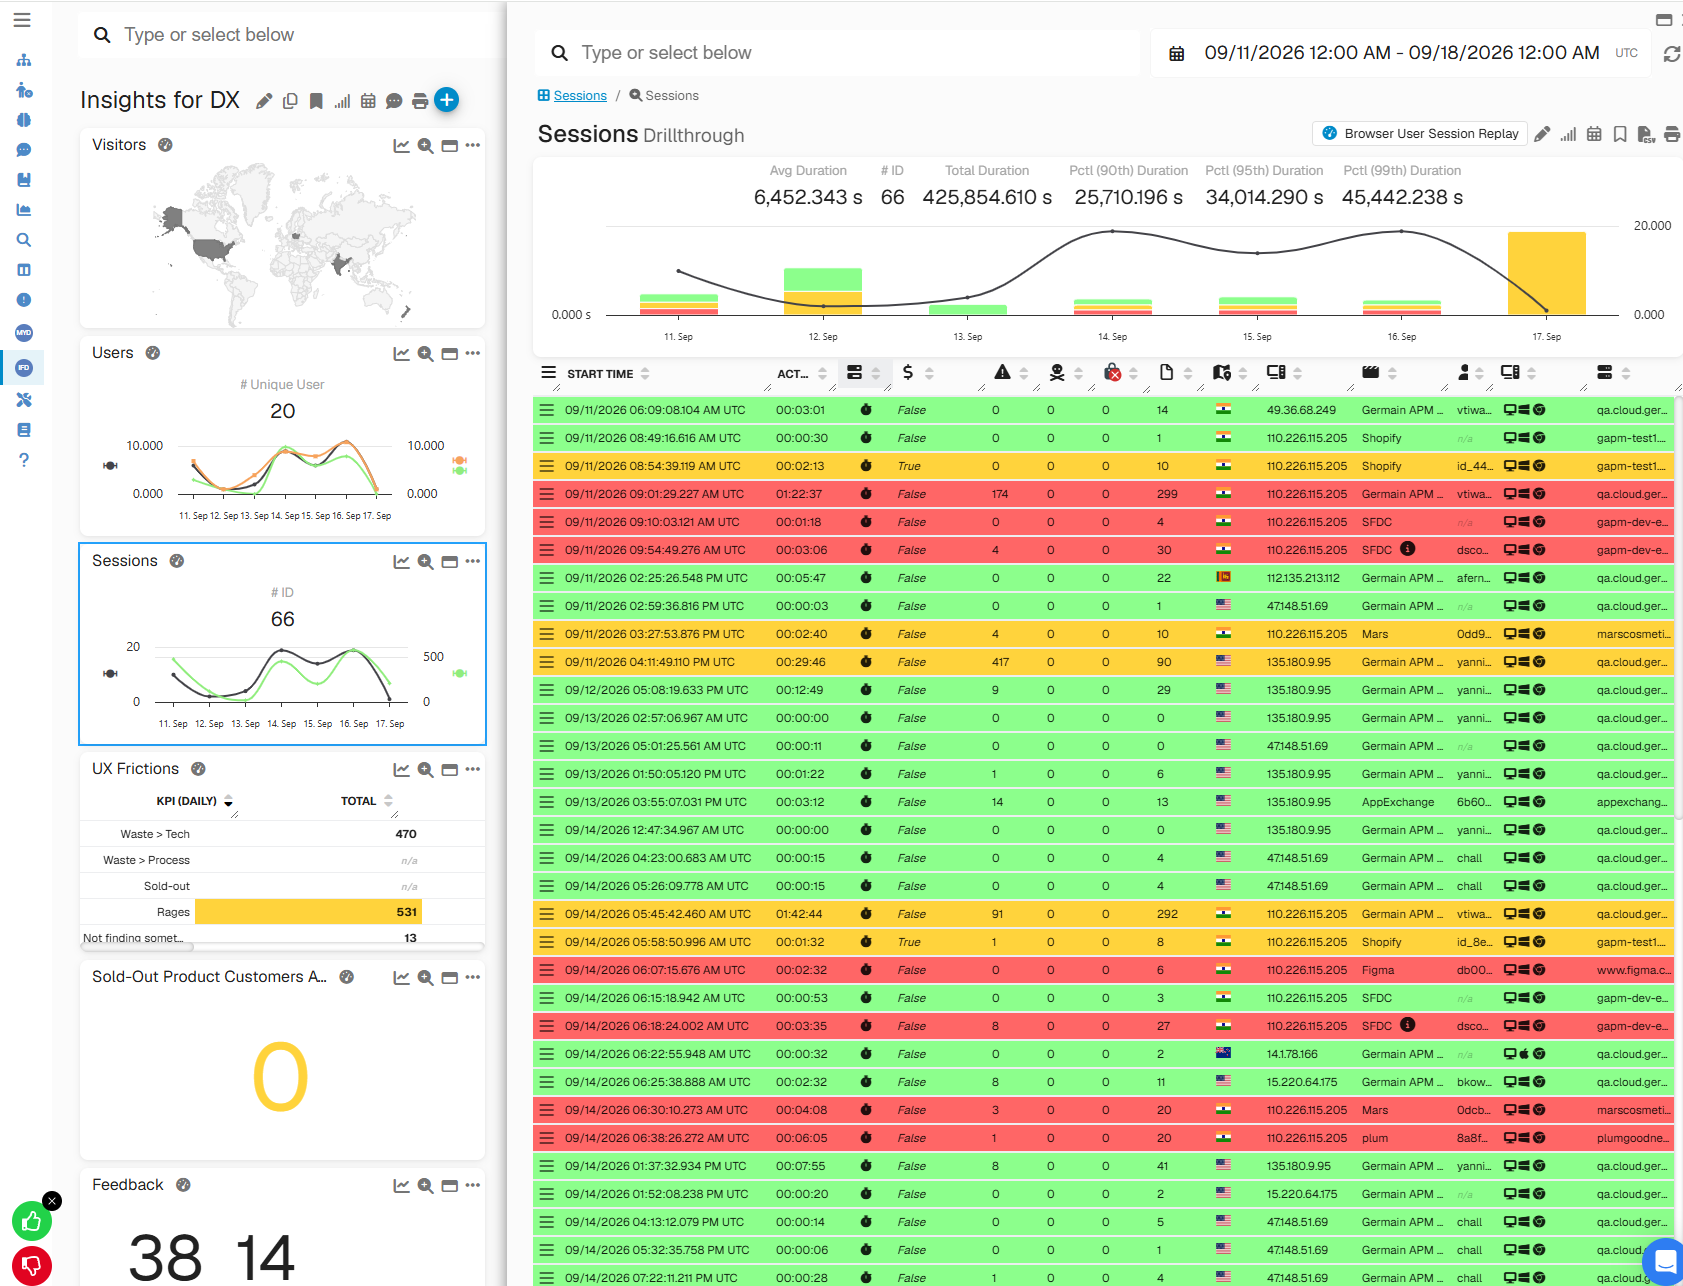
It displays the individual records behind an aggregated KPI or Pivot result.
Use it to move from:
“Something is happening”
to:
“These are the individual instances where it happened.”
🔎 What You Can Investigate
Depending on the KPI, Drill-through can answer questions such as:
-
Which transactions failed?
-
Which users experienced the issue?
-
Which sessions abandoned a journey?
-
Which requests were slow?
-
Which errors occurred?
-
Which workflow instances exceeded their expected duration?
📂 Open Drill-through
Open Drill-through from an Aggregate or Pivot Dashboard using the available list or binoculars action.
The Drill-through Dashboard inherits the current filters and visibility so the individual records remain within the context of the original investigation.
📋 Instance Data
Each row represents an individual monitored record.
Available fields depend on the KPI and can include user, session, application, page, transaction, duration, error, workflow, host, endpoint, or other monitored attributes.
Columns can be added, removed, or reordered.
⚙️ Available Actions
Depending on configuration and permissions, actions include:
-
Refresh
-
Edit
-
Export to CSV
-
Print
-
Add a note or ticket
🔬 Open Analysis
Select an individual instance to continue to the Analysis Dashboard.
This moves the investigation from:
Aggregate → Segment → Individual Instance → Root Cause
Analysis can then compare the selected instance with its session, user, population, and overall behavior and examine available traces, relationships, and Session Replay evidence.
Related Documentation
-
Analytics Dashboards
-
Aggregate Dashboard
-
Pivot Dashboard
-
Analysis Dashboard
-
Root-Cause Analysis
ℹ️ Get Help
The Germain Team can help you set this up. Contact GermainUX Support.
Feature Availability: 2014.1 or later