
Analytics Dashboards: Four Levels of Analysis for Business and Technical KPIs
📊 Overview
GermainUX Analytics Dashboards help business and technical teams analyze conversion, adoption, productivity, user experience, business workflows, and technology performance.
They provide four connected levels of analysis:
Aggregate → Pivot → Drill-through → Analysis
Together, these dashboards help answer:
-
What is happening?
-
Is it abnormal?
-
What is the impact?
-
Who or what is affected?
-
Why is it happening?
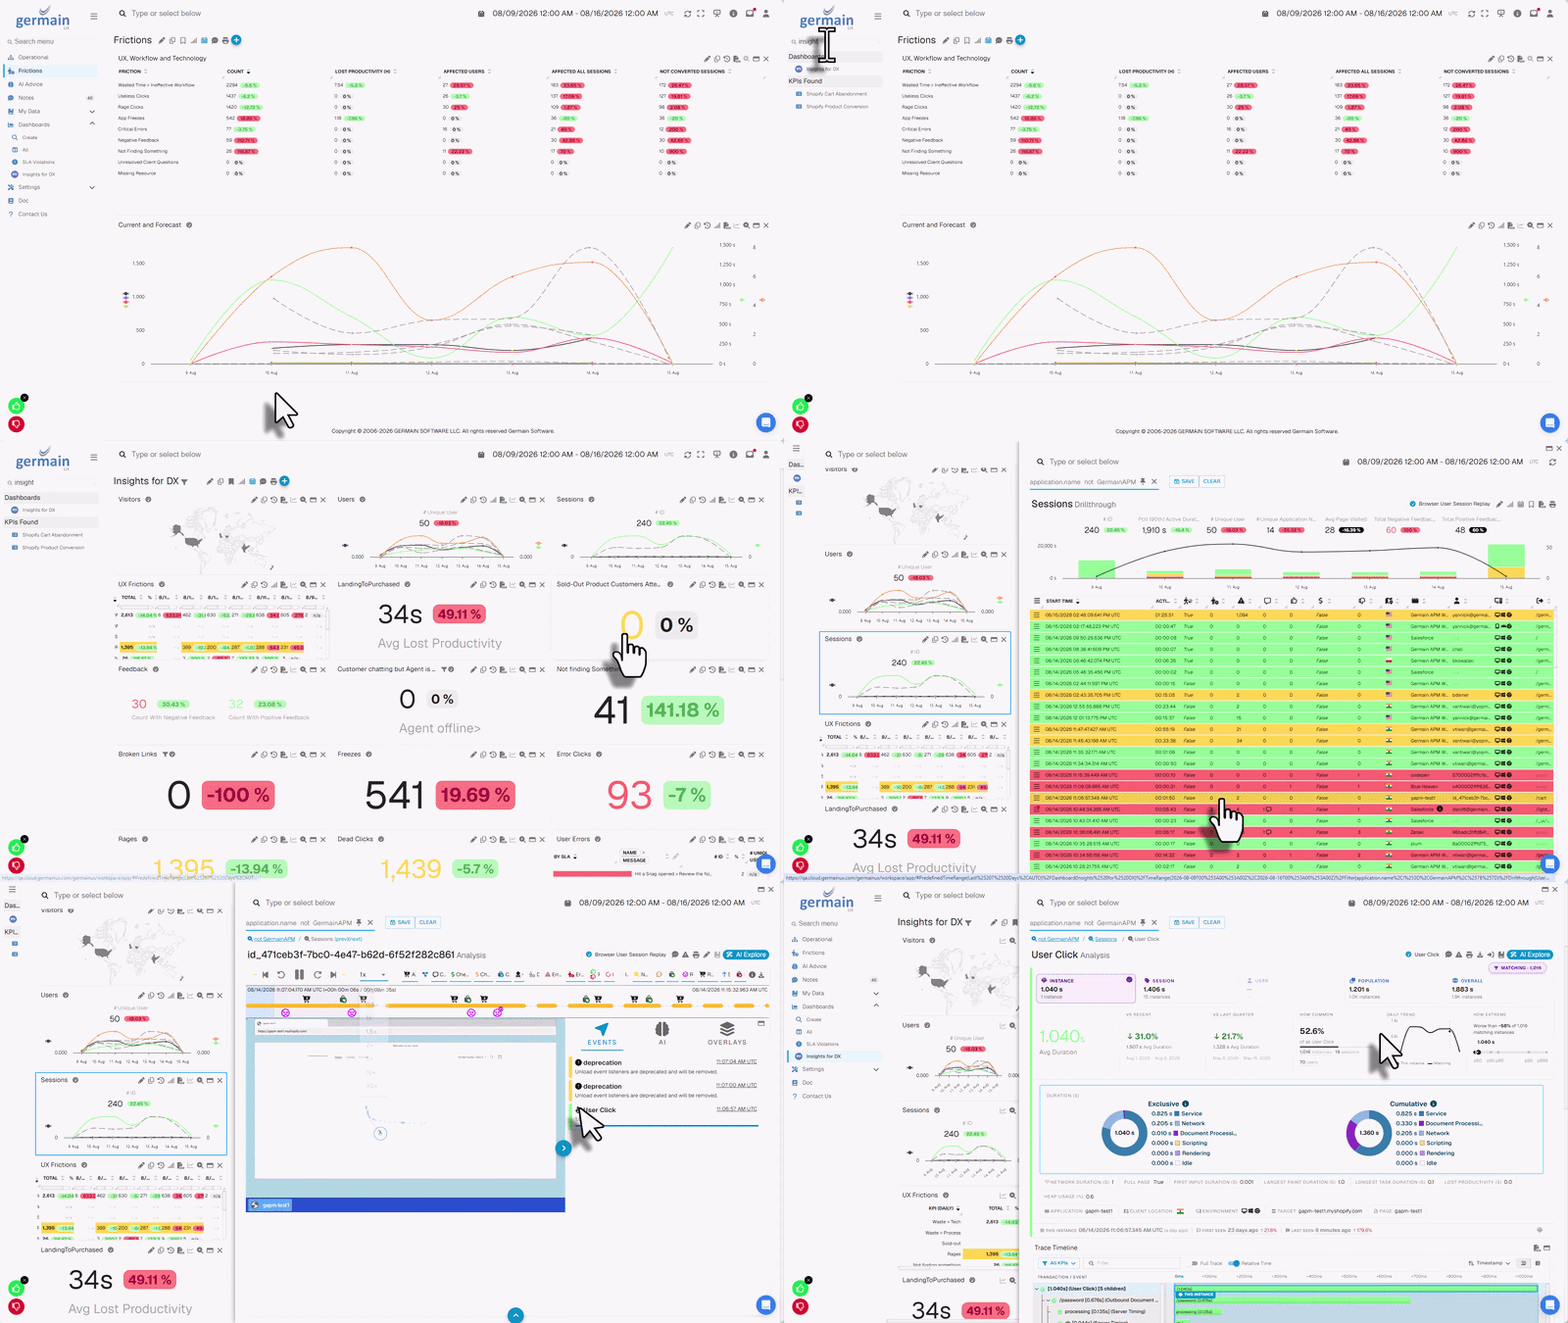
🎚️ Four Levels of Analysis
|
Level |
Dashboard |
Purpose |
|---|---|---|
|
1 |
Monitor KPIs, trends, journeys, workflows, and impact at scale. |
|
|
2 |
Break down a KPI by application, page, process, product, user, location, device, version, or other available dimensions. |
|
|
3 |
Examine the individual data points behind an aggregated KPI. |
|
|
4 |
Investigate root causes using baselines, relationships, related KPIs, Leading Factors, individual instances, traces, and Session Replay. |
Filters and investigation context are preserved as users drill deeper.
📑 Business & Technical KPIs
Analytics Dashboards can analyze KPIs configured in GermainUX, including:
Business KPIs
-
Conversion
-
Adoption
-
Productivity
-
Workflow completion
-
Abandonment
-
Customer journeys
-
User behavior
Technical KPIs
-
Errors
-
Response times
-
Failed requests
-
Availability
-
Browser activity
-
Application performance
-
Infrastructure performance
🧭 Aggregate Dashboard
Start with the Aggregate Dashboard to monitor KPIs and identify trends, changes, friction, and business impact at scale.
Learn about the Aggregate Dashboard.
🔁 Pivot Dashboard
Break down a KPI to determine where an issue or outcome is concentrated.
Learn about the Pivot Dashboard.
🚦 Drill-through Dashboard
Examine the individual events, transactions, sessions, or other records behind an aggregated result.
Learn about the Drill-through Dashboard.
🔬 Analysis Dashboard
Investigate why a KPI changed using baselines, relationships, Leading Factors, individual instances, technical traces, and Session Replay.
Learn about the Analysis Dashboard.
Related Documentation
-
Operational Dashboard
-
Root-Cause Analysis
-
KPI Relationships
-
KPIs, Pivots & Measures
-
Create & Customize Dashboards
ℹ️ Get Help
The Germain Team can help you set this up. Contact GermainUX Support.
Feature Availability: 2014.1 or later