
Configure Monitoring for Apache ZooKeeper
Configure GermainUX to collect and analyze Apache ZooKeeper ensemble health, performance, connections, JVM behavior, logs, and infrastructure telemetry.
1. Open the Apache ZooKeeper Wizard
Go to:
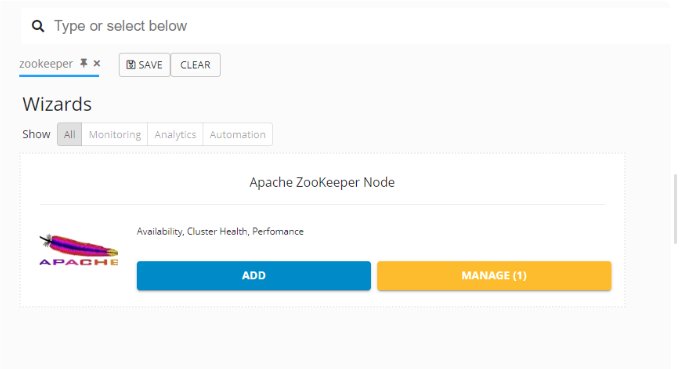
Germain Workspace > Left Menu > Wizards > Apache ZooKeeper
Start the Apache ZooKeeper Wizard.
2. Select or Create the ZooKeeper Server
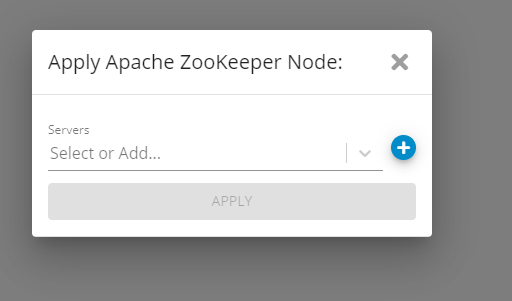
Select an existing monitored server or create a new one.
Configure the server information required by the Wizard.
Use a descriptive name that identifies the ZooKeeper member and environment.
For example:
ZooKeeper-01 - Production
3. Select the GermainUX Engine
Select the GermainUX Engine responsible for monitoring the ZooKeeper server.
Use an Engine that can reach the ZooKeeper node and any other required monitoring interfaces.
4. Configure ZooKeeper Connectivity
Configure the information required to reach the ZooKeeper server.
Depending on the monitoring method, this can include:
-
Hostname
-
ZooKeeper client port
-
Monitoring port
-
Prometheus metrics port
-
Environment
Verify that the Engine can reach the configured endpoints.
5. Configure Four-Letter-Word Command Monitoring
Configure GermainUX to use the ZooKeeper administrative commands required for the selected monitoring scope.
Supported commands documented for GermainUX include:
srvr
Use for:
-
Server version
-
Uptime
-
Server mode
stat
Use for:
-
Connections
-
Watches
-
Outstanding requests
-
Server statistics
cons
Use for:
-
Connected clients
-
Client connection information
-
Client operations
mntr
Use for:
-
ZooKeeper monitoring metrics
-
Node information
-
Watch statistics
-
Latency
-
Other server metrics
Configure only commands enabled on the ZooKeeper server.
6. Configure Ensemble Monitoring
Identify the ZooKeeper members that belong to the same ensemble.
Monitor:
-
Node availability
-
Leader
-
Followers
-
Membership changes
-
Connectivity
Use consistent naming for all servers in the same environment so ensemble-level analysis is easier.
7. Configure Latency Monitoring
Monitor available latency measures such as:
-
Average latency
-
Minimum latency
-
Maximum latency
Configure thresholds according to normal behavior in each environment.
Avoid treating isolated latency spikes as incidents without considering duration, request volume, and infrastructure conditions.
8. Configure Throughput Monitoring
Monitor available request-rate metrics.
Analyze throughput together with:
-
Latency
-
Outstanding requests
-
Connections
-
CPU
-
JVM
-
Disk
A decrease in throughput should be evaluated against expected client demand.
9. Configure Outstanding Request Monitoring
Monitor outstanding requests to identify potential processing bottlenecks.
Configure analysis for conditions such as:
-
Sustained increase
-
Threshold exceeded
-
Increase combined with latency degradation
10. Configure Connection Monitoring
Monitor:
-
Number of connected clients
-
Connection failures
-
Connection timeouts
-
Abnormal changes in connection volume
Use the cons, stat, or other available metrics according to the ZooKeeper version and configuration.
11. Configure Watch Monitoring
Monitor ZooKeeper watch counts.
Analyze:
-
Current watch count
-
Growth over time
-
Abnormal increases
-
Differences between nodes
Use historical behavior to establish normal watch volume.
12. Configure Leader Monitoring
Monitor node operating mode to determine:
-
Leader
-
Follower
-
Other available node state
Configure Rules to identify:
-
Leader unavailable
-
Repeated leader changes
-
Unexpected node mode
-
Unstable ensemble behavior
13. Configure File Descriptor Monitoring
When available through ZooKeeper, JVM, or operating-system telemetry, monitor:
-
Open file descriptors
-
File descriptor utilization
-
Remaining capacity
Create thresholds before the configured operating-system limit is reached.
14. Configure JVM Monitoring — Optional
When JVM monitoring is enabled, analyze:
-
Heap
-
Memory
-
Garbage collection
-
Threads
-
JVM uptime
Correlate JVM conditions with ZooKeeper latency and outstanding requests.
15. Configure Disk Monitoring — Optional
Monitor the storage supporting ZooKeeper.
Analyze:
-
Disk utilization
-
Free capacity
-
Filesystem growth
-
Disk I/O
Create alerts before available storage becomes critical.
16. Configure Prometheus Metrics — Optional
When the ZooKeeper metrics provider is enabled, configure GermainUX to collect the approved Prometheus-compatible metrics.
Depending on ZooKeeper version and metrics exposed, analyze:
-
Request rate
-
Response latency
-
Node metrics
-
JVM metrics
Use the metrics available from the deployed ZooKeeper version rather than assuming every metric exists in every environment.
17. Configure ZooKeeper Log Monitoring
Configure the path to the ZooKeeper log files.
Do not use the current incorrect wording:
Tomcat log files
Configure the applicable log directory and parsing for your ZooKeeper environment.
Monitor for:
-
Errors
-
Warnings
-
Startup events
-
Shutdown events
-
Connection failures
-
Session issues
-
Leader-election events
-
Repeated operational problems
18. Configure Monitoring Frequency
Configure a collection interval appropriate for the environment.
Consider:
-
ZooKeeper criticality
-
Request volume
-
Required detection time
-
Number of ensemble members
-
Monitoring overhead
Use a shorter interval for critical production ensembles when appropriate.
19. Configure KPIs
Configure the ZooKeeper KPIs available in the installed GermainUX version.
Typical monitoring areas include:
-
Availability
-
Latency
-
Requests
-
Connections
-
Watches
-
Outstanding requests
-
JVM
-
Disk
-
Logs
Use the actual KPIs exposed by the configured monitoring methods.
20. Configure Measures
Measures can include:
-
Node availability
-
Uptime
-
Average latency
-
Minimum latency
-
Maximum latency
-
Request rate
-
Outstanding requests
-
Client connections
-
Watch count
-
Open file descriptors
-
JVM heap
-
Garbage collection
-
Disk utilization
21. Configure Analysis Dimensions
Analyze ZooKeeper data by:
-
Environment
-
Ensemble
-
Server
-
Node
-
Leader or follower state
-
Host
-
Metric
-
Error
-
Time period
22. Configure SLAs
Examples include:
Availability
ZooKeeper Node Availability < Expected SLA
Latency
Average Latency > Threshold
Outstanding Requests
Outstanding Requests > Threshold
Connections
Connection Failures > Expected Threshold
File Descriptors
File Descriptor Utilization > Threshold
Disk
Disk Utilization > Threshold
JVM
JVM Memory Utilization > Threshold
Thresholds should reflect normal behavior for the ZooKeeper environment.
23. Configure Rules and Automated Analysis
Create Rules such as:
ZooKeeper Node Unavailable
Leader Missing
Repeated Leader Elections
Latency Increasing + Outstanding Requests Increasing
Connection Failures + Network Errors
High Watch Count + Increased JVM Memory
Low Disk Capacity + ZooKeeper Log Errors
High JVM GC + Increased Request Latency
File Descriptor Utilization Approaching Limit
24. Configure Alerts and Watches
Examples include:
ZooKeeper Node Unavailable → Alert Operations
Leader Instability → Notify Platform Team
Latency Above SLA → Notify Application and Infrastructure Teams
Outstanding Requests Increasing → Alert ZooKeeper Support
Disk Capacity Low → Notify Infrastructure Team
New Critical ZooKeeper Log Error → Alert Support
GermainUX can trigger:
-
Alerts
-
Watches
-
Reports
-
Approved diagnostics
-
Approved automation
25. Configure Maintenance Windows
Define maintenance windows for:
-
ZooKeeper upgrades
-
Java upgrades
-
Operating-system maintenance
-
Node replacement
-
Ensemble reconfiguration
-
Planned restart
-
Network maintenance
Use maintenance windows to suppress expected alerts during approved changes.
26. Configure Dashboards
Ensemble Health
Monitor:
-
Node availability
-
Leader
-
Followers
-
Membership
-
Connection health
Performance
Monitor:
-
Latency
-
Throughput
-
Outstanding requests
-
Connections
-
Watches
JVM and Infrastructure
Monitor:
-
JVM memory
-
Garbage collection
-
Threads
-
CPU
-
Memory
-
Disk
-
Network
Errors
Monitor:
-
ZooKeeper log errors
-
Connection failures
-
Timeouts
-
Leader-election activity
27. Validate the Configuration
Verify:
-
All required ZooKeeper nodes report data.
-
Leader and follower states are visible.
-
Latency is collected.
-
Request metrics are collected.
-
Connections are visible.
-
Watches are collected.
-
Outstanding requests are available.
-
Prometheus metrics appear when enabled.
-
JVM metrics appear when configured.
-
Disk and infrastructure metrics appear when configured.
-
ZooKeeper logs are collected.
-
SLAs evaluate correctly.
-
Alerts and Watches operate as expected.
Troubleshooting
No ZooKeeper Data
Verify:
-
Engine is online.
-
ZooKeeper server is reachable.
-
Correct hostname and port are configured.
-
Required four-letter-word commands are enabled.
-
Firewall permits access.
Four-Letter-Word Command Fails
Verify:
-
Command is included in
4lw.commands.whitelist. -
ZooKeeper configuration was reloaded through the appropriate restart procedure.
-
Correct ZooKeeper port is used.
-
Network access is allowed.
Prometheus Metrics Are Missing
Verify:
-
Metrics provider is enabled.
-
Configured metrics port is correct.
-
ZooKeeper was restarted after configuration.
-
Engine can reach the metrics endpoint.
-
Firewall permits the connection.
ZooKeeper Logs Are Missing
Verify:
-
Correct ZooKeeper log path is configured.
-
Monitoring component has read access.
-
Log rotation has not changed the active path.
-
Log parser is configured correctly.
Leader Information Is Missing
Verify:
-
Required server command is enabled.
-
All ensemble members are monitored.
-
ZooKeeper node is responding.
-
Monitoring output contains server-mode information.
JVM Metrics Are Missing
Verify:
-
JVM monitoring is enabled.
-
Java process is accessible.
-
Required permissions are available.
-
Monitoring method is compatible with the deployed Java version.
ℹ️ Get More Information
GermainUX can help determine which monitoring, analytics and automation capabilities are appropriate for your Zookeeper environment. Contact GermainUX Support.
Component: Engine
Feature Availability: 2017.4 or later