

What Is Monitored
How It Works
Deploy
KPIs
Overview
GermainUX watches the Elasticsearch clusters your applications search and index into. You see the cluster status, the number of nodes and shards, and the CPU, memory, disk and JVM heap of every node. KPIs with default SLAs and an Elasticsearch Overview dashboard come ready to use. A cluster that turns yellow or red, a node that leaves, or a disk that nears its watermark raises an alert before searches start to fail. This page covers Elasticsearch clusters that you run for your own applications. To set up Elasticsearch as the GermainUX datastore, see Elasticsearch On Premise.Cluster Status over Time
Every Node Side by Side
Disk Before It Blocks Writes
Your Own Queries as KPIs
Questions It Answers
- Is the cluster green right now, and when was it last yellow or red?
- Which node left the cluster, and for how long?
- Which node is running short of JVM heap or disk?
- Are all shards active again after a restart?
- Is each rollup job still processing documents?
- Does the cluster’s REST endpoint answer from the Engine?
What Is Monitored
Analytics, Alerts and Automation
AI Analysis
Ask AI Explore questions such as “Which Elasticsearch node had the highest heap usage this week?” Outlier detection flags a node whose heap, CPU or disk usage moves outside its normal range.Dashboards and Reports
In the left menu, go to Dashboards > All, and then open the Elasticsearch Overview dashboard. It shows the cluster status over time, the CPU, memory, JVM heap and disk usage of each node, read and write operations, thread count, and the documents processed by rollup jobs. You can build your own dashboards and reports on the same KPIs. The node charts show the monitors whose application isElasticsearch. Use that application name when you deploy the monitor.
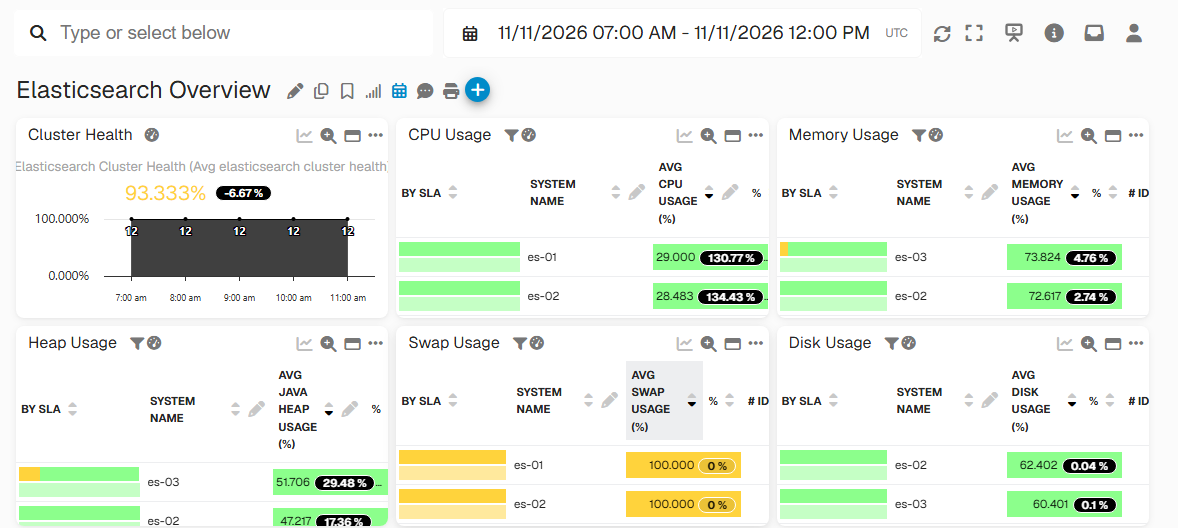
Elasticsearch Overview Dashboard - GermainUX
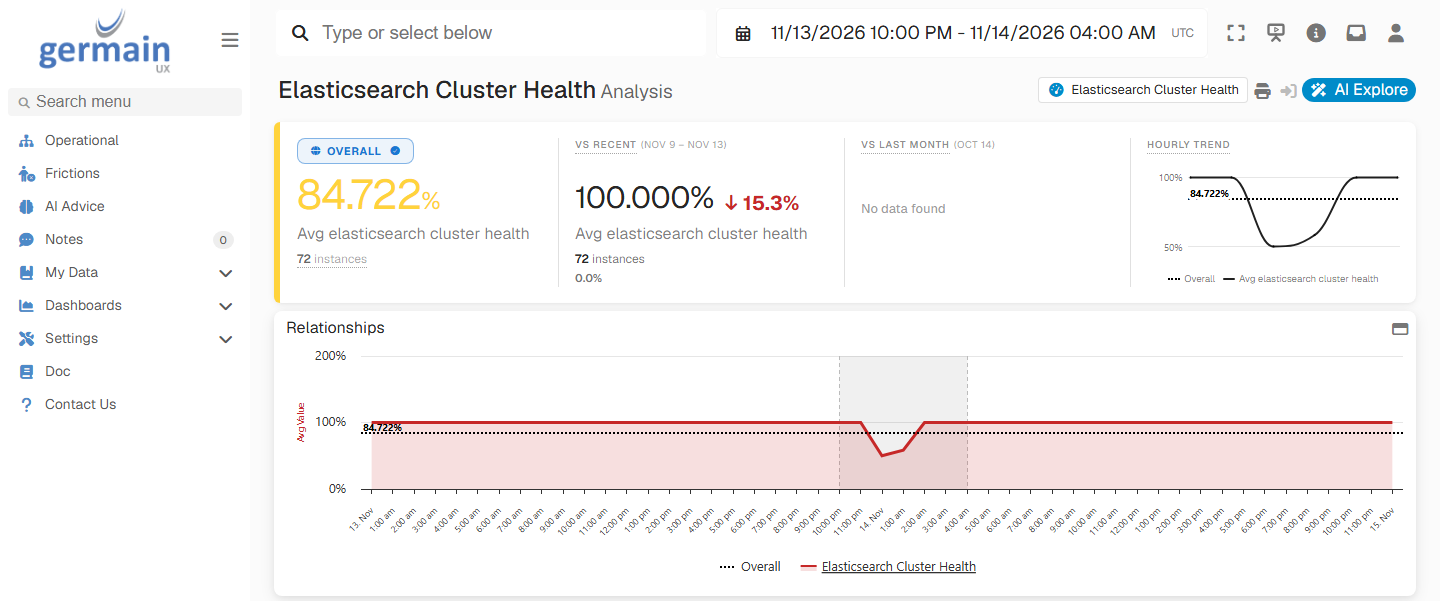
Analysis of Elasticsearch Cluster Health - GermainUX
Analysis
Each walkthrough below opens one KPI in the Analysis screen. The top row compares the selected hours with the same hours on the previous days, and shows the trend. The relationships chart shows the KPI over the days around the selected period, which is highlighted. The segmentation breakdown lists the leading factors, and Show all segments lists each node, cluster and endpoint with its own value.Investigate Heap Pressure on a Node
When searches slow down or a node stops answering, open the Java Heap Usage KPI. The average across all nodes can hide one node in trouble, so look at the leading factors, and click Show all segments to compare the nodes under By System Name. In the example below, a dashboard runs wide aggregations onsearch-prod, and the heap of es-03 climbs past the 75% SLA. Between 08:00 and 10:00 UTC on 11 November, the average heap usage is 51.016%, up 12.1% on the previous days. The breakdown marks es-03 as degraded, at 65.188% and up 45.1%, while es-01 and es-02 stay near 46%. es-03 has 16 readings instead of 24, because it then drops out of the cluster. The SLA on Java Heap Usage raises an alert while the heap is still climbing.
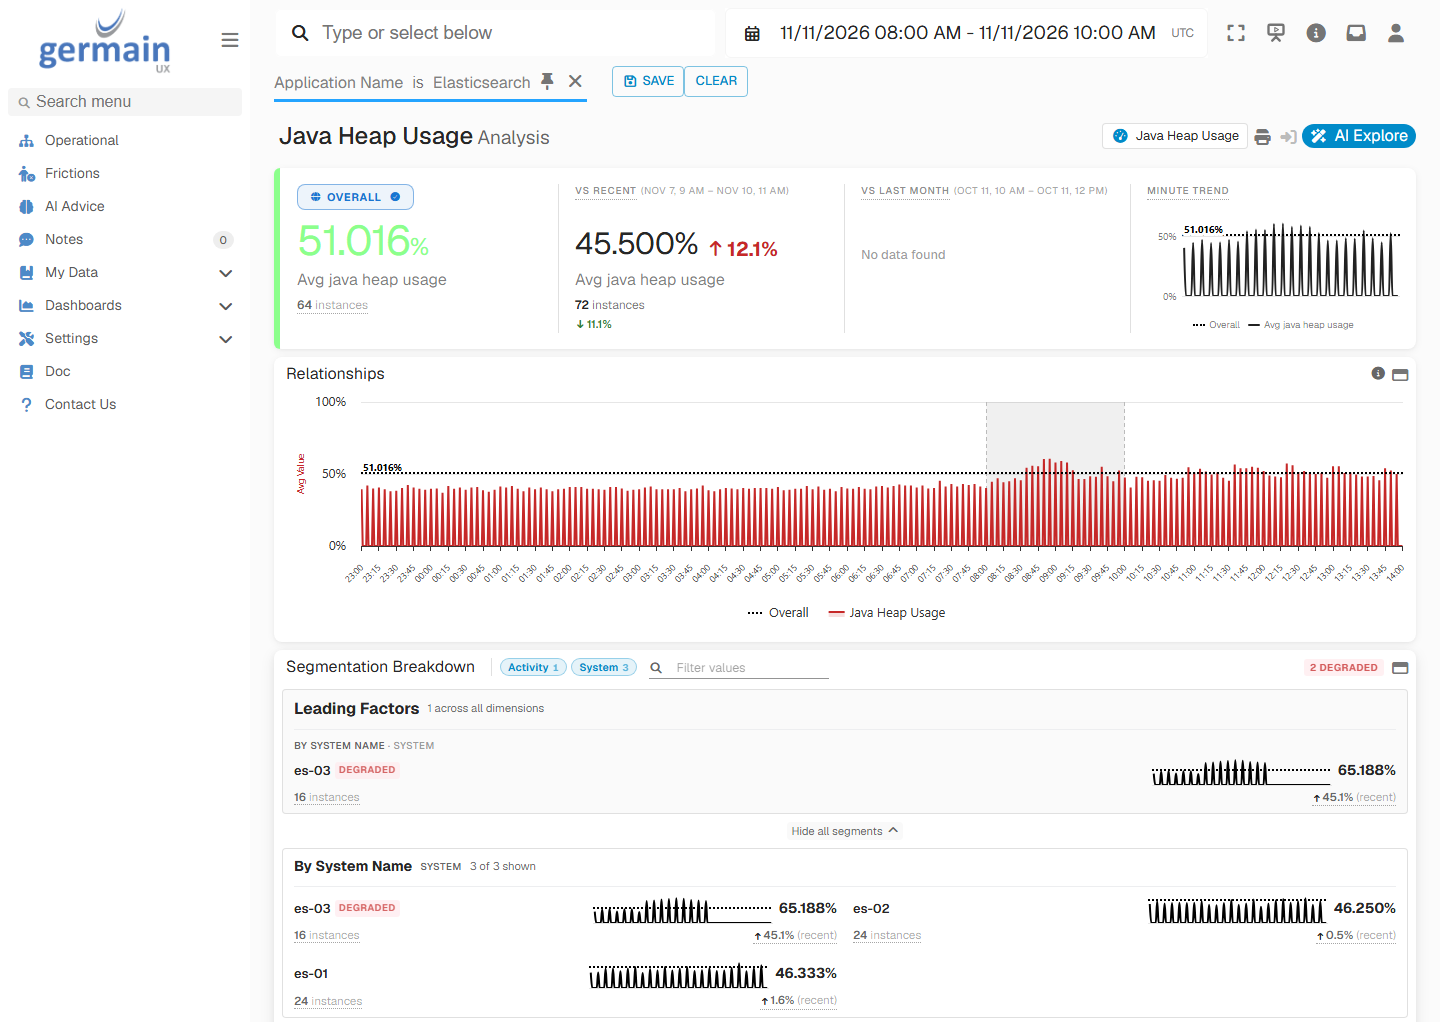
Analysis of Java Heap Usage - GermainUX
Investigate a Node That Leaves the Cluster
When the cluster turns yellow, open the Elasticsearch Cluster Node Count KPI. The top row shows how many nodes the cluster had on average, against the previous days, and the hourly trend shows when a node left and came back. In the example below, es-03 drops out of the cluster after the heap pressure above. The cluster is yellow while Elasticsearch rebuilds the replicas of es-03 on es-01 and es-02. Between 07:00 and 12:00 UTC on 11 November, the cluster averages 2.850 nodes against 3.000 on the previous days, down 5.0%. The hourly trend dips and recovers when es-03 rejoins, about 45 minutes later.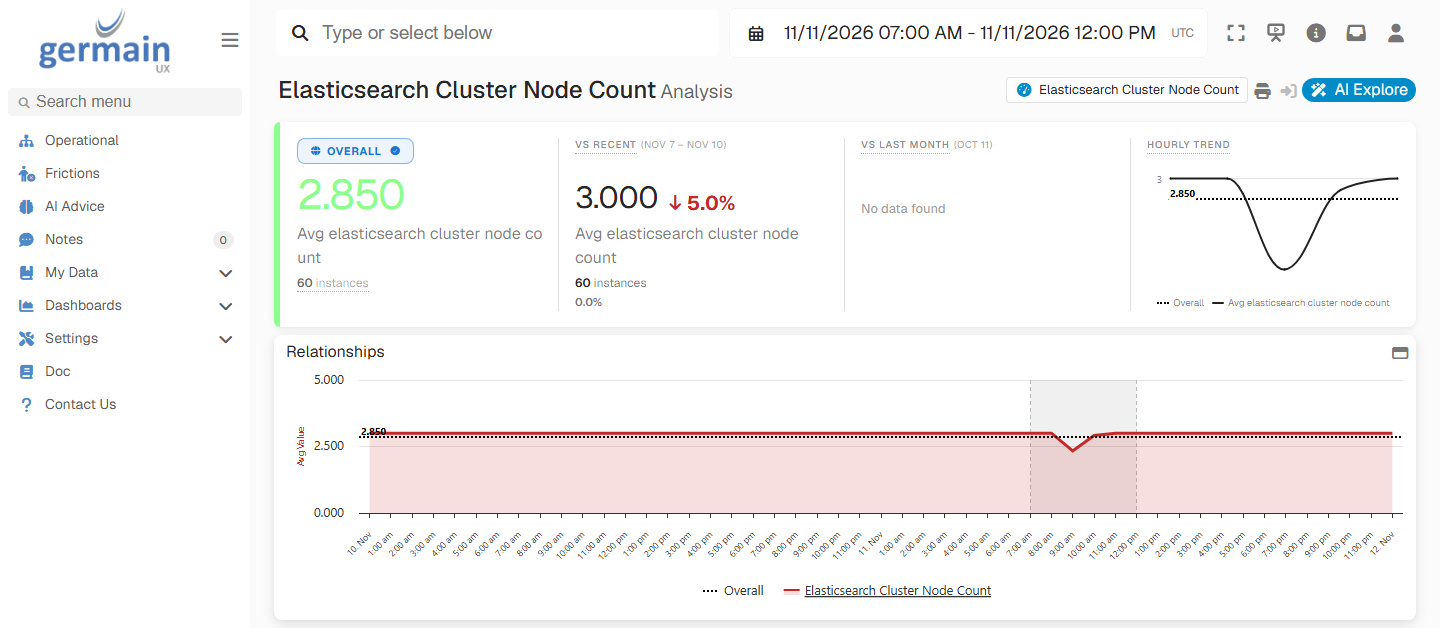
Analysis of Elasticsearch Cluster Node Count - GermainUX
Investigate a Disk Watermark
When a node’s disk passes the low disk watermark, Elasticsearch Errors records an event, and Elasticsearch stops placing new shards on that node. Open the Disk Usage KPI to see which node is filling up and how fast. Click Show all segments to compare the nodes under By System Name. In the example below, log indices that are never deleted fill the disk of es-02 past the85% low watermark. Between 05:00 and 16:00 UTC on 13 November, the average disk usage is 64.408%, up 6.8% on the previous days. Under By System Name, es-02 averages 73.550%, up 18.0%, while es-01 and es-03 stay near 59% and 61%. The line of es-02 climbs for several hours, and drops once the old indices are deleted. The Disk Usage SLA of 75% warns you before the node reaches the watermark.
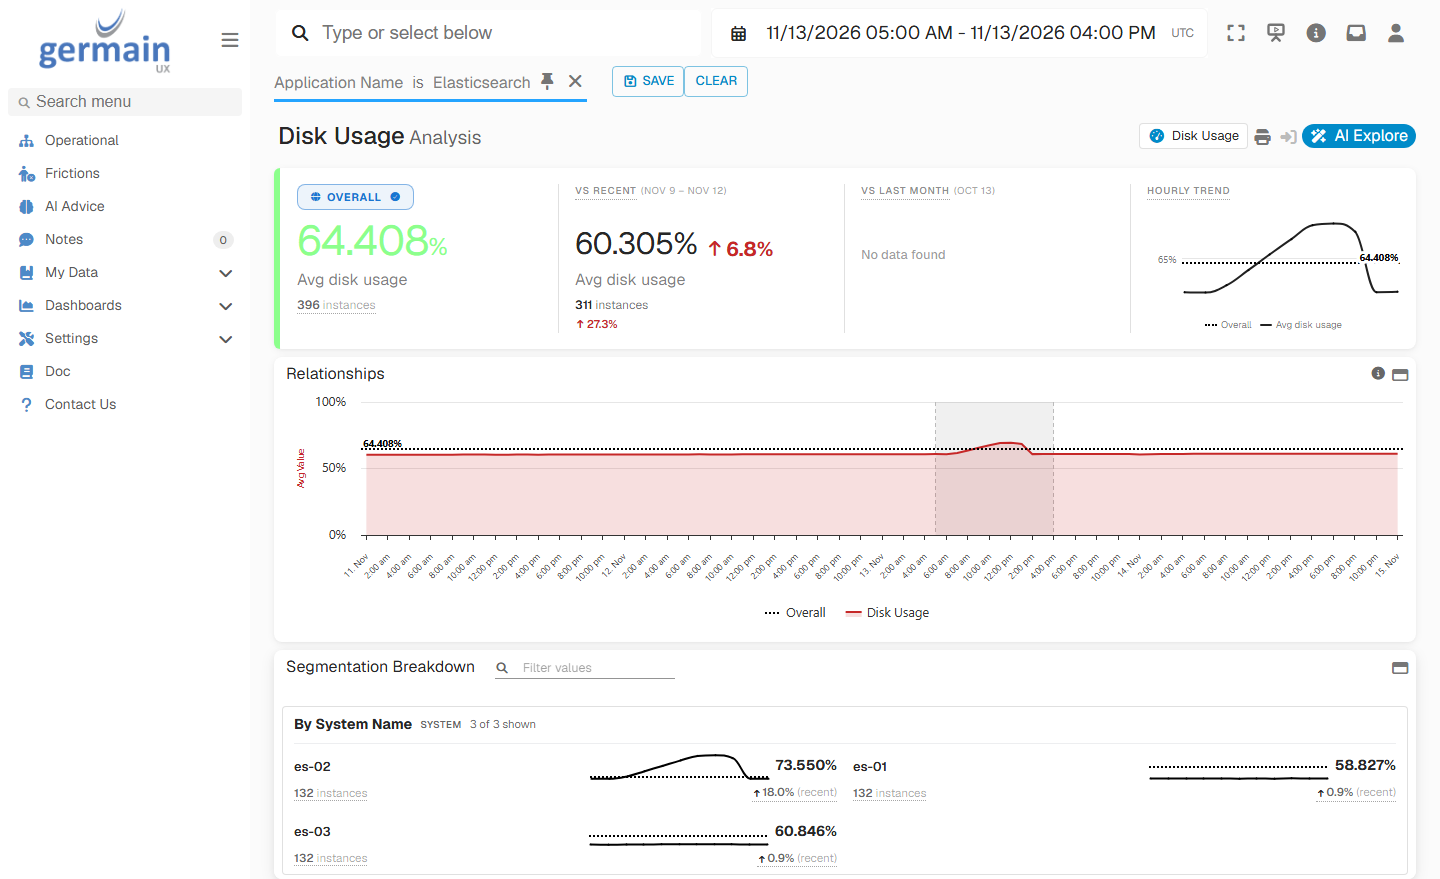
Analysis of Disk Usage - GermainUX
Investigate a Red Cluster After a Restart
When the cluster turns red, some primary shards have no copy on any node. Open the Elasticsearch Cluster Health KPI, as in the analysis under Dashboards and Reports, to see how long the cluster stayed red. Then open Elasticsearch Active Shards to see how many shards were missing, and whether all of them are active again. In the example below, es-02 restarts for patching at night. Theaudit index has two primary shards and no replicas, both on es-02, so the cluster stays red until es-02 is back. Between 22:00 UTC on 13 November and 04:00 UTC on 14 November, the cluster averages 86.125 active shards, against 88.000 on the previous days, down 2.1%. The hourly trend dips while es-02 is away, and returns to all shards active once it rejoins.
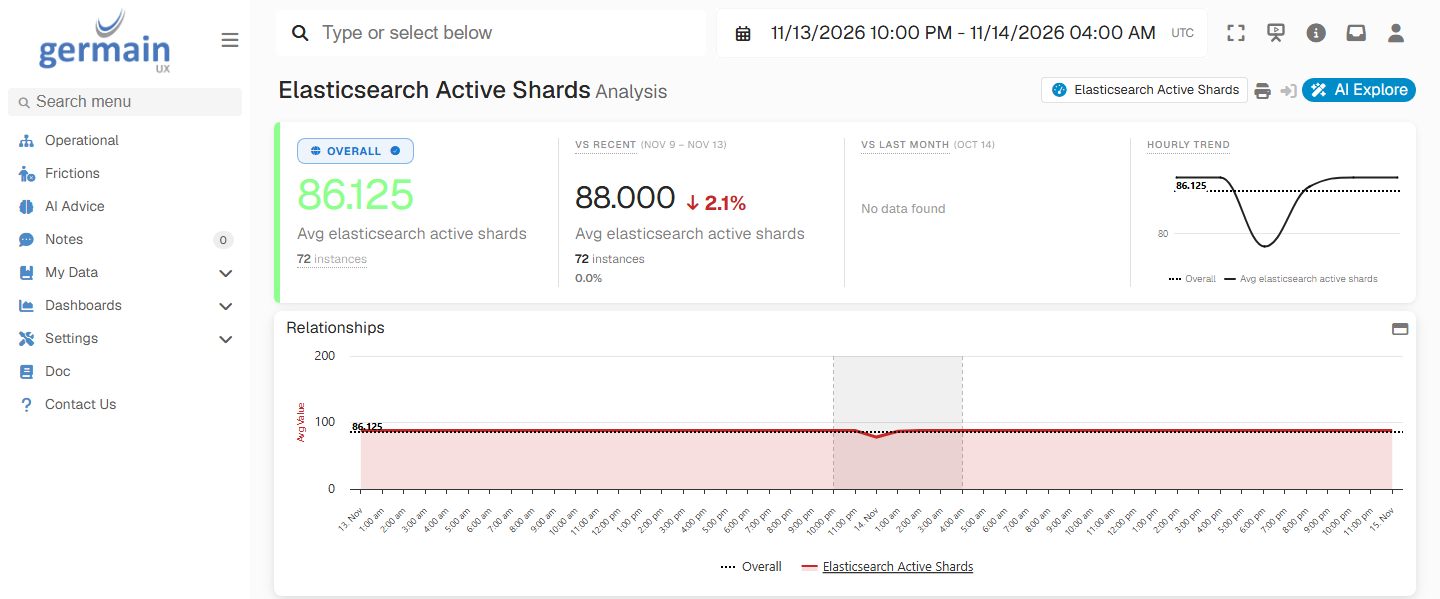
Analysis of Elasticsearch Active Shards - GermainUX
Investigate an Unreachable Cluster Endpoint
When the Elasticsearch charts stop updating, open the HTTP Availability KPI. It shows whether the cluster’s REST endpoint answered each poll. While the endpoint doesn’t answer, the other Elasticsearch KPIs get no values. In the example below, the load balancersearch-prod-lb doesn’t answer for 25 minutes during network maintenance. Between 06:00 and 11:00 UTC on 15 November, availability averages 91.667%, against 100.000% on the previous days, down 8.3%. The breakdown marks search-prod-lb as degraded, at 0.000% for its 5 failed polls. The HTTP Availability SLA of 95% raises an alert when the endpoint stops answering.
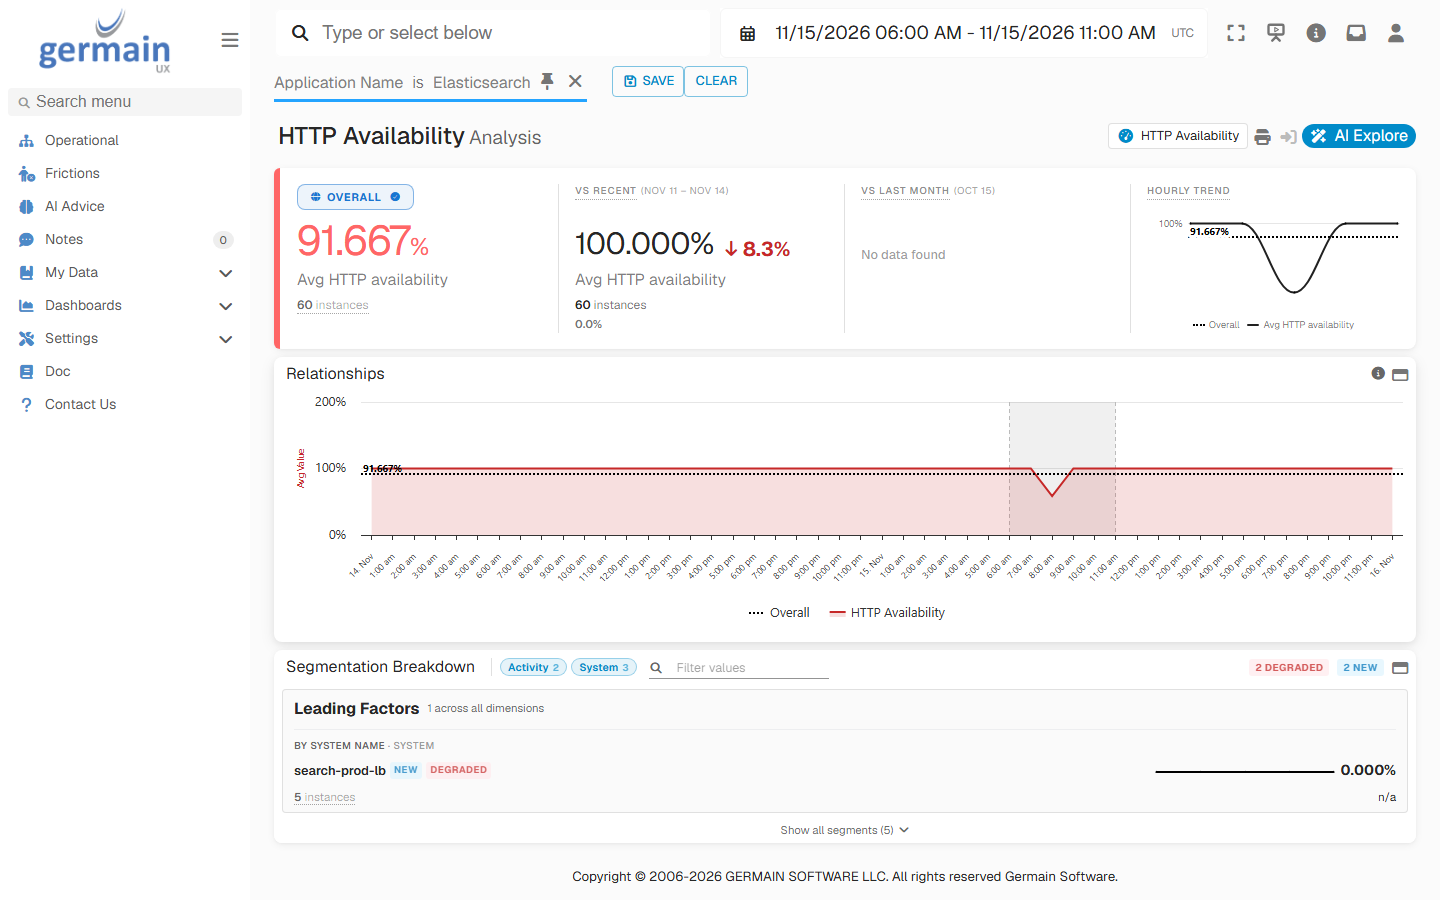
Analysis of HTTP Availability - GermainUX
SLAs and Alerts
The cluster KPIs come with default SLAs, listed under KPIs. Get an alert by email, SMS, Slack or Teams when the cluster turns yellow or red, when a node’s heap or disk stays over its limit, or when the endpoint stops answering.Automation
When an SLA is breached, an automated action can run a diagnostic script, call an HTTP endpoint or open an incident.Correlation with Other Technologies
Correlate the cluster’s health with the applications that use it, such as a Java service whose searches slow down while a node is short of heap.How It Works
Before You Start
- A GermainUX Engine can reach the cluster’s REST port, usually
9200. See GermainUX Engine. - If the cluster has security turned on, an Elasticsearch user for GermainUX. For cluster monitoring, it needs the
monitorcluster privilege and themonitorindex privilege. For the Query Monitor, it also needsreadon the indices you query. - That user is saved as credentials in Settings > Data Sources > Credentials. See Data Sources.
Deploy
- Cluster Monitoring
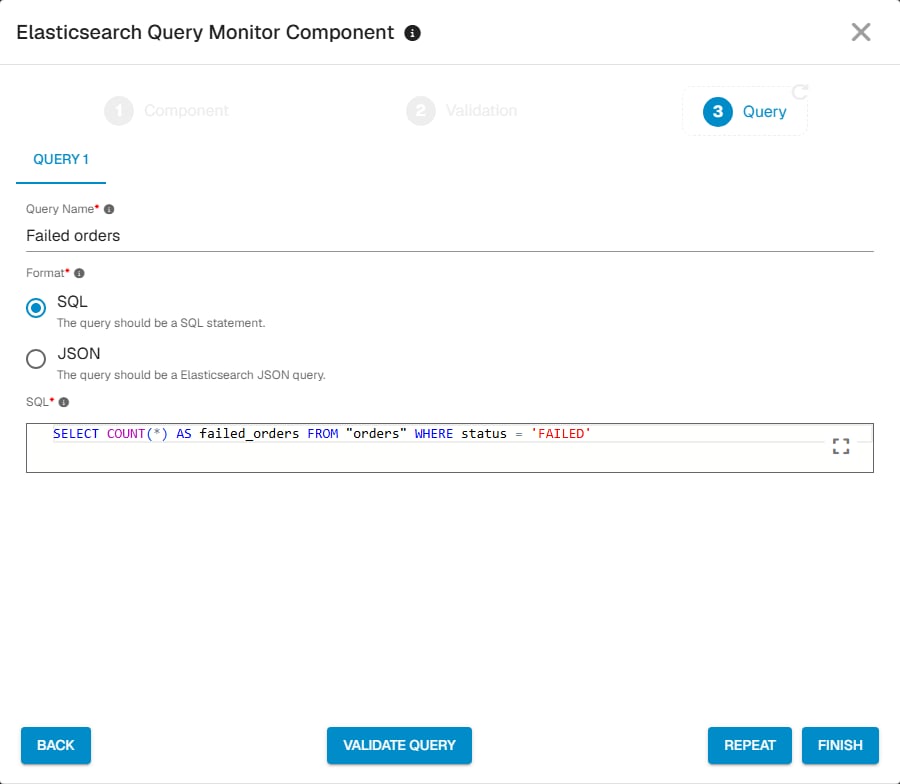
- Query Monitor
Open the HTTP Scenario wizard
Choose the cluster endpoint
Select the Elasticsearch HTTP Monitor
Elasticsearch HTTP Monitor.If you selected credentials, click Show Advanced, and set Auth Policy to Basic. Without an auth policy, GermainUX doesn’t send the credentials to the cluster.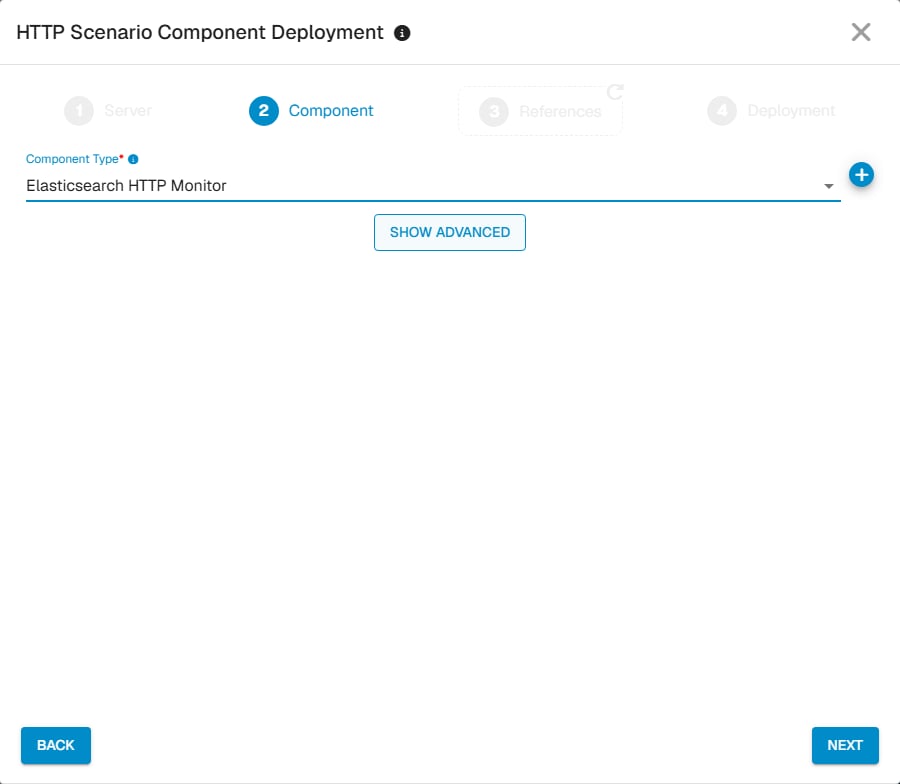
HTTP Scenario Component Deployment Wizard for Elasticsearch - GermainUX
Deploy the monitor
Validate
Check the cluster from the Engine
ES_HOST with the host in the URI data source, and ES_USER with the Elasticsearch user. Leave out -u ES_USER if the cluster has security turned off. The response shows the cluster status that GermainUX reports.Find the cluster in GermainUX
Troubleshooting
No Elasticsearch data appears
No Elasticsearch data appears
curl command under Validate, that the Component Type is Elasticsearch HTTP Monitor, and that the scheduled time has passed. With the default schedule, the first poll can take up to an hour.The node charts on the dashboard are empty
The node charts on the dashboard are empty
Elasticsearch. Set Application Name to Elasticsearch on the HTTP monitor.The Query Monitor runs, but no KPI values appear
The Query Monitor runs, but no KPI values appear
The Query Monitor can't connect to an HTTPS cluster
The Query Monitor can't connect to an HTTPS cluster
https:// URL in JDBC URL.Security and Privacy
Elasticsearch monitoring data includes:- Infrastructure identifiers: the cluster name, and the name and IP address of each node
- Query results: the Query Monitor stores the fields that your queries return and your rule maps. Indexed documents can hold personal data or free text, so treat these results as possibly containing personal or customer data.
KPIs
Related Documentation
Synthetic HTTP Execution
Create a Rule
Automation
Get Help
The GermainUX team can help you write Query Monitor rules for your indices, and tune the SLAs to your cluster.Contact GermainUX Support
Can't Find What You Need?
The content of this document is proprietary to GERMAIN SOFTWARE.