

What Is Monitored
How It Works
Deploy
KPIs
Overview
GermainUX shows how your Oracle Knowledge Management (formerly InQuira) deployment is used and whether it works. You see how many knowledge searches each channel made in the last 24 hours, the errors and stuck threads the InQuira servers log, and whether agents can sign in. A synthetic browser check signs in on a schedule, so a broken single sign-on page shows up before the first agent calls the help desk. Your team sees a drop in self-service searches, or a search server failing, as it happens.Search Volume by Channel
Errors and Stuck Threads
Sign-In Tested Around the Clock
Console Logins
Questions It Answers
- Did searches from web self-service drop today?
- Which channel makes the most knowledge searches?
- Which InQuira error codes are new, or happening more often?
- Are threads getting stuck on any server?
- Can agents sign in right now, and how long does it take?
- Who signed in to the InQuira console this week?
What Is Monitored
Analytics, Alerts and Automation
AI Analysis
Ask AI Explore questions such as “How did chat bot searches change this week?” Outlier detection flags a channel whose search volume drops or spikes. Error categorization groups similar error messages, so a new error stands out.Dashboards and Reports
The Oracle Knowledge Management Overview dashboard shows search volume by source, the duration of the sign-in check and its sign-in step, and failed sign-in checks. Build your own dashboards and reports on errors by code and server, or any other KPI.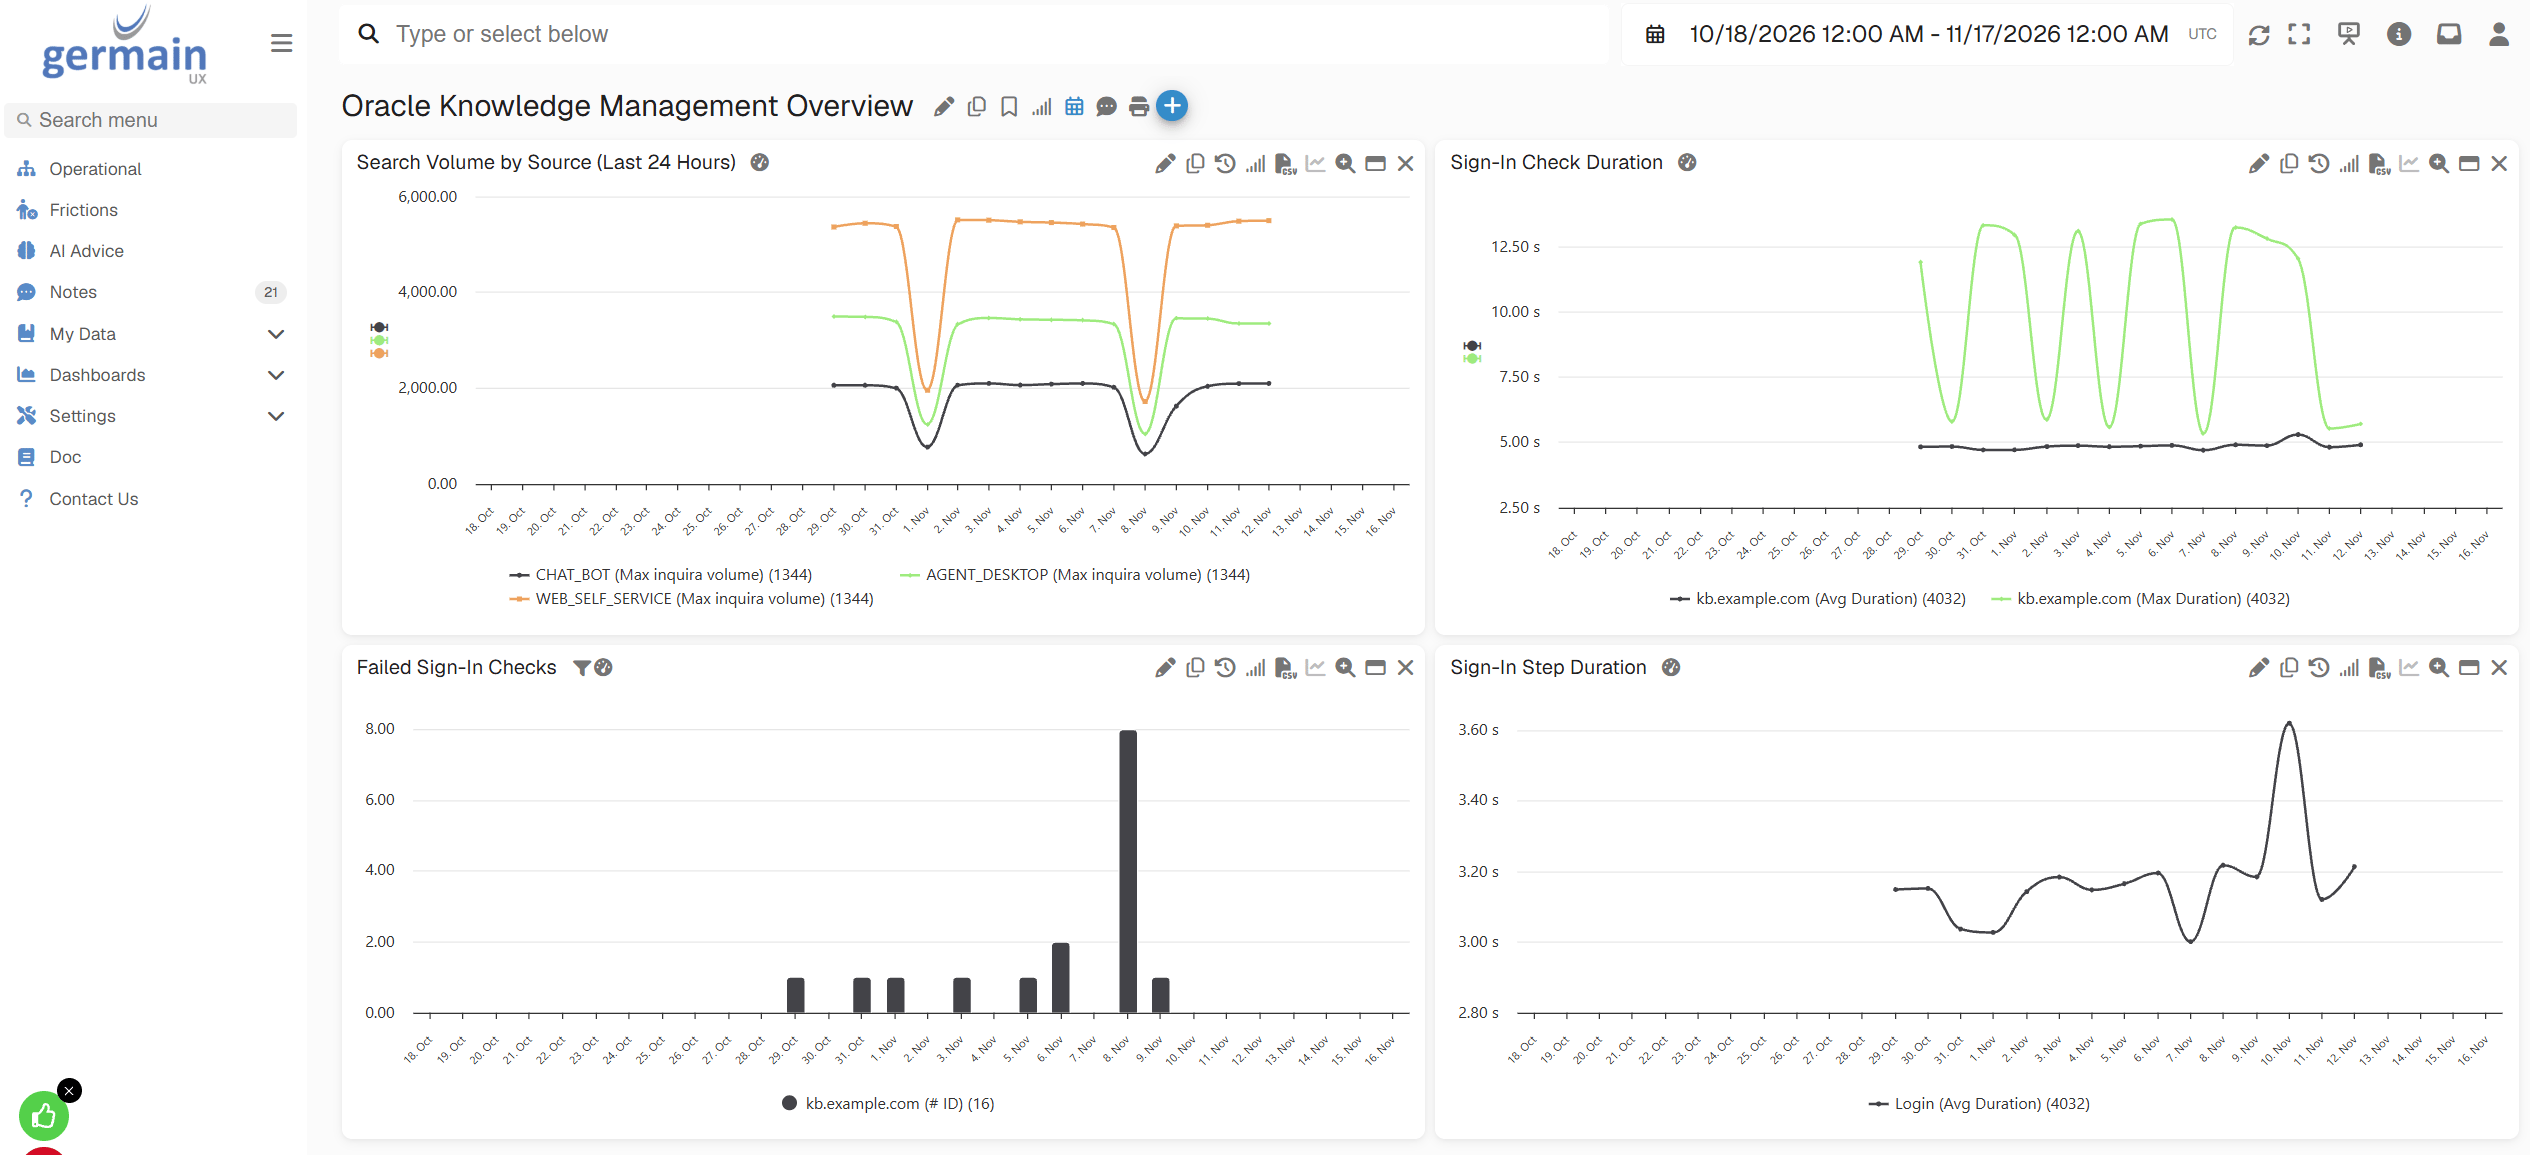
Oracle Knowledge Management Overview Dashboard - GermainUX
SLAs and Alerts
The sign-in check feeds the Synthetic Click and Synthetic Scenario KPIs, whose default SLAs flag a failed or slow sign-in. Add an SLA on Inquira Volume to hear about a channel whose searches stop. Get an alert by email, SMS, Slack or Teams when an SLA is breached.Automation
When an SLA is breached, an automated action can run a diagnostic script, call an HTTP endpoint or open an incident.How It Works
Before You Start
- A GermainUX Engine can reach the InQuira data warehouse database and the Oracle Knowledge Management URL.
- A database account can read
DW_STAGE.DW_STG_DATA. - The Engine that runs the log monitor can read the InQuira log directory.
- Chrome is installed on the Engine that runs the sign-in check.
- An Oracle Knowledge Management account for the sign-in check, used for nothing else.
Deploy
Each monitor has its own wizard. In the left menu, go to Settings > Wizards to find them. Deploy only the monitors you need.Search Volume
Open the Database Query Monitor Deployment wizard
Connect to the data warehouse
Oracle Knowledge. Click Next.Choose the component
Deploy it to the Engine
0 0 * * * *, runs once an hour. Finish the wizard.Log Monitoring
Deploy the parser
Deploy the log directory monitor
Synthetic Sign-In Check
Open the Synthetic Web Component Deployment wizard
Enter the server and account
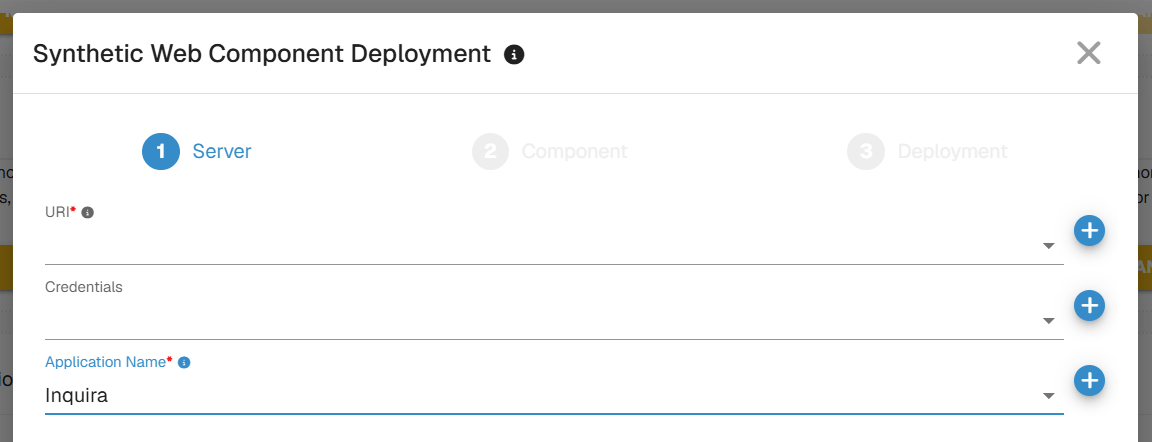
Synthetic Web Component Deployment Wizard, Server Step - GermainUX
Choose the component
Deploy it to the Engine
0 */5 * * * * to test the sign-in every 5 minutes. Finish the wizard.Validate
Check the search volume
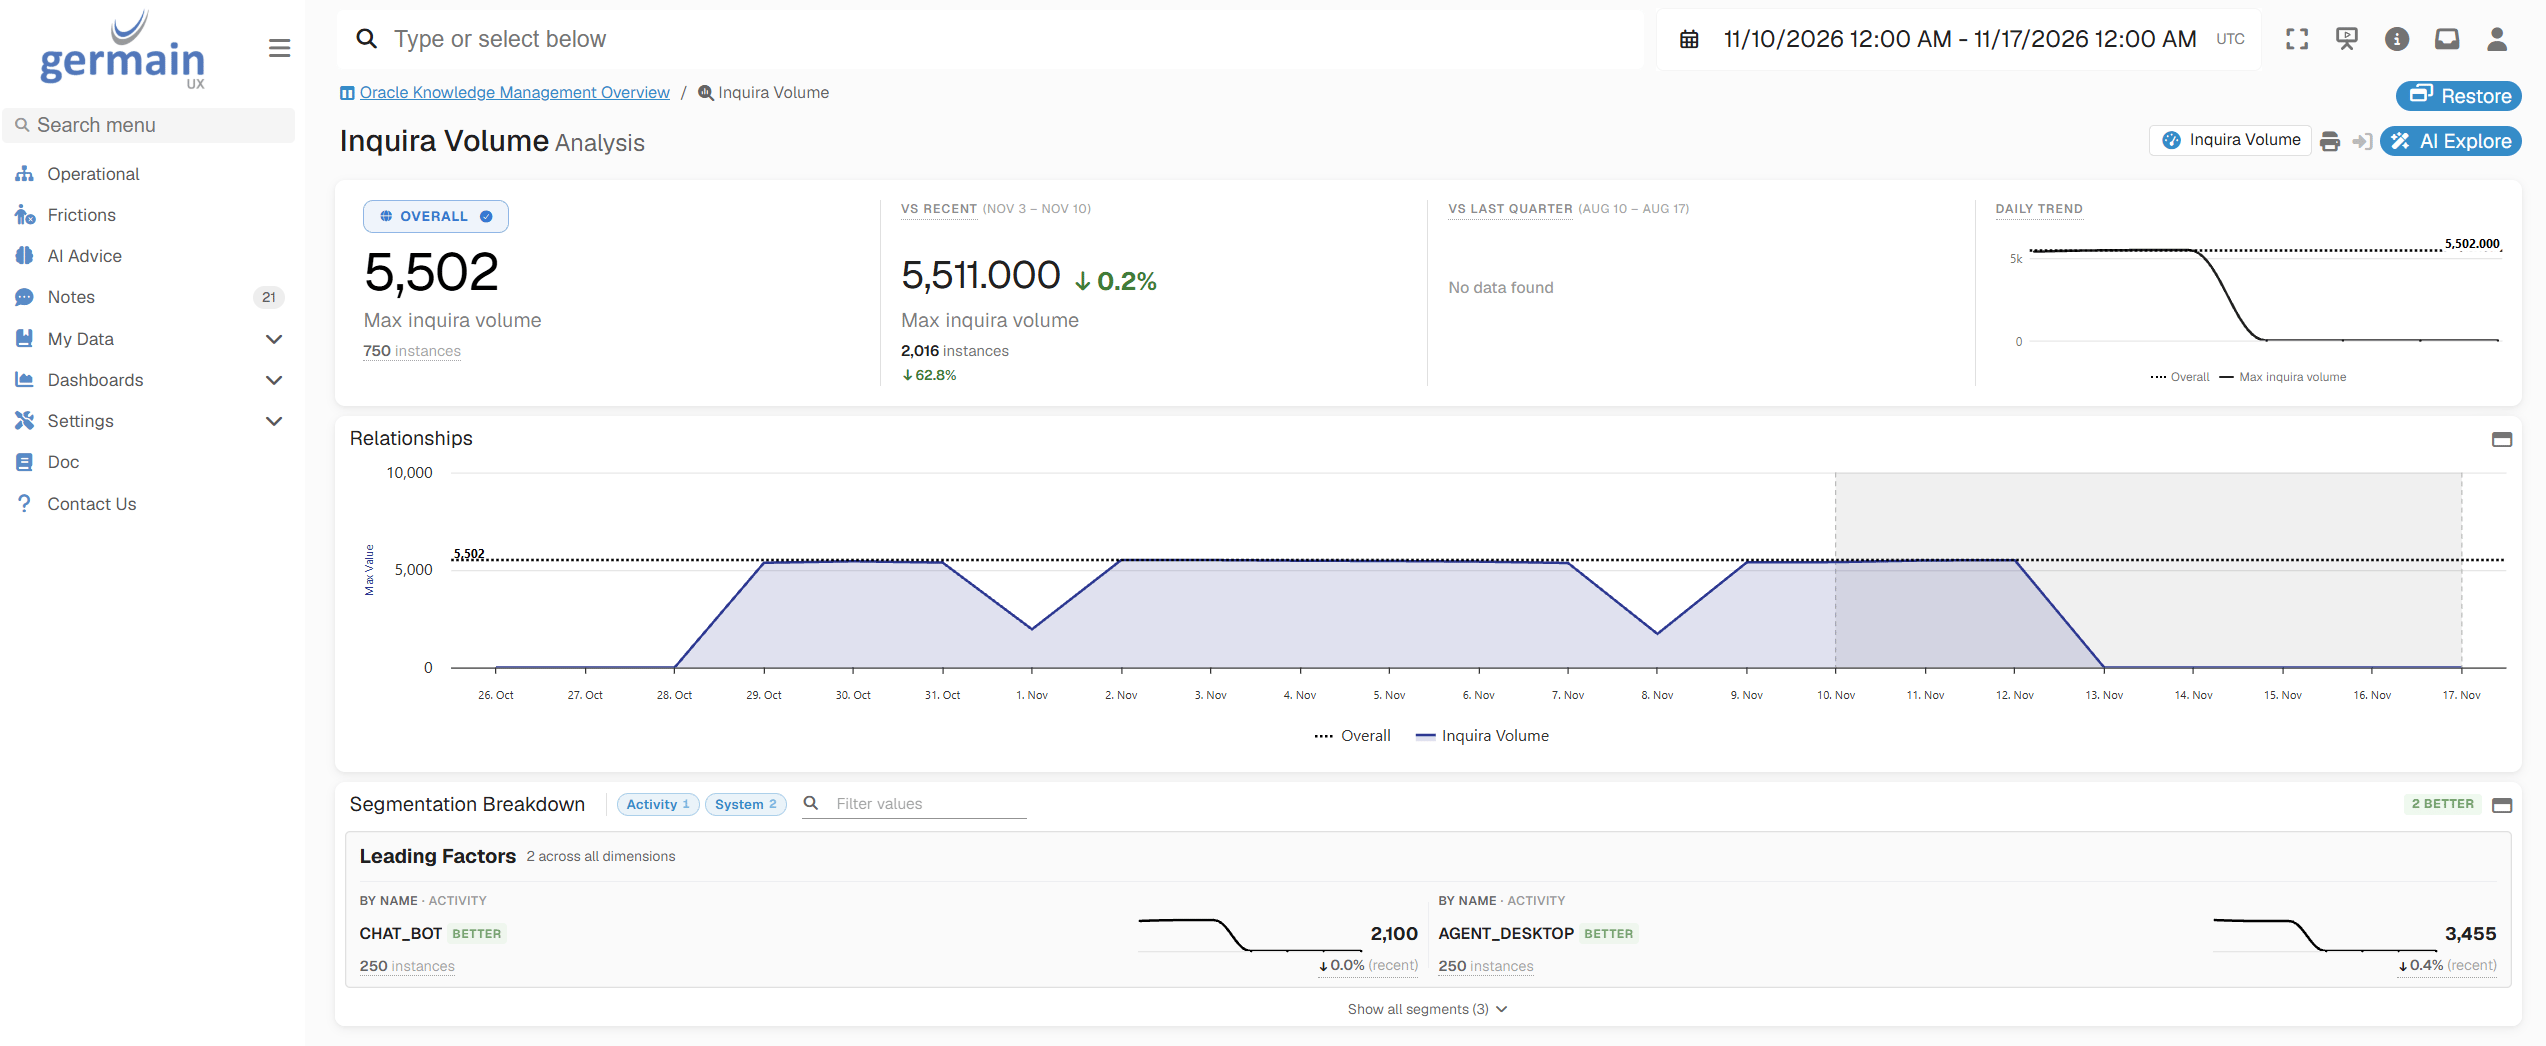
Search Volume by Source in the Inquira Volume KPI - GermainUX
Check the sign-in
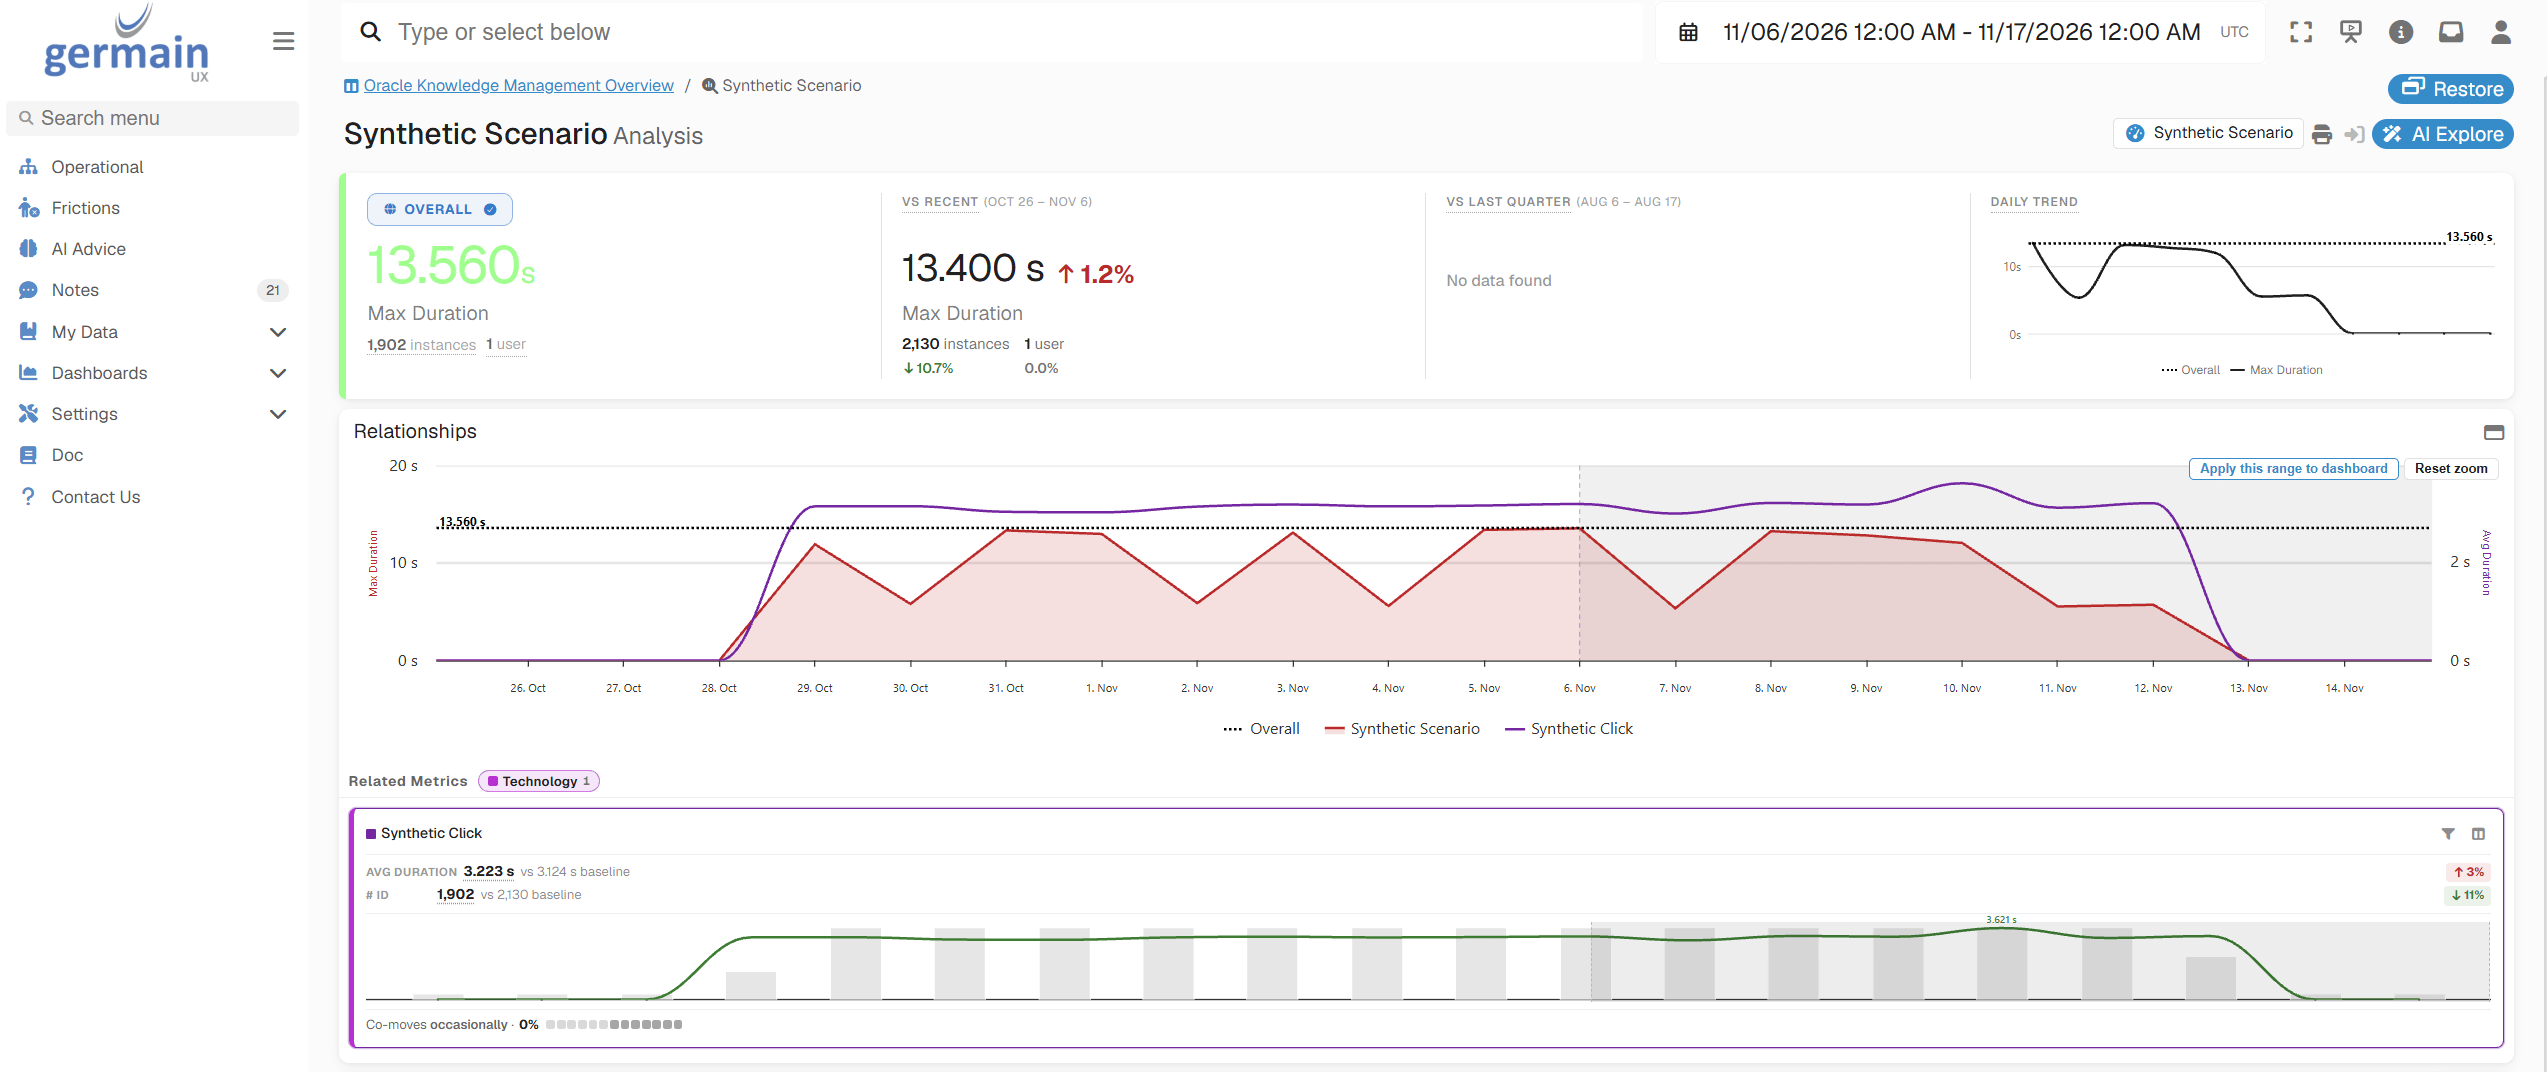
Sign-In Check Duration in the Synthetic Scenario KPI - GermainUX
Troubleshooting
Inquira Volume shows no data
Inquira Volume shows no data
select QUERY_SOURCE, COUNT(1) from DW_STAGE.DW_STG_DATA in the data warehouse, and that the warehouse load is running. Rows without a QUERY_SOURCE aren’t counted.A channel's search volume falls to zero
A channel's search volume falls to zero
No log events appear
No log events appear
Inquira*.log or Inquira*.log1 and so on, and that the parser and the directory monitor are deployed on the same Engine.The sign-in check always fails
The sign-in check always fails
The sign-in check fails to start
The sign-in check fails to start
Security and Privacy
Oracle Knowledge Management monitoring data includes personal data:- Identity data: the user names of console logins, and the user name of the sign-in check account
- Screenshots and page content: each sign-in check stores a screenshot and the HTML of the page it reached, which shows whatever that page displays to the check account
- Free text: InQuira error messages, which contain whatever the servers write into them. Treat them as possibly containing personal or customer data.
KPIs
Related Documentation
Synthetic User Scenarios
Query Monitoring
File and Log Monitoring
Get Help
The GermainUX team can adapt the sign-in check to your single sign-on page, and add queries for other data warehouse figures.Contact GermainUX Support
Can't Find What You Need?
The content of this document is proprietary to GERMAIN SOFTWARE.