GermainUX reads the logs of your Oracle BI Publisher (BIP) servers and checks that they’re running. You see every error and warning the BI Publisher application and its WebLogic servers write, from failed reports and delivery errors to stuck threads, and how many WebLogic servers and Node Managers run on each host. An SLA tells you about each new error, so a broken data source or a bursting job that can’t send email is found before the report recipients notice. Your team stops searching bipublisher.log and the WebLogic logs host by host.
Report and Delivery Errors
Errors and warnings from the BI Publisher diagnostic log, such as failed reports, data engine errors and delivery failures.
WebLogic Server Events
Warnings and errors from the AdminServer and bi_server1 logs, with their WebLogic message ID, such as BEA-000337 for stuck threads.
Servers Running
How many WebLogic servers and Node Managers run on each host, checked every minute.
Every Host in One Place
Compare errors across BI Publisher hosts, and see who ran the report that failed.
Questions It Answers
Which BI Publisher reports failed today, and with what error?
Is bi_server1 running on every host right now?
Did the Node Manager start after the host was patched?
Why did bi_server1 restart?
Are threads getting stuck on a BI Publisher server?
Did a bursting job fail to deliver its reports by email?
Which users ran into report errors this week?
What Is Monitored
Area
What GermainUX monitors
BI Publisher diagnostic events
Each error and warning in the Oracle diagnostic logs: bipublisher.log, bi_server1-diagnostic.log and AdminServer-diagnostic.log, with its module, message and user
WebLogic server events
Each warning and error in the AdminServer.log and bi_server1.log server logs, with its subsystem, WebLogic message ID, server and user
Servers running
The number of running WebLogic server processes and Node Manager processes on the host
Availability
Up/down status and response time of the BI Publisher URL, checked on a schedule with synthetic HTTP checks
Real-user page performance, JavaScript errors and Session Replay for the BI Publisher pages your users work in, with RUM JS or the RUM Extension
Analytics, Alerts and Automation
AI Analysis
Ask AI Explore questions such as “Which BI Publisher errors happened most this week?” and get the answer without building a report. Error categorization groups similar messages, so a new error stands out from the known ones.
Dashboards and Reports
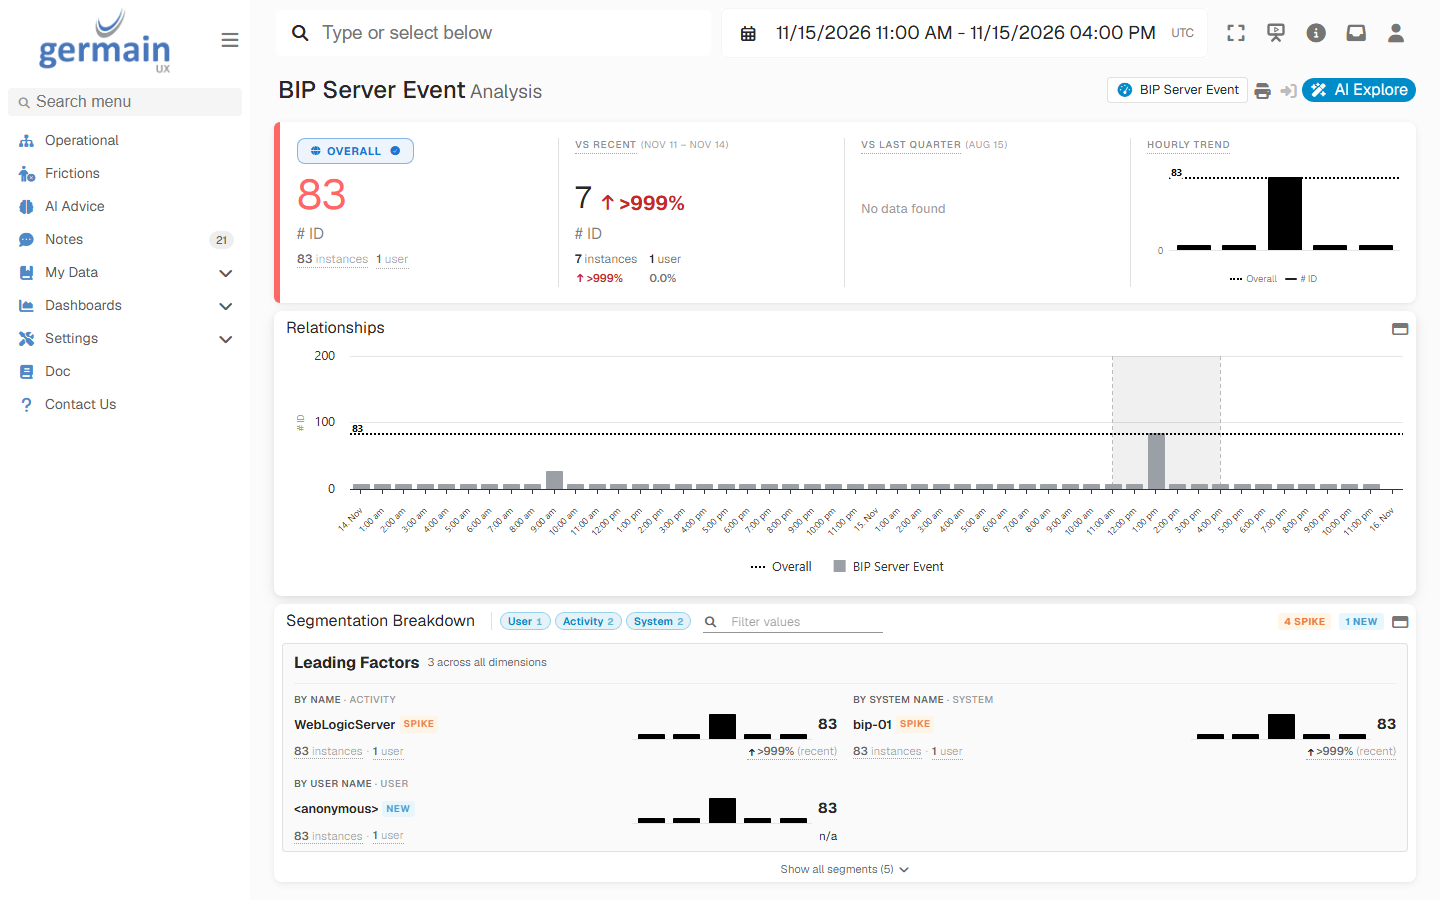
Build dashboards and reports on the BI Publisher KPIs: events per host and module, the WebLogic message IDs that occur most, and the server counts over time.Click a value to open it in the Analysis screen. In the example below, threads got stuck on bi_server1, and the WebLogic server events spiked with BEA-000337 messages.
Analysis of BIP Server Events During Stuck Threads - GermainUX
Analysis
Open a BI Publisher KPI in the Analysis screen to see what changed in the selected period. The top row compares the period with the same hours on the previous days, and shows the hourly trend. The relationships chart shows the KPI over a longer time range, with the selected period highlighted. The segmentation breakdown lists the hosts, users and message types that changed most, and labels each one, for example as a spike.
Investigate a Node Manager That Didn’t Start
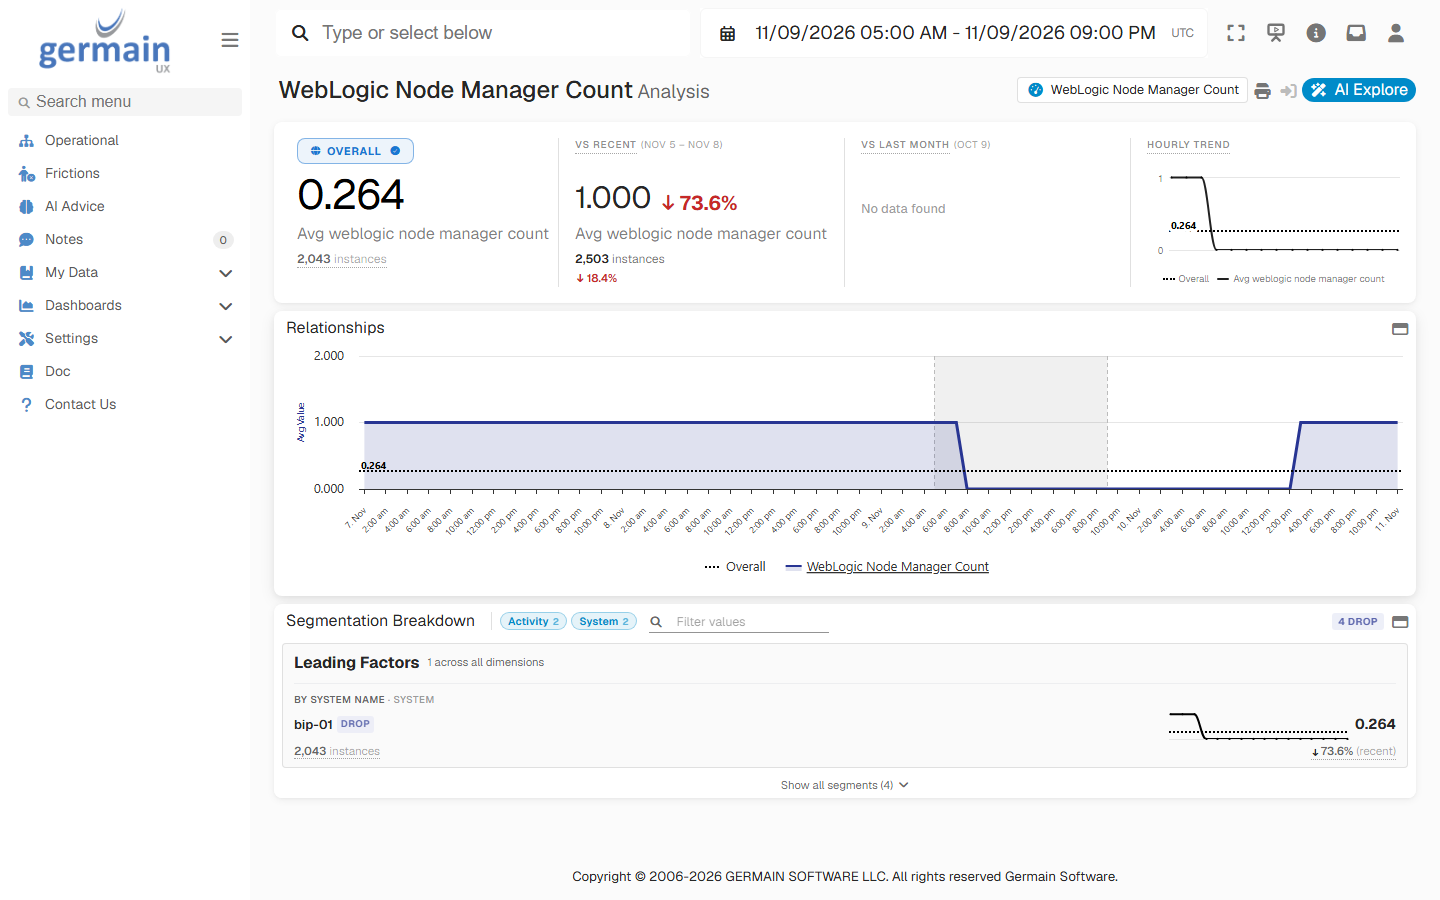
After a host is patched, the WebLogic servers can come back while the Node Manager doesn’t. Open the WebLogic Node Manager Count KPI in the Analysis screen. Compare the average count with the previous days, and use the hourly trend to see when it fell to 0.In the example below, bip-01 was patched on 9 November, and its Node Manager wasn’t started again. From 09:00 the count is 0. Over the day shown, the average count is 0.264, down 73.6% on the 1.000 of the previous days, and the breakdown marks bip-01 as a drop. The relationships chart shows the count at 0 until the Node Manager was started on the afternoon of 10 November. The SLA on the KPI flags the host as soon as no Node Manager runs, so an alert can tell you on the morning of the patch.
Aggregate Analysis of WebLogic Node Manager Count After Host Patching - GermainUX
Investigate a Server Restart
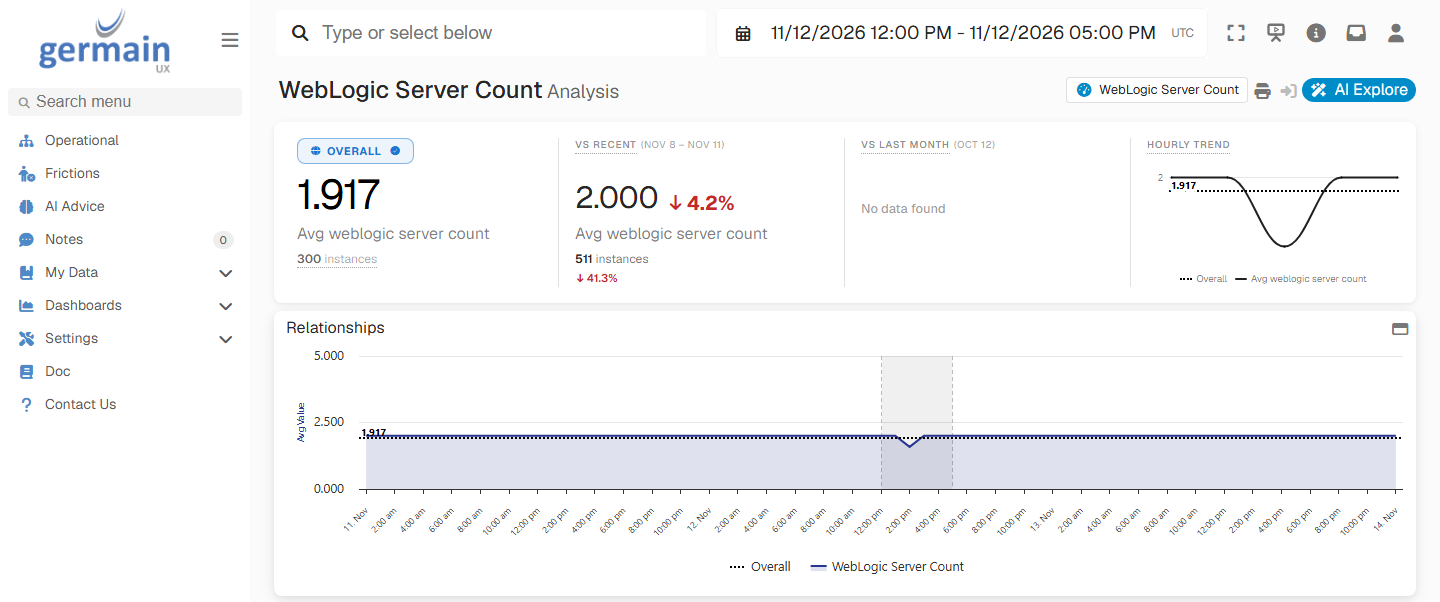
When bi_server1 crashes and the Node Manager restarts it, the WebLogic Server Count of the host drops for a few minutes. Open the KPI in the Analysis screen to see when it dropped and for how long.In the example below, bi_server1 on bip-01 ran out of heap at 15:20. Before it stopped, WebLogic logged low-memory warnings (BEA-310003) in the BIP Server Event KPI, and BI Publisher logged java.lang.OutOfMemoryError: Java heap space in BIP Diagnostic Event. The server count fell from 2 to 1 until the Node Manager restarted the server 25 minutes later. Over the five hours shown, the average count is 1.917, down 4.2% on the 2.000 of the previous days, and the hourly trend dips in the afternoon. The count never reaches 0, so the SLA on the KPI isn’t breached. Open the event KPIs for the same period to see why the server stopped.
Aggregate Analysis of WebLogic Server Count During a Restart - GermainUX
Investigate Reporting Database Errors
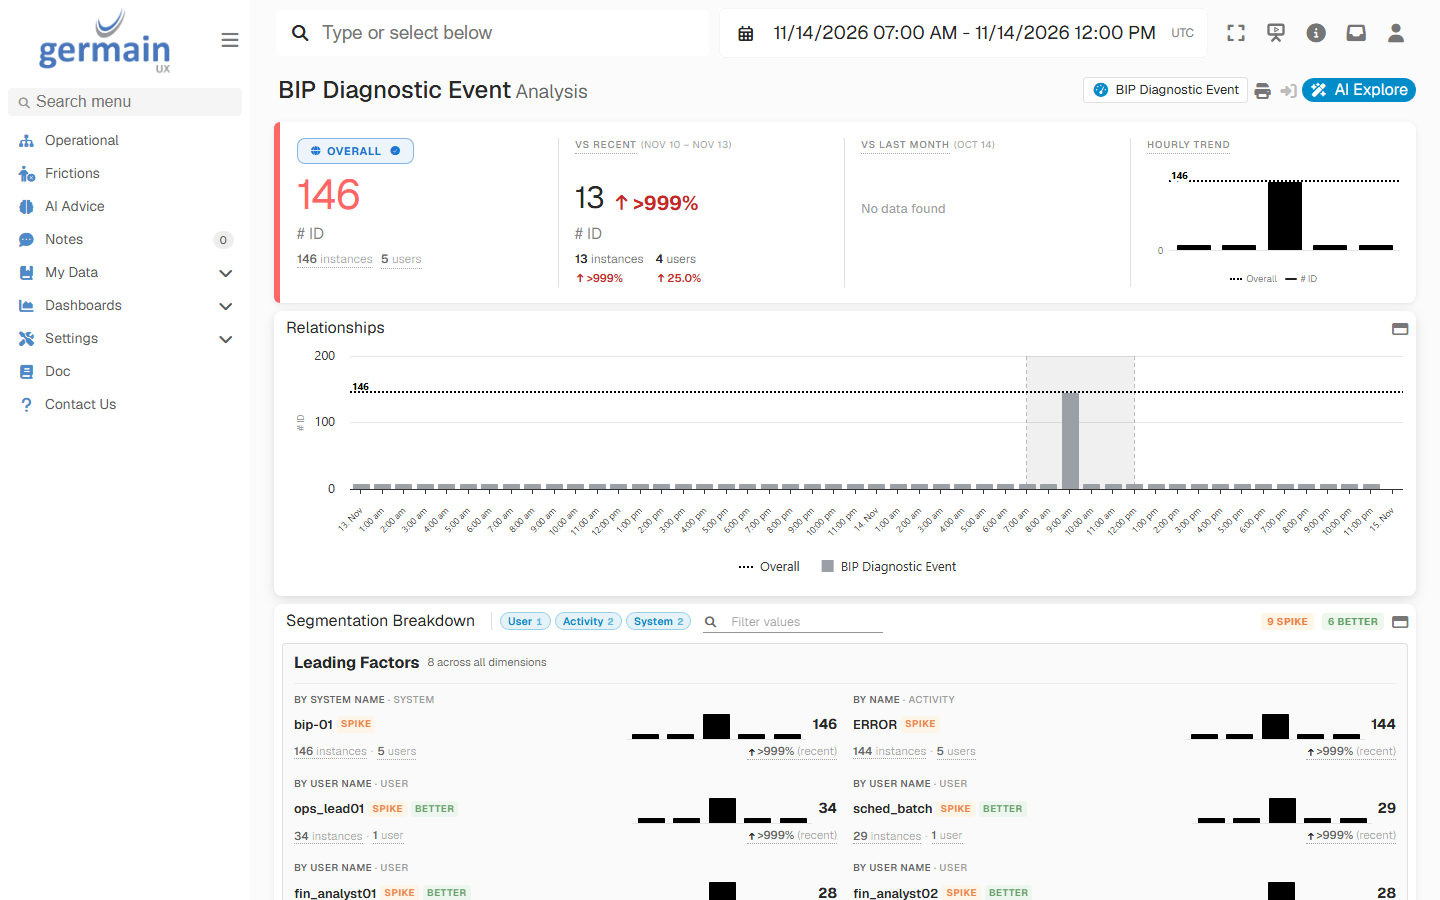
When the reporting database can’t be reached, every report that reads it fails. Open the BIP Diagnostic Event KPI in the Analysis screen. The top row shows how far the errors rose above the previous days. The segmentation breakdown shows whether they come from one user or from all of them.In the example below, the reporting database rpt-db-01 was unreachable for 45 minutes. The data engine logged a connection error for data source RPT_DB for every report that ran, and WebLogic logged BEA-001129 for the RPT_DB connection pool in the BIP Server Event KPI. The analysis shows 146 diagnostic events against 13 at the same hours on the previous days. The breakdown marks the host bip-01 and the ERROR message type as a spike, and spreads the errors over the users ops_lead01, sched_batch, fin_analyst01 and fin_analyst02. Errors from every user point to a shared cause, such as the database, rather than one report. The errors stop when the database is back.
Aggregate Analysis of BIP Diagnostic Events During a Database Outage - GermainUX
Investigate Failed Report Delivery
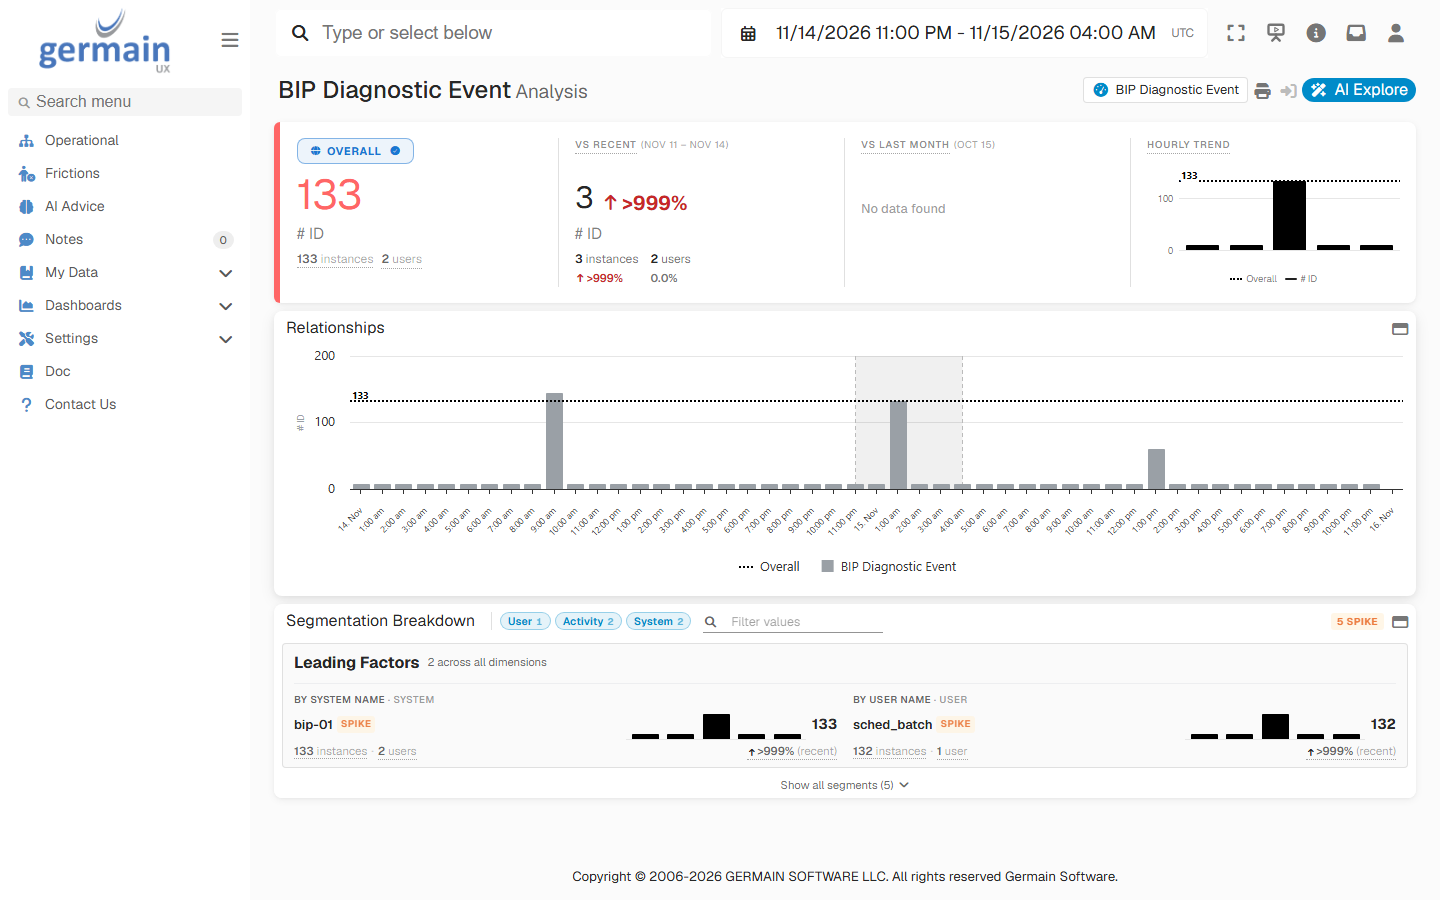
A bursting job that can’t send its email logs a delivery error for each report it tries to send. Open the BIP Diagnostic Event KPI in the Analysis screen for the time the job ran. The segmentation breakdown shows the user the job runs as.In the example below, the nightly bursting job couldn’t reach the SMTP server smtp.example.com for 40 minutes after 02:00. Each delivery failed with Could not connect to SMTP host: smtp.example.com, port: 25. The analysis shows 133 events against 3 at the same hours on the previous days, and the breakdown marks the host bip-01 and the user sched_batch as a spike. The SLA on the KPI flags each delivery error, so an alert can tell you before the report recipients notice that nothing arrived.
Aggregate Analysis of Failed Report Delivery - GermainUX
SLAs and Alerts
The event KPIs ship with an SLA that flags every new event. The server-count KPIs ship with an SLA that flags a host where no WebLogic server or no Node Manager runs. Get an alert by email, SMS, Slack or Teams when one is breached, and adjust the SLAs to the events you care about.
BIP logs and processesEngine on the BIP hostKPIsAlerts
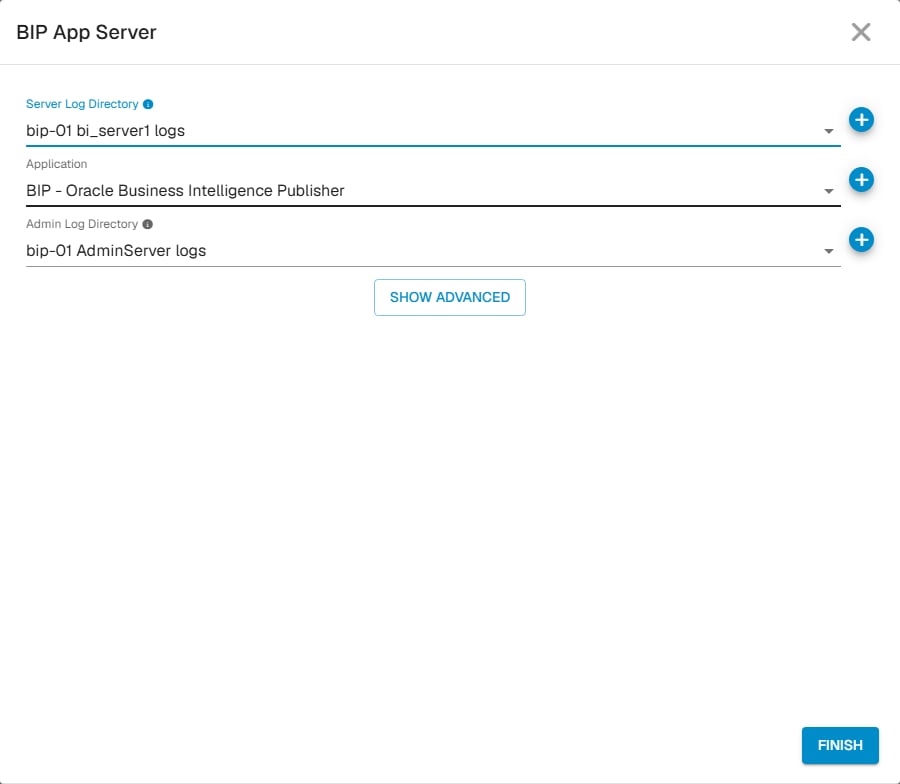
The BIP App Server wizard applies a server profile to the BI Publisher host. The profile deploys these components to the GermainUX Engine on that host:
Component
What it does
BIP Admin Log Directory Monitor
Watches the AdminServer log directory and sends new lines of AdminServer.log and AdminServer-diagnostic.log to the parsers
BIP Log Directory Monitor
Watches the managed server log directory and sends new lines of bipublisher.log, bi_server1.log and bi_server1-diagnostic.log to the parsers
BIP Diagnostic Parser
Reads the diagnostic logs and stores each error and warning as a BIP Diagnostic Event
BIP Server Parser
Reads the WebLogic server logs and stores each warning and error as a BIP Server Event
BIP Monitor Local
Counts the running WebLogic server and Node Manager processes on the host every minute
The Engine’s account can read the AdminServer log directory and the bi_server1 log directory, for example <DOMAIN_HOME>/servers/AdminServer/logs and <DOMAIN_HOME>/servers/bi_server1/logs.
The BI Publisher managed server is named bi_server1, as in a default installation. The log monitor picks up its log files by that name.
In the left menu, go to Settings > Wizards. On the BIP App Server card, click Add.
2
Select the BI Publisher host
In Servers, select the BI Publisher host, and then click Apply.
3
Enter the log directories
Fill in the fields, and then finish:
Field
Value
Admin Log Directory
The AdminServer log directory, for example <DOMAIN_HOME>/servers/AdminServer/logs. Select it, or create it.
Server Log Directory
The bi_server1 log directory, for example <DOMAIN_HOME>/servers/bi_server1/logs
Application
The application the data belongs to. The default is BIP - Oracle Business Intelligence Publisher.
BIP App Server Profile Fields - GermainUX
GermainUX deploys the components to the Engine on the host and starts reading the logs. Repeat the wizard for each BI Publisher host.
Validate
1
Check the server counts
In GermainUX Workspace, open the WebLogic Server Count KPI. Within two minutes, the BI Publisher host shows the number of WebLogic servers running on it, for example 2 for the AdminServer and bi_server1.
2
Check the events
Open the BIP Diagnostic Event and BIP Server Event KPIs. They show the errors and warnings that the logs receive after deployment. If the servers write none, run a report with a parameter you know fails, and look for its error.
Troubleshooting
No BI Publisher events appear
Check that the Engine runs on the BI Publisher host, that its account can read both log directories, and that the managed server’s logs are named bi_server1.log and bi_server1-diagnostic.log. Log files of a managed server with another name aren’t picked up.
WebLogic Server Count shows 0
No WebLogic server process runs on the host, or the Engine runs on another host. Start the servers, or deploy the profile to the Engine on the BI Publisher host.
Only some log messages appear
The parsers keep errors and warnings only. Informational and notification messages aren’t stored.
Security and Privacy
Oracle BI Publisher monitoring data includes personal data:
Identity data: the BI Publisher user ID of the request that logged the event
Free text: the log message in each event, which can contain report names, parameters, email addresses and host names. Treat it as possibly containing personal or customer data.
To mask, anonymize or exclude this data, see Data Privacy.
KPIs
KPI
What it holds
Default SLA
BIP Diagnostic Event
One event per error or warning in the diagnostic logs
Flags every event
BIP Server Event
One event per warning or error in the WebLogic server logs
Flags every event
WebLogic Server Count
The number of WebLogic server processes running on the host
OK when greater than 0, per host
WebLogic Node Manager Count
The number of Node Manager processes running on the host
OK when greater than 0, per host
The event KPIs are data model GenericEvent, and the count KPIs GenericMetric. The count KPIs are shared with OBIEE. See KPIs and SLAs.
Related Documentation
Oracle WebLogic
The servers BI Publisher runs on
File and Log Monitoring
How GermainUX reads log files
Automation
More Automation Features
Get Help
The GermainUX team can help you monitor BI Publisher installations with other managed server names or log locations.
Contact GermainUX Support
The GermainUX team helps you get up and running faster, empower your team, turn data into actionable insights, and optimize performance to deliver measurable business outcomes.
Can't Find What You Need?
Search all GermainUX docs with Ctrl + K, or use the feedback buttons at the bottom of this page to tell us what is missing.
The content of this document is proprietary to GERMAIN SOFTWARE.
Was this page helpful?
{"docsConfig":{"theme":"mint","$schema":"https://mintlify.com/docs.json","name":"GermainUX Docs","description":"GermainUX is a real-time Operational Experience Intelligence platform that combines Monitoring + Analytics + AI + Automation to help organizations detect and resolve user, workflow, and technology issues faster, in order to 1)Improve CRM and ERP Adoption and Productivity 2)Increase eCommerce Conversion","colors":{"primary":"#2E7DF2","light":"#5B9CFF","dark":"#1A5FC8"},"logo":{"light":"https://mintcdn.com/germain-ux/ok7-BbqwVV0uk3t8/images/logo-light.png?fit=max\u0026auto=format\u0026n=ok7-BbqwVV0uk3t8\u0026q=85\u0026s=3cfe3238ac55802e43da3e4da5806f0d","dark":"https://mintcdn.com/germain-ux/ok7-BbqwVV0uk3t8/images/logo-dark.png?fit=max\u0026auto=format\u0026n=ok7-BbqwVV0uk3t8\u0026q=85\u0026s=1886121bf4312c96b6321ea733078b7f","href":"/"},"favicon":"https://mintcdn.com/germain-ux/Jw6D65yKWJ4U5yOS/images/favicon.png?fit=max\u0026auto=format\u0026n=Jw6D65yKWJ4U5yOS\u0026q=85\u0026s=bcc4dd08f0edb299e0b2af2f079f8526","appearance":{"default":"light"},"background":{"color":{"light":"#FFFFFF","dark":"#00112A"}},"navbar":{"links":[{"href":"https://germainux.atlassian.net/servicedesk/customer/portal/1","label":"Ticket"},{"href":"https://calendly.com/germainux","label":"Schedule"}],"primary":{"type":"button","label":"Contact GermainUX","href":"https://docs.germainux.com/getting-started/support"}},"footer":{"socials":{"website":"https://germainux.com"}},"seo":{"metatags":{"canonical":"https://docs.germainux.com","og:locale":"en_US","og:site_name":"GermainUX Docs","twitter:card":"summary_large_image"},"indexing":"navigable"},"styling":{"eyebrows":"section","latex":true},"integrations":{"gtm":{"tagId":"GTM-MRCBSV5R"}},"contextual":{"options":["view","chatgpt","claude"],"display":"header"},"navigation":{"pages":[]}},"deployment":{"deploymentMetadataValue":{"subdomain":"germain-ux","hasAudioNarration":false,"actualSubdomain":"germain-ux","customDomains":["docs.germainux.com"],"gitSource":{"type":"github","owner":"germainsoftware","repo":"germain-docs","deployBranch":"main","contentDirectory":"","isPrivate":true,"mountPath":"","label":"","_id":"6ae890c6c73aaa2ebb8f7a7f"},"feedback":{"contextualFeedback":{"allowEmail":true,"textInputOnly":false},"edits":false,"issues":false,"thumbs":true},"entitlements":{"AI_CHAT":{"status":"ENABLED"},"WEB_MCP":{"status":"ENABLED"},"NARRATION":{"status":"ENABLED"}},"buildId":"6afce1af74df63670e0e687f","clientVersion":"0.0.4177","searchFilterCounts":[{"language":"default","tag":"Documentation","count":511},{"language":"default","tag":"GermainUX Documentation","count":511},{"language":"default","tag":"Integrations","count":274},{"language":"default","tag":"Release Notes","count":81},{"language":"default","tag":"Archive","count":73},{"language":"default","tag":"Management","count":57},{"language":"default","tag":"Analytics","count":53},{"language":"default","tag":"Deploy GermainUX","count":53},{"language":"default","tag":"Action","count":48},{"language":"default","tag":"Success Stories","count":34}],"searchSettings":{"fullPageSearch":true,"showContentSnippets":true}},"assistantConfig":{"enableAskAiButton":false,"enableStarterQuestions":false,"enableContextualStarterQuestions":false,"enableAskAiSearchBar":true},"basePath":"","hasChatPermissions":true,"hasWebMcpPermissions":true,"toggles":[{"name":"kill-isr","enabled":true,"variant":{"name":"disabled","enabled":false,"feature_enabled":true},"impressionData":false},{"name":"custom-rbac-roles","enabled":true,"variant":{"name":"disabled","enabled":false,"feature_enabled":true},"impressionData":false},{"name":"agent-mintlify-slack","enabled":true,"variant":{"name":"disabled","enabled":false,"feature_enabled":true},"impressionData":false},{"name":"agent-integrations-settings","enabled":true,"variant":{"name":"disabled","enabled":false,"feature_enabled":true},"impressionData":false},{"name":"rbac-expansion","enabled":true,"variant":{"name":"disabled","enabled":false,"feature_enabled":true},"impressionData":false},{"name":"automations-pr-grouping","enabled":true,"variant":{"name":"disabled","enabled":false,"feature_enabled":true},"impressionData":false},{"name":"custom-prefix","enabled":true,"variant":{"name":"disabled","enabled":false,"feature_enabled":true},"impressionData":false},{"name":"analytics-v7","enabled":true,"variant":{"name":"disabled","enabled":false,"feature_enabled":true},"impressionData":false},{"name":"user-flows-analytics","enabled":true,"variant":{"name":"disabled","enabled":false,"feature_enabled":true},"impressionData":false},{"name":"no-publish-flow","enabled":true,"variant":{"name":"disabled","enabled":false,"feature_enabled":true},"impressionData":false},{"name":"workos-onboarding","enabled":true,"variant":{"name":"disabled","enabled":false,"feature_enabled":true},"impressionData":false},{"name":"snapshot-serving-live","enabled":true,"variant":{"name":"disabled","enabled":false,"feature_enabled":true},"impressionData":false},{"name":"stripTemperatureMiddleware","enabled":true,"variant":{"name":"disabled","enabled":false,"feature_enabled":true},"impressionData":false},{"name":"support-platform-pylon-zendesk","enabled":true,"variant":{"name":"disabled","enabled":false,"feature_enabled":true},"impressionData":false},{"name":"snapshot-serving","enabled":true,"variant":{"name":"disabled","enabled":false,"feature_enabled":true},"impressionData":false},{"name":"instant-rollback","enabled":true,"variant":{"name":"disabled","enabled":false,"feature_enabled":true},"impressionData":false},{"name":"granular-notifications-server","enabled":true,"variant":{"name":"disabled","enabled":false,"feature_enabled":true},"impressionData":false},{"name":"granular-notifications","enabled":true,"variant":{"name":"disabled","enabled":false,"feature_enabled":true},"impressionData":false},{"name":"automations-fable","enabled":true,"variant":{"name":"disabled","enabled":false,"feature_enabled":true},"impressionData":false},{"name":"fixed-ai-action-pricing","enabled":true,"variant":{"name":"disabled","enabled":false,"feature_enabled":true},"impressionData":false},{"name":"automation-resolve-merge-conflict","enabled":true,"variant":{"name":"disabled","enabled":false,"feature_enabled":true},"impressionData":false},{"name":"scoped-publishing","enabled":true,"variant":{"name":"disabled","enabled":false,"feature_enabled":true},"impressionData":false},{"name":"mintql","enabled":true,"variant":{"name":"disabled","enabled":false,"feature_enabled":true},"impressionData":false},{"name":"page-level-analytics","enabled":true,"variant":{"name":"disabled","enabled":false,"feature_enabled":true},"impressionData":false},{"name":"editor-version-history-v2","enabled":true,"variant":{"name":"disabled","enabled":false,"feature_enabled":true},"impressionData":false},{"name":"billing-page-v2","enabled":true,"variant":{"name":"disabled","enabled":false,"feature_enabled":true},"impressionData":false},{"name":"full-page-search","enabled":true,"variant":{"name":"disabled","enabled":false,"feature_enabled":true},"impressionData":false},{"name":"workspace-projects","enabled":true,"variant":{"name":"disabled","enabled":false,"feature_enabled":true},"impressionData":false},{"name":"assistant-v5","enabled":true,"variant":{"name":"disabled","enabled":false,"feature_enabled":true},"impressionData":false},{"name":"fork-pr-previews","enabled":true,"variant":{"name":"disabled","enabled":false,"feature_enabled":true},"impressionData":false},{"name":"revalidation-jwt","enabled":true,"variant":{"name":"disabled","enabled":false,"feature_enabled":true},"impressionData":false},{"name":"workos-sso-scim","enabled":true,"variant":{"name":"disabled","enabled":false,"feature_enabled":true},"impressionData":false},{"name":"hobby-abuse-scan","enabled":true,"variant":{"name":"disabled","enabled":false,"feature_enabled":true},"impressionData":false},{"name":"dashboard-inbox","enabled":true,"variant":{"name":"disabled","enabled":false,"feature_enabled":true},"impressionData":false},{"name":"workos-signup","enabled":true,"variant":{"name":"disabled","enabled":false,"feature_enabled":true},"impressionData":false},{"name":"turbopuffer-dual-write","enabled":true,"variant":{"name":"disabled","enabled":false,"feature_enabled":true},"impressionData":false},{"name":"workos-enabled","enabled":true,"variant":{"name":"disabled","enabled":false,"feature_enabled":true},"impressionData":false},{"name":"approve-review-flow","enabled":true,"variant":{"name":"disabled","enabled":false,"feature_enabled":true},"impressionData":false},{"name":"editor-metadata","enabled":true,"variant":{"name":"disabled","enabled":false,"feature_enabled":true},"impressionData":false},{"name":"sso-setup-deadline-banner","enabled":true,"variant":{"name":"disabled","enabled":false,"feature_enabled":true},"impressionData":false},{"name":"turbopuffer-serve","enabled":true,"variant":{"name":"disabled","enabled":false,"feature_enabled":true},"impressionData":false},{"name":"live-agents","enabled":true,"variant":{"name":"disabled","enabled":false,"feature_enabled":true},"impressionData":false},{"name":"starter-pricing","enabled":true,"variant":{"name":"treatment","enabled":true,"payload":{"type":"string","value":"treatment"},"feature_enabled":true},"impressionData":false},{"name":"llms-txt-v2","enabled":true,"variant":{"name":"disabled","enabled":false,"feature_enabled":true},"impressionData":false},{"name":"wildcard-email-auth","enabled":true,"variant":{"name":"disabled","enabled":false,"feature_enabled":true},"impressionData":false}],"googleFontsInlined":false},"customCss":[],"page":{"pagePath":"integrations/oracle-bi-publisher-monitoring","slug":"/integrations/oracle-bi-publisher-monitoring","pageMetadata":{"title":"Oracle BI Publisher Monitoring","sidebarTitle":"Oracle BI Publisher Observability","description":"Know when BI Publisher reports fail, a server stops or threads get stuck, from the WebLogic and diagnostic logs of every BI Publisher host.","icon":"plug","keywords":["Oracle BI Publisher","BI Publisher","BIP","bi_server1","xmlpserver"],"href":"/integrations/oracle-bi-publisher-monitoring"},"description":{"compiledSource":"\"use strict\";\nconst {jsx: _jsx} = arguments[0];\nconst {useMDXComponents: _provideComponents} = arguments[0];\nfunction _createMdxContent(props) {\n const _components = {\n p: \"p\",\n ..._provideComponents(),\n ...props.components\n };\n return _jsx(_components.p, {\n children: \"Know when BI Publisher reports fail, a server stops or threads get stuck, from the WebLogic and diagnostic logs of every BI Publisher host.\"\n });\n}\nfunction MDXContent(props = {}) {\n const {wrapper: MDXLayout} = {\n ..._provideComponents(),\n ...props.components\n };\n return MDXLayout ? _jsx(MDXLayout, {\n ...props,\n children: _jsx(_createMdxContent, {\n ...props\n })\n }) : _createMdxContent(props);\n}\nreturn {\n default: MDXContent\n};\n","frontmatter":{},"scope":{}},"pageType":"default","mdx":{"mdxSource":{"compiledSource":"\"use strict\";const{Fragment:_Fragment,jsx:_jsx,jsxs:_jsxs}=arguments[0];const{useMDXComponents:_provideComponents}=arguments[0];const GxFooter=()=>_jsx(`p`,{className:`gx-fine`,children:`The content of this document is proprietary to GERMAIN SOFTWARE.`});const GxStyle=()=>_jsx(`style`,{children:`\n.gx-meta { display:flex; flex-direction:column; gap:10px; margin:22px 0 6px; padding:16px 18px; border:1px solid rgba(15,23,42,.08); border-radius:16px; background:rgba(46,125,242,.035); font-size:13.5px; }\n.gx-meta-row { display:flex; flex-wrap:wrap; align-items:center; gap:6px; }\n.gx-meta-label { width:96px; flex:none; color:#64748b; }\n.dark .gx-meta-label { color:#94a3b8; }\n.gx-meta code { border-color:rgba(46,125,242,.25) !important; color:#1A5FC8 !important; background:rgba(46,125,242,.08) !important; }\n.dark .gx-meta { background:linear-gradient(135deg,rgba(46,125,242,.16),rgba(0,17,42,.4)); border-color:rgba(91,156,255,.22); }\n.dark .gx-meta code { color:#BFD6FF !important; background:rgba(91,156,255,.12) !important; border-color:rgba(91,156,255,.28) !important; }\n.gx-list ul { columns:2; column-gap:24px; list-style:none !important; padding-left:0 !important; margin:14px 0 0 !important; }\n.gx-list ul:has(> li:only-child) { columns:1; }\n.gx-list li { break-inside:avoid; position:relative; padding:4px 0 4px 22px !important; margin:0 !important; font-size:14.5px; }\n.gx-list li::marker { content:\"\"; }\n.gx-list li::before { content:\"\"; position:absolute; left:3px; top:13px; width:7px; height:7px; border-radius:50%; background:#2E7DF2; opacity:.75; }\n.dark .gx-list li::before { background:#5B9CFF; }\n.gx-flow { display:flex; flex-wrap:wrap; align-items:center; gap:10px 32px; margin:16px 0; }\n.gx-flow span { position:relative; display:inline-flex; align-items:center; padding:6px 12px; border-radius:8px; font-size:13.5px; font-weight:500; background:#fff; border:1px solid rgba(15,23,42,.12); color:#0f172a; box-shadow:0 1px 2px rgba(15,23,42,.05); }\n.gx-flow span:first-child, .gx-flow span:last-child { background:rgba(46,125,242,.08); border-color:rgba(46,125,242,.25); color:#1A5FC8; }\n.gx-flow span:not(:last-child)::after { content:\"\\\\2192\"; position:absolute; left:calc(100% + 9px); color:#94a3b8; font-weight:400; }\n.dark .gx-flow span { background:rgba(255,255,255,.03); border-color:rgba(255,255,255,.12); color:#e2e8f0; box-shadow:none; }\n.dark .gx-flow span:first-child, .dark .gx-flow span:last-child { background:rgba(91,156,255,.10); border-color:rgba(91,156,255,.28); color:#BFD6FF; }\n.dark .gx-flow span:not(:last-child)::after { color:#64748b; }\n#sidebar li[id] > a > div:first-child:has(> svg[aria-hidden]) { display: none; }\n#sidebar svg[style*=\"mask-image\"], #sidebar-content svg[style*=\"mask-image\"], #navigation-items svg[style*=\"mask-image\"], aside svg[style*=\"mask-image\"] { display: none !important; }\n#sidebar div:has(> svg[style*=\"mask-image\"]), #sidebar-content div:has(> svg[style*=\"mask-image\"]), #navigation-items div:has(> svg[style*=\"mask-image\"]), aside div:has(> svg[style*=\"mask-image\"]) { display: none !important; }\n.gx-fine { margin-top:56px; padding-top:20px; border-top:1px solid rgba(15,23,42,.08); font-size:13px; color:#64748b; }\n.dark .gx-fine { border-top-color:rgba(255,255,255,.08); color:#94a3b8; }\n.gx-fine p { margin:0 !important; font-size:13px !important; color:inherit !important; }\n.eyebrow { font-size:13px !important; font-weight:700 !important; letter-spacing:.12em !important; text-transform:uppercase; color:#2E7DF2 !important; display:inline-flex; align-items:center; gap:8px; padding:4px 12px; border-radius:999px; background:rgba(46,125,242,.10); border:1px solid rgba(46,125,242,.25); height:auto !important; margin-bottom:6px; }\n.dark .eyebrow { color:#8DB8FF !important; background:rgba(91,156,255,.12); border-color:rgba(91,156,255,.30); }\n#page-title { letter-spacing:-.02em; }\n.dark #page-title { background:linear-gradient(90deg,#FFFFFF 0%,#BFD6FF 100%); -webkit-background-clip:text; background-clip:text; -webkit-text-fill-color:transparent; }\n.mdx-content h2:not(.not-prose) { position:relative; padding-left:16px; }\n.mdx-content h2:not(.not-prose)::before { content:\"\"; position:absolute; left:0; top:.2em; bottom:.2em; width:4px; border-radius:4px; background:linear-gradient(180deg,#2E7DF2,#5B9CFF); }\n.dark table th { color:#BFD6FF; }\n.dark table td:first-child { color:#FFFFFF; font-weight:500; }\n@media (max-width: 820px) { .gx-list ul { columns:1; } }\n.gx-list-more:not(.is-open) > ul > li:nth-child(n+11) { display:none; }\n.gx-more-toggle { display:inline-flex; align-items:center; gap:6px; margin:8px 0 12px 22px; padding:0; border:0; background:none; cursor:pointer; font-size:14px; font-weight:600; color:#1A5FC8; }\n.gx-more-toggle:hover { text-decoration:underline; }\n.gx-more-toggle::after { content:\"\\\\25BE\"; display:inline-block; font-size:12px; transition:transform .15s; }\n.gx-list-more.is-open .gx-more-toggle::after { transform:rotate(180deg); }\n.dark .gx-more-toggle { color:#8DB8FF; }\n/* === Concept #1: hero header + numbered section tiles === */\n#content-area { counter-reset: gxsec; }\n#header { position:relative; overflow:hidden; padding:36px 30px 24px; border-radius:24px; border:1px solid rgba(91,156,255,.22); background:radial-gradient(800px 300px at 100% 0%, rgba(46,125,242,.32), transparent 65%), #0B2147; }\n#header::before { content:\"\"; position:absolute; inset:0; pointer-events:none; background-image:linear-gradient(rgba(255,255,255,.045) 1px,transparent 1px),linear-gradient(90deg,rgba(255,255,255,.045) 1px,transparent 1px); background-size:34px 34px; -webkit-mask-image:linear-gradient(100deg,transparent 15%,#000 75%); mask-image:linear-gradient(100deg,transparent 15%,#000 75%); }\n#header > * { position:relative; }\n#header #page-title { color:#fff !important; -webkit-text-fill-color:#fff !important; background:none !important; font-size:clamp(1.9rem,3.4vw,2.6rem) !important; line-height:1.06 !important; font-weight:800 !important; letter-spacing:-.035em !important; }\n#header .prose, #header .prose p, #header p { color:rgba(222,233,255,.82) !important; font-size:1.06rem; line-height:1.6; }\n#header .eyebrow { color:#BFD6FF !important; background:rgba(91,156,255,.14) !important; border-color:rgba(91,156,255,.32) !important; }\n#header button, #header [role=\"button\"] { color:#DCE8FF !important; border-color:rgba(191,214,255,.25) !important; background:rgba(255,255,255,.04) !important; }\n#content-area:has(#content > .gx-meta:first-child) #header { border-radius:24px 24px 0 0; border-bottom:0; padding-bottom:18px; }\n#content:has(> .gx-meta:first-child) { margin-top:0 !important; }\n#content > .gx-meta:first-child { margin:0 !important; padding:4px 30px 28px !important; border-radius:0 0 24px 24px !important; border:1px solid rgba(91,156,255,.22) !important; border-top:0 !important; background:#0B2147 !important; }\n#content > .gx-meta:first-child:has(+ .columns) { border-radius:0 !important; border-bottom:0 !important; padding-bottom:18px !important; }\n#content > .gx-meta:first-child + .columns { margin:0 0 8px !important; padding:4px 30px 30px !important; border:1px solid rgba(91,156,255,.22); border-top:0; border-radius:0 0 24px 24px; background:#0B2147; gap:12px !important; }\n#content > .gx-meta:first-child + .columns > * { background:rgba(255,255,255,.035) !important; border-color:rgba(91,156,255,.28) !important; border-radius:16px !important; }\n#content > .gx-meta:first-child + .columns h2, #content > .gx-meta:first-child + .columns [data-component-part=\"card-title\"] { color:#fff !important; font-size:15px !important; overflow-wrap:normal !important; word-break:normal !important; }\n#content > .gx-meta:first-child + .columns p, #content > .gx-meta:first-child + .columns [data-component-part=\"card-content\"] { color:rgba(214,226,250,.7) !important; }\n#content > .gx-meta:first-child + .columns svg { background-color:#5B9CFF !important; }\n#content > .gx-meta:first-child .gx-meta-label { color:rgba(191,214,255,.6) !important; }\n#content > .gx-meta:first-child code { font-family:inherit !important; font-weight:600 !important; font-size:12.5px !important; padding:5px 13px !important; border-radius:999px !important; color:#DCE8FF !important; background:rgba(46,125,242,.14) !important; border:1px solid rgba(91,156,255,.55) !important; }\n#content > .gx-meta:first-child a { text-decoration:none !important; border:0 !important; }\n#content > .gx-meta:first-child a:not(:has(code)) { color:#BFD6FF !important; font-weight:600; }\n#content > .gx-meta:first-child .gx-meta-row > span:not(.gx-meta-label) { color:#86EFAC !important; background:rgba(34,197,94,.14) !important; border-color:rgba(134,239,172,.35) !important; }\n.mdx-content > h2:not(.not-prose), #content > h2 { counter-increment:gxsec; display:flex !important; align-items:center; gap:14px; padding-left:0 !important; margin-top:2.6em !important; font-weight:750; letter-spacing:-.02em; }\n.mdx-content > h2:not(.not-prose)::before, #content > h2::before { content:counter(gxsec, decimal-leading-zero) !important; position:static !important; flex:none; width:40px; height:40px; border-radius:12px; display:inline-flex; align-items:center; justify-content:center; font-size:13px; font-weight:700; letter-spacing:0; color:#fff; background:linear-gradient(135deg,#2E7DF2,#5B9CFF) !important; box-shadow:0 6px 18px rgba(46,125,242,.35); }\n@media (max-width:820px) { #header, #content > .gx-meta:first-child, #content > .gx-meta:first-child + .columns { padding-left:20px !important; padding-right:20px !important; } }\n#content-area:has(#content > .columns:first-child) #header { border-radius:24px 24px 0 0; border-bottom:0; padding-bottom:18px; }\n#content:has(> .columns:first-child) { margin-top:0 !important; }\n#content > .columns:first-child { margin:0 0 8px !important; padding:4px 30px 30px !important; border:1px solid rgba(91,156,255,.22); border-top:0; border-radius:0 0 24px 24px; background:#0B2147; gap:12px !important; }\n#content > .columns:first-child > * { background:rgba(255,255,255,.035) !important; border-color:rgba(91,156,255,.28) !important; border-radius:16px !important; }\n#content > .columns:first-child h2, #content > .columns:first-child [data-component-part=\"card-title\"] { color:#fff !important; font-size:15px !important; overflow-wrap:normal !important; word-break:normal !important; }\n#content > .columns:first-child p, #content > .columns:first-child [data-component-part=\"card-content\"] { color:rgba(214,226,250,.7) !important; }\n#content > .columns:first-child svg { background-color:#5B9CFF !important; }\n/* === Shell: concept #1 (top bar, menus, page) === */\n#navbar, #navbar-transition, #navbar > div { background:#00112A !important; }\n#navbar { border-bottom:1px solid rgba(91,156,255,.18) !important; }\n#navbar a, #navbar button, #navbar .nav-tabs-item { color:rgba(220,232,255,.78) !important; }\n#navbar a:hover, #navbar button:hover, #navbar .nav-tabs-item[data-active=\"true\"] { color:#FFFFFF !important; }\n#navbar a[class*=\"bg-primary\"], #navbar a[class*=\"bg-primary\"] * { color:#FFFFFF !important; }\n#navbar a[href=\"/\"], #navbar a[href=\"/\"] * { color:#FFFFFF !important; }\n#search-bar-entry { background:rgba(255,255,255,.06) !important; border:1px solid rgba(255,255,255,.14) !important; box-shadow:none !important; }\n#search-bar-entry, #search-bar-entry * { color:rgba(220,232,255,.72) !important; }\nhtml:not(.dark) #navbar img[src*=\"logo-light\"] { display:none !important; }\nhtml:not(.dark) #navbar img[src*=\"logo-dark\"] { display:block !important; }\nhtml:not(.dark) #sidebar, html:not(.dark) #sidebar-content { background:#FFFFFF !important; }\nhtml:not(.dark) #sidebar { border-right:1px solid #E6ECF5 !important; }\n#navigation-items .sidebar-group-header { font-size:11.5px !important; letter-spacing:.08em; text-transform:uppercase; }\nhtml:not(.dark) #navigation-items .sidebar-group-header { color:#0B1B33 !important; }\n#navigation-items a { font-size:13.5px !important; border-radius:10px !important; }\nhtml:not(.dark) #navigation-items a { color:#4A5A75 !important; }\nhtml:not(.dark) #navigation-items a:hover { background:#F1F5FC !important; color:#0B1B33 !important; }\n#navigation-items li[data-active] > a, #navigation-items a[aria-current=\"page\"], #navigation-items a[class*=\"bg-primary\"] { background:#EAF2FF !important; color:#1A5FC8 !important; font-weight:600 !important; box-shadow:inset 3px 0 0 #2E7DF2; }\n.dark #navigation-items li[data-active] > a, .dark #navigation-items a[aria-current=\"page\"], .dark #navigation-items a[class*=\"bg-primary\"] { background:rgba(46,125,242,.16) !important; color:#BFD6FF !important; }\nhtml:not(.dark) #table-of-contents a { color:#5B6B85; }\nhtml:not(.dark) .mdx-content h2, html:not(.dark) .mdx-content h3 { color:#0B1B33; }\nhtml:not(.dark) .mdx-content p, html:not(.dark) .mdx-content li { color:#33415C; }\n`});function _createMdxContent(props){const _components={a:`a`,code:`code`,li:`li`,p:`p`,strong:`strong`,tbody:`tbody`,td:`td`,th:`th`,thead:`thead`,tr:`tr`,ul:`ul`,..._provideComponents(),...props.components},{Accordion,AccordionGroup,Badge,Card,CardGroup,Frame,Heading,OptimizedImage,Step,Steps,Table,_MdxComponentBoundary}=_components;if(!Accordion)_missingMdxReference(`Accordion`,true);if(!AccordionGroup)_missingMdxReference(`AccordionGroup`,true);if(!Badge)_missingMdxReference(`Badge`,true);if(!Card)_missingMdxReference(`Card`,true);if(!CardGroup)_missingMdxReference(`CardGroup`,true);if(!Frame)_missingMdxReference(`Frame`,true);if(!Heading)_missingMdxReference(`Heading`,true);if(!OptimizedImage)_missingMdxReference(`OptimizedImage`,true);if(!Step)_missingMdxReference(`Step`,true);if(!Steps)_missingMdxReference(`Steps`,true);if(!Table)_missingMdxReference(`Table`,true);if(!_MdxComponentBoundary)_missingMdxReference(`_MdxComponentBoundary`,true);return _jsxs(_Fragment,{children:[_jsxs(`div`,{className:`gx-meta`,children:[_jsxs(`div`,{className:`gx-meta-row`,children:[_jsx(`span`,{className:`gx-meta-label`,children:`Components`}),_jsx(_components.a,{href:`/deploy/germain-ux-engine`,children:_jsx(`code`,{children:`Engine`})}),_jsx(_components.a,{href:`/deploy/germain-ux-js-profiler`,children:_jsx(`code`,{children:`JS Profiler`})}),_jsx(_components.a,{href:`/deploy/germain-ux-rpa-bot-recorder`,children:_jsx(`code`,{children:`RPA Bot Recorder`})}),_jsx(_components.a,{href:`/deploy/germain-ux-rum-js`,children:_jsx(`code`,{children:`RUM JS`})}),_jsx(_components.a,{href:`/deploy/germain-ux-rum-extension`,children:_jsx(`code`,{children:`RUM Extension`})})]}),_jsxs(`div`,{className:`gx-meta-row`,children:[_jsx(`span`,{className:`gx-meta-label`,children:`Availability`}),_jsx(Badge,{color:`green`,children:`8.6.9 or later`})]})]}),`\n`,_jsxs(CardGroup,{cols:4,children:[_jsx(Card,{title:`What Is Monitored`,icon:`binoculars`,href:`#what-is-monitored`,children:_jsx(_components.p,{children:`Errors, warnings, servers`})}),_jsx(Card,{title:`How It Works`,icon:`gears`,href:`#how-it-works`,children:_jsx(_components.p,{children:`Log parsers, process checks`})}),_jsx(Card,{title:`Deploy`,icon:`rocket`,href:`#deploy`,children:_jsx(_components.p,{children:`One wizard per host`})}),_jsx(Card,{title:`KPIs`,icon:`gauge`,href:`#kpis`,children:_jsx(_components.p,{children:`Events and server counts`})})]}),`\n`,_jsx(Heading,{level:`2`,id:`overview`,children:`Overview`}),`\n`,_jsxs(_components.p,{children:[`GermainUX reads the logs of your Oracle BI Publisher (BIP) servers and checks that they’re running. You see every error and warning the BI Publisher application and its WebLogic servers write, from failed reports and delivery errors to stuck threads, and how many WebLogic servers and Node Managers run on each host. An SLA tells you about each new error, so a broken data source or a bursting job that can’t send email is found before the report recipients notice. Your team stops searching `,_jsx(_components.code,{children:`bipublisher.log`}),` and the WebLogic logs host by host.`]}),`\n`,_jsxs(CardGroup,{cols:2,children:[_jsx(Card,{title:`Report and Delivery Errors`,icon:`file-circle-exclamation`,children:_jsx(_components.p,{children:`Errors and warnings from the BI Publisher diagnostic log, such as failed reports, data engine errors and delivery failures.`})}),_jsx(Card,{title:`WebLogic Server Events`,icon:`server`,children:_jsxs(_components.p,{children:[`Warnings and errors from the AdminServer and `,_jsx(_components.code,{children:`bi_server1`}),` logs, with their WebLogic message ID, such as `,_jsx(_components.code,{children:`BEA-000337`}),` for stuck threads.`]})}),_jsx(Card,{title:`Servers Running`,icon:`heart-pulse`,children:_jsx(_components.p,{children:`How many WebLogic servers and Node Managers run on each host, checked every minute.`})}),_jsx(Card,{title:`Every Host in One Place`,icon:`layer-group`,children:_jsx(_components.p,{children:`Compare errors across BI Publisher hosts, and see who ran the report that failed.`})})]}),`\n`,_jsx(Heading,{level:`3`,id:`questions-it-answers`,children:`Questions It Answers`}),`\n`,_jsx(`div`,{className:`gx-list`,children:_jsxs(_components.ul,{children:[`\n`,_jsx(_components.li,{children:`Which BI Publisher reports failed today, and with what error?`}),`\n`,_jsxs(_components.li,{children:[`Is `,_jsx(_components.code,{children:`bi_server1`}),` running on every host right now?`]}),`\n`,_jsx(_components.li,{children:`Did the Node Manager start after the host was patched?`}),`\n`,_jsxs(_components.li,{children:[`Why did `,_jsx(_components.code,{children:`bi_server1`}),` restart?`]}),`\n`,_jsx(_components.li,{children:`Are threads getting stuck on a BI Publisher server?`}),`\n`,_jsx(_components.li,{children:`Did a bursting job fail to deliver its reports by email?`}),`\n`,_jsx(_components.li,{children:`Which users ran into report errors this week?`}),`\n`]})}),`\n`,_jsx(Heading,{level:`2`,id:`what-is-monitored`,children:`What Is Monitored`}),`\n`,_jsxs(Table,{children:[_jsx(_components.thead,{children:_jsxs(_components.tr,{children:[_jsx(_components.th,{children:`Area`}),_jsx(_components.th,{children:`What GermainUX monitors`})]})}),_jsxs(_components.tbody,{children:[_jsxs(_components.tr,{children:[_jsx(_components.td,{children:_jsx(_components.strong,{children:`BI Publisher diagnostic events`})}),_jsxs(_components.td,{children:[`Each error and warning in the Oracle diagnostic logs: `,_jsx(_components.code,{children:`bipublisher.log`}),`, `,_jsx(_components.code,{children:`bi_server1-diagnostic.log`}),` and `,_jsx(_components.code,{children:`AdminServer-diagnostic.log`}),`, with its module, message and user`]})]}),_jsxs(_components.tr,{children:[_jsx(_components.td,{children:_jsx(_components.strong,{children:`WebLogic server events`})}),_jsxs(_components.td,{children:[`Each warning and error in the `,_jsx(_components.code,{children:`AdminServer.log`}),` and `,_jsx(_components.code,{children:`bi_server1.log`}),` server logs, with its subsystem, WebLogic message ID, server and user`]})]}),_jsxs(_components.tr,{children:[_jsx(_components.td,{children:_jsx(_components.strong,{children:`Servers running`})}),_jsx(_components.td,{children:`The number of running WebLogic server processes and Node Manager processes on the host`})]}),_jsxs(_components.tr,{children:[_jsx(_components.td,{children:_jsx(_components.strong,{children:`Availability`})}),_jsxs(_components.td,{children:[`Up/down status and response time of the BI Publisher URL, checked on a schedule with `,_jsx(_components.a,{href:`/automation/synthetic-http-execution`,children:`synthetic HTTP checks`})]})]}),_jsxs(_components.tr,{children:[_jsx(_components.td,{children:_jsx(_components.strong,{children:`Host`})}),_jsxs(_components.td,{children:[`CPU, memory, disk and network of the BI Publisher host. See `,_jsx(_components.a,{href:`/integrations/linux-redhat-suse-monitoring`,children:`Linux monitoring`}),` or `,_jsx(_components.a,{href:`/integrations/windows-monitoring`,children:`Windows monitoring`}),`.`]})]}),_jsxs(_components.tr,{children:[_jsx(_components.td,{children:_jsx(_components.strong,{children:`User experience`})}),_jsxs(_components.td,{children:[`Real-user page performance, JavaScript errors and Session Replay for the BI Publisher pages your users work in, with `,_jsx(_components.a,{href:`/deploy/germain-ux-rum-js`,children:`RUM JS`}),` or the `,_jsx(_components.a,{href:`/deploy/germain-ux-rum-extension`,children:`RUM Extension`})]})]})]})]}),`\n`,_jsx(Heading,{level:`2`,id:`analytics-alerts-and-automation`,children:`Analytics, Alerts and Automation`}),`\n`,_jsx(Heading,{level:`3`,id:`ai-analysis`,children:`AI Analysis`}),`\n`,_jsxs(_components.p,{children:[`Ask `,_jsx(_components.a,{href:`/analytics/ai-driven-insights`,children:`AI Explore`}),` questions such as “Which BI Publisher errors happened most this week?” and get the answer without building a report. `,_jsx(_components.a,{href:`/analytics/data-categorization`,children:`Error categorization`}),` groups similar messages, so a new error stands out from the known ones.`]}),`\n`,_jsx(Heading,{level:`3`,id:`dashboards-and-reports`,children:`Dashboards and Reports`}),`\n`,_jsxs(_components.p,{children:[`Build `,_jsx(_components.a,{href:`/dashboards/dashboard-and-report`,children:`dashboards and reports`}),` on the BI Publisher KPIs: events per host and module, the WebLogic message IDs that occur most, and the server counts over time.`]}),`\n`,_jsxs(_components.p,{children:[`Click a value to open it in the `,_jsx(_components.a,{href:`/dashboards/analytics-dashboard/4-analysis-dashboard`,children:`Analysis`}),` screen. In the example below, threads got stuck on `,_jsx(_components.code,{children:`bi_server1`}),`, and the WebLogic server events spiked with `,_jsx(_components.code,{children:`BEA-000337`}),` messages.`]}),`\n`,_jsx(Frame,{caption:`Analysis of BIP Server Events During Stuck Threads - GermainUX`,children:_jsx(OptimizedImage,{loading:`lazy`,src:`https://mintcdn.com/germain-ux/qPS41_DNCFigAODI/images/main/oracle-bi-publisher-monitoring/bip-server-event-analysis.png?fit=max\u0026auto=format\u0026n=qPS41_DNCFigAODI\u0026q=85\u0026s=031d7429c49742719db2c0b490f6911f`,alt:`Analysis screen for the BIP Server Event KPI, with a spike of BEA-000337 stuck-thread events on bi_server1`,\"data-og-width\":`1440`,width:`1440`,\"data-og-height\":`900`,height:`900`,\"data-path\":`images/main/oracle-bi-publisher-monitoring/bip-server-event-analysis.png`,\"data-optimize\":`true`,\"data-opv\":`3`,srcset:`https://mintcdn.com/germain-ux/qPS41_DNCFigAODI/images/main/oracle-bi-publisher-monitoring/bip-server-event-analysis.png?w=280\u0026fit=max\u0026auto=format\u0026n=qPS41_DNCFigAODI\u0026q=85\u0026s=c34d814b36e059142bec52ba7f7c5b7b 280w, https://mintcdn.com/germain-ux/qPS41_DNCFigAODI/images/main/oracle-bi-publisher-monitoring/bip-server-event-analysis.png?w=560\u0026fit=max\u0026auto=format\u0026n=qPS41_DNCFigAODI\u0026q=85\u0026s=f8ff1efe5d92a94055115729a9b0bd87 560w, https://mintcdn.com/germain-ux/qPS41_DNCFigAODI/images/main/oracle-bi-publisher-monitoring/bip-server-event-analysis.png?w=840\u0026fit=max\u0026auto=format\u0026n=qPS41_DNCFigAODI\u0026q=85\u0026s=5fb817da01e2dea400dfc5160fadc8c3 840w, https://mintcdn.com/germain-ux/qPS41_DNCFigAODI/images/main/oracle-bi-publisher-monitoring/bip-server-event-analysis.png?w=1100\u0026fit=max\u0026auto=format\u0026n=qPS41_DNCFigAODI\u0026q=85\u0026s=ce5fb9d91f6274a9863e804caca78b2c 1100w, https://mintcdn.com/germain-ux/qPS41_DNCFigAODI/images/main/oracle-bi-publisher-monitoring/bip-server-event-analysis.png?w=1650\u0026fit=max\u0026auto=format\u0026n=qPS41_DNCFigAODI\u0026q=85\u0026s=03a5453c98ff924964299f65ab43c56f 1650w, https://mintcdn.com/germain-ux/qPS41_DNCFigAODI/images/main/oracle-bi-publisher-monitoring/bip-server-event-analysis.png?w=2500\u0026fit=max\u0026auto=format\u0026n=qPS41_DNCFigAODI\u0026q=85\u0026s=48c3eb45d8e571887c38ab856cbc6121 2500w`})}),`\n`,_jsx(Heading,{level:`3`,id:`analysis`,children:`Analysis`}),`\n`,_jsxs(_components.p,{children:[`Open a BI Publisher KPI in the `,_jsx(_components.a,{href:`/dashboards/analytics-dashboard/4-analysis-dashboard`,children:`Analysis`}),` screen to see what changed in the selected period. The top row compares the period with the same hours on the previous days, and shows the hourly trend. The relationships chart shows the KPI over a longer time range, with the selected period highlighted. The segmentation breakdown lists the hosts, users and message types that changed most, and labels each one, for example as a spike.`]}),`\n`,_jsx(Heading,{level:`3`,id:`investigate-a-node-manager-that-didn’t-start`,children:`Investigate a Node Manager That Didn’t Start`}),`\n`,_jsxs(_components.p,{children:[`After a host is patched, the WebLogic servers can come back while the Node Manager doesn’t. Open the `,_jsx(_components.strong,{children:`WebLogic Node Manager Count`}),` KPI in the Analysis screen. Compare the average count with the previous days, and use the hourly trend to see when it fell to `,_jsx(_components.code,{children:`0`}),`.`]}),`\n`,_jsxs(_components.p,{children:[`In the example below, `,_jsx(_components.code,{children:`bip-01`}),` was patched on 9 November, and its Node Manager wasn’t started again. From 09:00 the count is `,_jsx(_components.code,{children:`0`}),`. Over the day shown, the average count is 0.264, down 73.6% on the 1.000 of the previous days, and the breakdown marks `,_jsx(_components.code,{children:`bip-01`}),` as a drop. The relationships chart shows the count at `,_jsx(_components.code,{children:`0`}),` until the Node Manager was started on the afternoon of 10 November. The SLA on the KPI flags the host as soon as no Node Manager runs, so an `,_jsx(_components.a,{href:`/automation/notifications`,children:`alert`}),` can tell you on the morning of the patch.`]}),`\n`,_jsx(Frame,{caption:`Aggregate Analysis of WebLogic Node Manager Count After Host Patching - GermainUX`,children:_jsx(OptimizedImage,{loading:`lazy`,src:`https://mintcdn.com/germain-ux/qPS41_DNCFigAODI/images/main/oracle-bi-publisher-monitoring/bip-node-manager-count-analysis.png?fit=max\u0026auto=format\u0026n=qPS41_DNCFigAODI\u0026q=85\u0026s=b133e690f494922b02c81ac289884719`,alt:`Analysis screen for the WebLogic Node Manager Count KPI, with an average of 0.264 against 1.000 on the previous days, the hourly trend falling to 0, the relationships chart at 0 from 9 November to the afternoon of 10 November, and bip-01 marked as a drop`,\"data-og-width\":`1440`,width:`1440`,\"data-og-height\":`900`,height:`900`,\"data-path\":`images/main/oracle-bi-publisher-monitoring/bip-node-manager-count-analysis.png`,\"data-optimize\":`true`,\"data-opv\":`3`,srcset:`https://mintcdn.com/germain-ux/qPS41_DNCFigAODI/images/main/oracle-bi-publisher-monitoring/bip-node-manager-count-analysis.png?w=280\u0026fit=max\u0026auto=format\u0026n=qPS41_DNCFigAODI\u0026q=85\u0026s=4e340c06187b3a155387440d5379bc09 280w, https://mintcdn.com/germain-ux/qPS41_DNCFigAODI/images/main/oracle-bi-publisher-monitoring/bip-node-manager-count-analysis.png?w=560\u0026fit=max\u0026auto=format\u0026n=qPS41_DNCFigAODI\u0026q=85\u0026s=d26141f958a0f57b8e4f9b322dbfd58b 560w, https://mintcdn.com/germain-ux/qPS41_DNCFigAODI/images/main/oracle-bi-publisher-monitoring/bip-node-manager-count-analysis.png?w=840\u0026fit=max\u0026auto=format\u0026n=qPS41_DNCFigAODI\u0026q=85\u0026s=662c0f07ae45cc41cb5736804846577b 840w, https://mintcdn.com/germain-ux/qPS41_DNCFigAODI/images/main/oracle-bi-publisher-monitoring/bip-node-manager-count-analysis.png?w=1100\u0026fit=max\u0026auto=format\u0026n=qPS41_DNCFigAODI\u0026q=85\u0026s=9cd33dcb419c5e31e8f7db3b6edfa139 1100w, https://mintcdn.com/germain-ux/qPS41_DNCFigAODI/images/main/oracle-bi-publisher-monitoring/bip-node-manager-count-analysis.png?w=1650\u0026fit=max\u0026auto=format\u0026n=qPS41_DNCFigAODI\u0026q=85\u0026s=8f88d0448ef033ae41988fa96d117c11 1650w, https://mintcdn.com/germain-ux/qPS41_DNCFigAODI/images/main/oracle-bi-publisher-monitoring/bip-node-manager-count-analysis.png?w=2500\u0026fit=max\u0026auto=format\u0026n=qPS41_DNCFigAODI\u0026q=85\u0026s=4dc2a6a2c054d376d29ada72ca226b63 2500w`})}),`\n`,_jsx(Heading,{level:`3`,id:`investigate-a-server-restart`,children:`Investigate a Server Restart`}),`\n`,_jsxs(_components.p,{children:[`When `,_jsx(_components.code,{children:`bi_server1`}),` crashes and the Node Manager restarts it, the `,_jsx(_components.strong,{children:`WebLogic Server Count`}),` of the host drops for a few minutes. Open the KPI in the Analysis screen to see when it dropped and for how long.`]}),`\n`,_jsxs(_components.p,{children:[`In the example below, `,_jsx(_components.code,{children:`bi_server1`}),` on `,_jsx(_components.code,{children:`bip-01`}),` ran out of heap at 15:20. Before it stopped, WebLogic logged low-memory warnings (`,_jsx(_components.code,{children:`BEA-310003`}),`) in the `,_jsx(_components.strong,{children:`BIP Server Event`}),` KPI, and BI Publisher logged `,_jsx(_components.code,{children:`java.lang.OutOfMemoryError: Java heap space`}),` in `,_jsx(_components.strong,{children:`BIP Diagnostic Event`}),`. The server count fell from `,_jsx(_components.code,{children:`2`}),` to `,_jsx(_components.code,{children:`1`}),` until the Node Manager restarted the server 25 minutes later. Over the five hours shown, the average count is 1.917, down 4.2% on the 2.000 of the previous days, and the hourly trend dips in the afternoon. The count never reaches `,_jsx(_components.code,{children:`0`}),`, so the SLA on the KPI isn’t breached. Open the event KPIs for the same period to see why the server stopped.`]}),`\n`,_jsx(Frame,{caption:`Aggregate Analysis of WebLogic Server Count During a Restart - GermainUX`,children:_jsx(OptimizedImage,{loading:`lazy`,src:`https://mintcdn.com/germain-ux/qPS41_DNCFigAODI/images/main/oracle-bi-publisher-monitoring/bip-server-count-restart-analysis.png?fit=max\u0026auto=format\u0026n=qPS41_DNCFigAODI\u0026q=85\u0026s=87debd8348c92c2858761d8e7c4ff420`,alt:`Analysis screen for the WebLogic Server Count KPI, with an average of 1.917 servers against 2.000 on the previous days, and a dip in the hourly trend and the relationships chart on 12 November`,\"data-og-width\":`1440`,width:`1440`,\"data-og-height\":`602`,height:`602`,\"data-path\":`images/main/oracle-bi-publisher-monitoring/bip-server-count-restart-analysis.png`,\"data-optimize\":`true`,\"data-opv\":`3`,srcset:`https://mintcdn.com/germain-ux/qPS41_DNCFigAODI/images/main/oracle-bi-publisher-monitoring/bip-server-count-restart-analysis.png?w=280\u0026fit=max\u0026auto=format\u0026n=qPS41_DNCFigAODI\u0026q=85\u0026s=14a57d238101d2d9d7c4623edc0d4b52 280w, https://mintcdn.com/germain-ux/qPS41_DNCFigAODI/images/main/oracle-bi-publisher-monitoring/bip-server-count-restart-analysis.png?w=560\u0026fit=max\u0026auto=format\u0026n=qPS41_DNCFigAODI\u0026q=85\u0026s=476590ed3d80922e78dd25233b73ddba 560w, https://mintcdn.com/germain-ux/qPS41_DNCFigAODI/images/main/oracle-bi-publisher-monitoring/bip-server-count-restart-analysis.png?w=840\u0026fit=max\u0026auto=format\u0026n=qPS41_DNCFigAODI\u0026q=85\u0026s=6964bed6fe803004a5d4320a9f225a6c 840w, https://mintcdn.com/germain-ux/qPS41_DNCFigAODI/images/main/oracle-bi-publisher-monitoring/bip-server-count-restart-analysis.png?w=1100\u0026fit=max\u0026auto=format\u0026n=qPS41_DNCFigAODI\u0026q=85\u0026s=5f4e3938b6cda3d5f97d25985fa0e36f 1100w, https://mintcdn.com/germain-ux/qPS41_DNCFigAODI/images/main/oracle-bi-publisher-monitoring/bip-server-count-restart-analysis.png?w=1650\u0026fit=max\u0026auto=format\u0026n=qPS41_DNCFigAODI\u0026q=85\u0026s=68d8c9b1c27d91824fcdf682a2f31855 1650w, https://mintcdn.com/germain-ux/qPS41_DNCFigAODI/images/main/oracle-bi-publisher-monitoring/bip-server-count-restart-analysis.png?w=2500\u0026fit=max\u0026auto=format\u0026n=qPS41_DNCFigAODI\u0026q=85\u0026s=41793594eed6e53d2cb09d61d2a7caa2 2500w`})}),`\n`,_jsx(Heading,{level:`3`,id:`investigate-reporting-database-errors`,children:`Investigate Reporting Database Errors`}),`\n`,_jsxs(_components.p,{children:[`When the reporting database can’t be reached, every report that reads it fails. Open the `,_jsx(_components.strong,{children:`BIP Diagnostic Event`}),` KPI in the Analysis screen. The top row shows how far the errors rose above the previous days. The segmentation breakdown shows whether they come from one user or from all of them.`]}),`\n`,_jsxs(_components.p,{children:[`In the example below, the reporting database `,_jsx(_components.code,{children:`rpt-db-01`}),` was unreachable for 45 minutes. The data engine logged a connection error for data source `,_jsx(_components.code,{children:`RPT_DB`}),` for every report that ran, and WebLogic logged `,_jsx(_components.code,{children:`BEA-001129`}),` for the `,_jsx(_components.code,{children:`RPT_DB`}),` connection pool in the `,_jsx(_components.strong,{children:`BIP Server Event`}),` KPI. The analysis shows 146 diagnostic events against 13 at the same hours on the previous days. The breakdown marks the host `,_jsx(_components.code,{children:`bip-01`}),` and the `,_jsx(_components.code,{children:`ERROR`}),` message type as a spike, and spreads the errors over the users `,_jsx(_components.code,{children:`ops_lead01`}),`, `,_jsx(_components.code,{children:`sched_batch`}),`, `,_jsx(_components.code,{children:`fin_analyst01`}),` and `,_jsx(_components.code,{children:`fin_analyst02`}),`. Errors from every user point to a shared cause, such as the database, rather than one report. The errors stop when the database is back.`]}),`\n`,_jsx(Frame,{caption:`Aggregate Analysis of BIP Diagnostic Events During a Database Outage - GermainUX`,children:_jsx(OptimizedImage,{loading:`lazy`,src:`https://mintcdn.com/germain-ux/qPS41_DNCFigAODI/images/main/oracle-bi-publisher-monitoring/bip-diagnostic-event-database-analysis.png?fit=max\u0026auto=format\u0026n=qPS41_DNCFigAODI\u0026q=85\u0026s=1eed0a9eb3cafc4f881e680ae131e0f2`,alt:`Analysis screen for the BIP Diagnostic Event KPI, with 146 events against 13 on the previous days, a spike on the morning of 14 November in the relationships chart, and bip-01, ERROR and the users ops_lead01, sched_batch, fin_analyst01 and fin_analyst02 marked as spikes`,\"data-og-width\":`1440`,width:`1440`,\"data-og-height\":`900`,height:`900`,\"data-path\":`images/main/oracle-bi-publisher-monitoring/bip-diagnostic-event-database-analysis.png`,\"data-optimize\":`true`,\"data-opv\":`3`,srcset:`https://mintcdn.com/germain-ux/qPS41_DNCFigAODI/images/main/oracle-bi-publisher-monitoring/bip-diagnostic-event-database-analysis.png?w=280\u0026fit=max\u0026auto=format\u0026n=qPS41_DNCFigAODI\u0026q=85\u0026s=37c94d0aaab58d55fdb8825a8d45d9f8 280w, https://mintcdn.com/germain-ux/qPS41_DNCFigAODI/images/main/oracle-bi-publisher-monitoring/bip-diagnostic-event-database-analysis.png?w=560\u0026fit=max\u0026auto=format\u0026n=qPS41_DNCFigAODI\u0026q=85\u0026s=5676a68213198e62e76b8586c26fb162 560w, https://mintcdn.com/germain-ux/qPS41_DNCFigAODI/images/main/oracle-bi-publisher-monitoring/bip-diagnostic-event-database-analysis.png?w=840\u0026fit=max\u0026auto=format\u0026n=qPS41_DNCFigAODI\u0026q=85\u0026s=40e1d0b9d82c6a9df342f25e674fadf4 840w, https://mintcdn.com/germain-ux/qPS41_DNCFigAODI/images/main/oracle-bi-publisher-monitoring/bip-diagnostic-event-database-analysis.png?w=1100\u0026fit=max\u0026auto=format\u0026n=qPS41_DNCFigAODI\u0026q=85\u0026s=0fcfc7a7028ff2e8d35f7eb9a474edad 1100w, https://mintcdn.com/germain-ux/qPS41_DNCFigAODI/images/main/oracle-bi-publisher-monitoring/bip-diagnostic-event-database-analysis.png?w=1650\u0026fit=max\u0026auto=format\u0026n=qPS41_DNCFigAODI\u0026q=85\u0026s=e787433b0a0ae9690414862a364497cf 1650w, https://mintcdn.com/germain-ux/qPS41_DNCFigAODI/images/main/oracle-bi-publisher-monitoring/bip-diagnostic-event-database-analysis.png?w=2500\u0026fit=max\u0026auto=format\u0026n=qPS41_DNCFigAODI\u0026q=85\u0026s=ef29e7a9b4f06230a3744cb7d6d16ddf 2500w`})}),`\n`,_jsx(Heading,{level:`3`,id:`investigate-failed-report-delivery`,children:`Investigate Failed Report Delivery`}),`\n`,_jsxs(_components.p,{children:[`A bursting job that can’t send its email logs a delivery error for each report it tries to send. Open the `,_jsx(_components.strong,{children:`BIP Diagnostic Event`}),` KPI in the Analysis screen for the time the job ran. The segmentation breakdown shows the user the job runs as.`]}),`\n`,_jsxs(_components.p,{children:[`In the example below, the nightly bursting job couldn’t reach the SMTP server `,_jsx(_components.code,{children:`smtp.example.com`}),` for 40 minutes after 02:00. Each delivery failed with `,_jsx(_components.code,{children:`Could not connect to SMTP host: smtp.example.com, port: 25`}),`. The analysis shows 133 events against 3 at the same hours on the previous days, and the breakdown marks the host `,_jsx(_components.code,{children:`bip-01`}),` and the user `,_jsx(_components.code,{children:`sched_batch`}),` as a spike. The SLA on the KPI flags each delivery error, so an `,_jsx(_components.a,{href:`/automation/notifications`,children:`alert`}),` can tell you before the report recipients notice that nothing arrived.`]}),`\n`,_jsx(Frame,{caption:`Aggregate Analysis of Failed Report Delivery - GermainUX`,children:_jsx(OptimizedImage,{loading:`lazy`,src:`https://mintcdn.com/germain-ux/qPS41_DNCFigAODI/images/main/oracle-bi-publisher-monitoring/bip-diagnostic-event-delivery-analysis.png?fit=max\u0026auto=format\u0026n=qPS41_DNCFigAODI\u0026q=85\u0026s=29020dbd73c897d81dc54fab06629457`,alt:`Analysis screen for the BIP Diagnostic Event KPI, with 133 events against 3 on the previous days, a spike in the early hours of 15 November in the relationships chart, and bip-01 and the sched_batch user marked as spikes`,\"data-og-width\":`1440`,width:`1440`,\"data-og-height\":`900`,height:`900`,\"data-path\":`images/main/oracle-bi-publisher-monitoring/bip-diagnostic-event-delivery-analysis.png`,\"data-optimize\":`true`,\"data-opv\":`3`,srcset:`https://mintcdn.com/germain-ux/qPS41_DNCFigAODI/images/main/oracle-bi-publisher-monitoring/bip-diagnostic-event-delivery-analysis.png?w=280\u0026fit=max\u0026auto=format\u0026n=qPS41_DNCFigAODI\u0026q=85\u0026s=375415926480f67d2771c589d5a6a14e 280w, https://mintcdn.com/germain-ux/qPS41_DNCFigAODI/images/main/oracle-bi-publisher-monitoring/bip-diagnostic-event-delivery-analysis.png?w=560\u0026fit=max\u0026auto=format\u0026n=qPS41_DNCFigAODI\u0026q=85\u0026s=2df4cfc9a23a15897bc04c32a61ead3f 560w, https://mintcdn.com/germain-ux/qPS41_DNCFigAODI/images/main/oracle-bi-publisher-monitoring/bip-diagnostic-event-delivery-analysis.png?w=840\u0026fit=max\u0026auto=format\u0026n=qPS41_DNCFigAODI\u0026q=85\u0026s=376cd8de7efd1535a19949a9ebdaec58 840w, https://mintcdn.com/germain-ux/qPS41_DNCFigAODI/images/main/oracle-bi-publisher-monitoring/bip-diagnostic-event-delivery-analysis.png?w=1100\u0026fit=max\u0026auto=format\u0026n=qPS41_DNCFigAODI\u0026q=85\u0026s=3264be9dfe52ced6509b076554af2e25 1100w, https://mintcdn.com/germain-ux/qPS41_DNCFigAODI/images/main/oracle-bi-publisher-monitoring/bip-diagnostic-event-delivery-analysis.png?w=1650\u0026fit=max\u0026auto=format\u0026n=qPS41_DNCFigAODI\u0026q=85\u0026s=c8ae8fdae61f5bb7d07734c1aae08229 1650w, https://mintcdn.com/germain-ux/qPS41_DNCFigAODI/images/main/oracle-bi-publisher-monitoring/bip-diagnostic-event-delivery-analysis.png?w=2500\u0026fit=max\u0026auto=format\u0026n=qPS41_DNCFigAODI\u0026q=85\u0026s=32bffa95bde6505ce5fb6e969067d069 2500w`})}),`\n`,_jsx(Heading,{level:`3`,id:`slas-and-alerts`,children:`SLAs and Alerts`}),`\n`,_jsxs(_components.p,{children:[`The event KPIs ship with an SLA that flags every new event. The server-count KPIs ship with an SLA that flags a host where no WebLogic server or no Node Manager runs. Get an `,_jsx(_components.a,{href:`/automation/notifications`,children:`alert`}),` by email, SMS, Slack or Teams when one is breached, and adjust the `,_jsx(_components.a,{href:`/analytics/slas`,children:`SLAs`}),` to the events you care about.`]}),`\n`,_jsx(Heading,{level:`3`,id:`correlation-with-other-technologies`,children:`Correlation with Other Technologies`}),`\n`,_jsxs(_components.p,{children:[_jsx(_components.a,{href:`/analytics/correlation-and-tracing`,children:`Correlate`}),` BI Publisher events with the `,_jsx(_components.a,{href:`/integrations/oracle-weblogic-monitoring`,children:`Oracle WebLogic`}),` servers it runs on, the `,_jsx(_components.a,{href:`/integrations/oracle-db-observability`,children:`Oracle Database`}),` behind its reports, and `,_jsx(_components.a,{href:`/integrations/obiee-monitoring`,children:`OBIEE`}),` when BI Publisher runs as part of it.`]}),`\n`,_jsx(Heading,{level:`2`,id:`how-it-works`,children:`How It Works`}),`\n`,_jsxs(`div`,{className:`gx-flow`,children:[_jsx(`span`,{children:`BIP logs and processes`}),_jsx(`span`,{children:`Engine on the BIP host`}),_jsx(`span`,{children:`KPIs`}),_jsx(`span`,{children:`Alerts`})]}),`\n`,_jsxs(_components.p,{children:[`The `,_jsx(_components.strong,{children:`BIP App Server`}),` wizard applies a server profile to the BI Publisher host. The profile deploys these components to the GermainUX Engine on that host:`]}),`\n`,_jsxs(Table,{children:[_jsx(_components.thead,{children:_jsxs(_components.tr,{children:[_jsx(_components.th,{children:`Component`}),_jsx(_components.th,{children:`What it does`})]})}),_jsxs(_components.tbody,{children:[_jsxs(_components.tr,{children:[_jsx(_components.td,{children:_jsx(_components.strong,{children:`BIP Admin Log Directory Monitor`})}),_jsxs(_components.td,{children:[`Watches the AdminServer log directory and sends new lines of `,_jsx(_components.code,{children:`AdminServer.log`}),` and `,_jsx(_components.code,{children:`AdminServer-diagnostic.log`}),` to the parsers`]})]}),_jsxs(_components.tr,{children:[_jsx(_components.td,{children:_jsx(_components.strong,{children:`BIP Log Directory Monitor`})}),_jsxs(_components.td,{children:[`Watches the managed server log directory and sends new lines of `,_jsx(_components.code,{children:`bipublisher.log`}),`, `,_jsx(_components.code,{children:`bi_server1.log`}),` and `,_jsx(_components.code,{children:`bi_server1-diagnostic.log`}),` to the parsers`]})]}),_jsxs(_components.tr,{children:[_jsx(_components.td,{children:_jsx(_components.strong,{children:`BIP Diagnostic Parser`})}),_jsxs(_components.td,{children:[`Reads the diagnostic logs and stores each error and warning as a `,_jsx(_components.strong,{children:`BIP Diagnostic Event`})]})]}),_jsxs(_components.tr,{children:[_jsx(_components.td,{children:_jsx(_components.strong,{children:`BIP Server Parser`})}),_jsxs(_components.td,{children:[`Reads the WebLogic server logs and stores each warning and error as a `,_jsx(_components.strong,{children:`BIP Server Event`})]})]}),_jsxs(_components.tr,{children:[_jsx(_components.td,{children:_jsx(_components.strong,{children:`BIP Monitor Local`})}),_jsx(_components.td,{children:`Counts the running WebLogic server and Node Manager processes on the host every minute`})]})]})]}),`\n`,_jsx(Heading,{level:`2`,id:`before-you-start`,children:`Before You Start`}),`\n`,_jsx(`div`,{className:`gx-list`,children:_jsxs(_components.ul,{children:[`\n`,_jsxs(_components.li,{children:[`A `,_jsx(_components.a,{href:`/deploy/germain-ux-engine`,children:`GermainUX Engine`}),` runs on the BI Publisher host.`]}),`\n`,_jsxs(_components.li,{children:[`The Engine’s account can read the AdminServer log directory and the `,_jsx(_components.code,{children:`bi_server1`}),` log directory, for example `,_jsx(_components.code,{children:`\u003cDOMAIN_HOME>/servers/AdminServer/logs`}),` and `,_jsx(_components.code,{children:`\u003cDOMAIN_HOME>/servers/bi_server1/logs`}),`.`]}),`\n`,_jsxs(_components.li,{children:[`The BI Publisher managed server is named `,_jsx(_components.code,{children:`bi_server1`}),`, as in a default installation. The log monitor picks up its log files by that name.`]}),`\n`,_jsxs(_components.li,{children:[`The host is a `,_jsx(_components.a,{href:`/management/data-source`,children:`host data source`}),` in GermainUX.`]}),`\n`]})}),`\n`,_jsx(Heading,{level:`2`,id:`deploy`,children:`Deploy`}),`\n`,_jsxs(Steps,{children:[_jsx(Step,{title:`Open the BIP App Server wizard`,children:_jsxs(_components.p,{children:[`In the left menu, go to `,_jsx(_components.strong,{children:`Settings > Wizards`}),`. On the `,_jsx(_components.strong,{children:`BIP App Server`}),` card, click `,_jsx(_components.strong,{children:`Add`}),`.`]})}),_jsx(Step,{title:`Select the BI Publisher host`,children:_jsxs(_components.p,{children:[`In `,_jsx(_components.strong,{children:`Servers`}),`, select the BI Publisher host, and then click `,_jsx(_components.strong,{children:`Apply`}),`.`]})}),_jsxs(Step,{title:`Enter the log directories`,children:[_jsx(_components.p,{children:`Fill in the fields, and then finish:`}),_jsxs(Table,{children:[_jsx(_components.thead,{children:_jsxs(_components.tr,{children:[_jsx(_components.th,{children:`Field`}),_jsx(_components.th,{children:`Value`})]})}),_jsxs(_components.tbody,{children:[_jsxs(_components.tr,{children:[_jsx(_components.td,{children:_jsx(_components.strong,{children:`Admin Log Directory`})}),_jsxs(_components.td,{children:[`The AdminServer log directory, for example `,_jsx(_components.code,{children:`\u003cDOMAIN_HOME>/servers/AdminServer/logs`}),`. Select it, or create it.`]})]}),_jsxs(_components.tr,{children:[_jsx(_components.td,{children:_jsx(_components.strong,{children:`Server Log Directory`})}),_jsxs(_components.td,{children:[`The `,_jsx(_components.code,{children:`bi_server1`}),` log directory, for example `,_jsx(_components.code,{children:`\u003cDOMAIN_HOME>/servers/bi_server1/logs`})]})]}),_jsxs(_components.tr,{children:[_jsx(_components.td,{children:_jsx(_components.strong,{children:`Application`})}),_jsxs(_components.td,{children:[`The application the data belongs to. The default is `,_jsx(_components.code,{children:`BIP - Oracle Business Intelligence Publisher`}),`.`]})]})]})]}),_jsx(Frame,{caption:`BIP App Server Profile Fields - GermainUX`,children:_jsx(OptimizedImage,{loading:`lazy`,src:`https://mintcdn.com/germain-ux/qPS41_DNCFigAODI/images/main/oracle-bi-publisher-monitoring/bip-app-server-profile-fields.png?fit=max\u0026auto=format\u0026n=qPS41_DNCFigAODI\u0026q=85\u0026s=591397cf8b785c9a04eb1342e43da822`,alt:`BIP App Server profile fields with the Admin Log Directory, Server Log Directory and Application filled in`,\"data-og-width\":`900`,width:`900`,\"data-og-height\":`784`,height:`784`,\"data-path\":`images/main/oracle-bi-publisher-monitoring/bip-app-server-profile-fields.png`,\"data-optimize\":`true`,\"data-opv\":`3`,srcset:`https://mintcdn.com/germain-ux/qPS41_DNCFigAODI/images/main/oracle-bi-publisher-monitoring/bip-app-server-profile-fields.png?w=280\u0026fit=max\u0026auto=format\u0026n=qPS41_DNCFigAODI\u0026q=85\u0026s=9749422d487c0ab0049170e39683c7b9 280w, https://mintcdn.com/germain-ux/qPS41_DNCFigAODI/images/main/oracle-bi-publisher-monitoring/bip-app-server-profile-fields.png?w=560\u0026fit=max\u0026auto=format\u0026n=qPS41_DNCFigAODI\u0026q=85\u0026s=0b2d675008398a414a45e4d9e0a23fd4 560w, https://mintcdn.com/germain-ux/qPS41_DNCFigAODI/images/main/oracle-bi-publisher-monitoring/bip-app-server-profile-fields.png?w=840\u0026fit=max\u0026auto=format\u0026n=qPS41_DNCFigAODI\u0026q=85\u0026s=5ba66b258ec9bfafce8ccf19724f21d7 840w, https://mintcdn.com/germain-ux/qPS41_DNCFigAODI/images/main/oracle-bi-publisher-monitoring/bip-app-server-profile-fields.png?w=1100\u0026fit=max\u0026auto=format\u0026n=qPS41_DNCFigAODI\u0026q=85\u0026s=a47803e4dc4c77fb0e67448ff43739f0 1100w, https://mintcdn.com/germain-ux/qPS41_DNCFigAODI/images/main/oracle-bi-publisher-monitoring/bip-app-server-profile-fields.png?w=1650\u0026fit=max\u0026auto=format\u0026n=qPS41_DNCFigAODI\u0026q=85\u0026s=206da8a672d23cf26de0c8598e66ca4b 1650w, https://mintcdn.com/germain-ux/qPS41_DNCFigAODI/images/main/oracle-bi-publisher-monitoring/bip-app-server-profile-fields.png?w=2500\u0026fit=max\u0026auto=format\u0026n=qPS41_DNCFigAODI\u0026q=85\u0026s=a79203a1af7dc9bc6d938a023ce1a597 2500w`})})]})]}),`\n`,_jsx(_components.p,{children:`GermainUX deploys the components to the Engine on the host and starts reading the logs. Repeat the wizard for each BI Publisher host.`}),`\n`,_jsx(Heading,{level:`2`,id:`validate`,children:`Validate`}),`\n`,_jsxs(Steps,{children:[_jsx(Step,{title:`Check the server counts`,children:_jsxs(_components.p,{children:[`In GermainUX Workspace, open the `,_jsx(_components.strong,{children:`WebLogic Server Count`}),` KPI. Within two minutes, the BI Publisher host shows the number of WebLogic servers running on it, for example `,_jsx(_components.code,{children:`2`}),` for the AdminServer and `,_jsx(_components.code,{children:`bi_server1`}),`.`]})}),_jsx(Step,{title:`Check the events`,children:_jsxs(_components.p,{children:[`Open the `,_jsx(_components.strong,{children:`BIP Diagnostic Event`}),` and `,_jsx(_components.strong,{children:`BIP Server Event`}),` KPIs. They show the errors and warnings that the logs receive after deployment. If the servers write none, run a report with a parameter you know fails, and look for its error.`]})})]}),`\n`,_jsx(Heading,{level:`2`,id:`troubleshooting`,children:`Troubleshooting`}),`\n`,_jsxs(AccordionGroup,{children:[_jsx(Accordion,{title:`No BI Publisher events appear`,id:`no-bi-publisher-events-appear`,children:_jsxs(_components.p,{children:[`Check that the Engine runs on the BI Publisher host, that its account can read both log directories, and that the managed server’s logs are named `,_jsx(_components.code,{children:`bi_server1.log`}),` and `,_jsx(_components.code,{children:`bi_server1-diagnostic.log`}),`. Log files of a managed server with another name aren’t picked up.`]})}),_jsx(Accordion,{title:`WebLogic Server Count shows 0`,id:`weblogic-server-count-shows-0`,children:_jsx(_components.p,{children:`No WebLogic server process runs on the host, or the Engine runs on another host. Start the servers, or deploy the profile to the Engine on the BI Publisher host.`})}),_jsx(Accordion,{title:`Only some log messages appear`,id:`only-some-log-messages-appear`,children:_jsx(_components.p,{children:`The parsers keep errors and warnings only. Informational and notification messages aren’t stored.`})})]}),`\n`,_jsx(Heading,{level:`2`,id:`security-and-privacy`,children:`Security and Privacy`}),`\n`,_jsx(_components.p,{children:`Oracle BI Publisher monitoring data includes personal data:`}),`\n`,_jsx(`div`,{className:`gx-list`,children:_jsxs(_components.ul,{children:[`\n`,_jsxs(_components.li,{children:[_jsx(_components.strong,{children:`Identity data`}),`: the BI Publisher user ID of the request that logged the event`]}),`\n`,_jsxs(_components.li,{children:[_jsx(_components.strong,{children:`Free text`}),`: the log message in each event, which can contain report names, parameters, email addresses and host names. Treat it as possibly containing personal or customer data.`]}),`\n`]})}),`\n`,_jsxs(_components.p,{children:[`To mask, anonymize or exclude this data, see `,_jsx(_components.a,{href:`/management/compliance-privacy-and-security/data-privacy`,children:`Data Privacy`}),`.`]}),`\n`,_jsx(Heading,{level:`2`,id:`kpis`,children:`KPIs`}),`\n`,_jsxs(Table,{children:[_jsx(_components.thead,{children:_jsxs(_components.tr,{children:[_jsx(_components.th,{children:`KPI`}),_jsx(_components.th,{children:`What it holds`}),_jsx(_components.th,{children:`Default SLA`})]})}),_jsxs(_components.tbody,{children:[_jsxs(_components.tr,{children:[_jsx(_components.td,{children:_jsx(_components.strong,{children:`BIP Diagnostic Event`})}),_jsx(_components.td,{children:`One event per error or warning in the diagnostic logs`}),_jsx(_components.td,{children:`Flags every event`})]}),_jsxs(_components.tr,{children:[_jsx(_components.td,{children:_jsx(_components.strong,{children:`BIP Server Event`})}),_jsx(_components.td,{children:`One event per warning or error in the WebLogic server logs`}),_jsx(_components.td,{children:`Flags every event`})]}),_jsxs(_components.tr,{children:[_jsx(_components.td,{children:_jsx(_components.strong,{children:`WebLogic Server Count`})}),_jsx(_components.td,{children:`The number of WebLogic server processes running on the host`}),_jsxs(_components.td,{children:[`OK when greater than `,_jsx(_components.code,{children:`0`}),`, per host`]})]}),_jsxs(_components.tr,{children:[_jsx(_components.td,{children:_jsx(_components.strong,{children:`WebLogic Node Manager Count`})}),_jsx(_components.td,{children:`The number of Node Manager processes running on the host`}),_jsxs(_components.td,{children:[`OK when greater than `,_jsx(_components.code,{children:`0`}),`, per host`]})]})]})]}),`\n`,_jsxs(_components.p,{children:[`The event KPIs are data model `,_jsx(_components.code,{children:`GenericEvent`}),`, and the count KPIs `,_jsx(_components.code,{children:`GenericMetric`}),`. The count KPIs are shared with `,_jsx(_components.a,{href:`/integrations/obiee-monitoring`,children:`OBIEE`}),`. See `,_jsx(_components.a,{href:`/analytics/kpis`,children:`KPIs`}),` and `,_jsx(_components.a,{href:`/analytics/slas`,children:`SLAs`}),`.`]}),`\n`,_jsx(Heading,{level:`2`,id:`related-documentation`,children:`Related Documentation`}),`\n`,_jsxs(CardGroup,{cols:3,children:[_jsx(Card,{title:`Oracle WebLogic`,icon:`server`,href:`/integrations/oracle-weblogic-monitoring`,children:_jsx(_components.p,{children:`The servers BI Publisher runs on`})}),_jsx(Card,{title:`File and Log Monitoring`,icon:`file-lines`,href:`/integrations/file-log-monitoring`,children:_jsx(_components.p,{children:`How GermainUX reads log files`})}),_jsx(Card,{title:`Automation`,icon:`robot`,href:`/automation`,children:_jsx(_components.p,{children:`More Automation Features`})})]}),`\n`,_jsx(Heading,{level:`2`,id:`get-help`,children:`Get Help`}),`\n`,_jsx(_components.p,{children:`The GermainUX team can help you monitor BI Publisher installations with other managed server names or log locations.`}),`\n`,_jsxs(CardGroup,{cols:2,children:[_jsx(Card,{title:`Contact GermainUX Support`,icon:`headset`,href:`/getting-started/support`,children:_jsx(_components.p,{children:`The GermainUX team helps you get up and running faster, empower your team, turn data into actionable insights, and optimize performance to deliver measurable business outcomes.`})}),_jsx(Card,{title:`Can't Find What You Need?`,icon:`magnifying-glass`,children:_jsxs(_components.p,{children:[`Search all GermainUX docs with `,_jsx(_components.strong,{children:`Ctrl + K`}),`, or use the feedback buttons at the bottom of this page to tell us what is missing.`]})})]}),`\n`,_jsx(_MdxComponentBoundary,{name:`GxFooter`,children:_jsx(GxFooter,{})}),`\n`,_jsx(_MdxComponentBoundary,{name:`GxStyle`,children:_jsx(GxStyle,{})})]})}function MDXContent(props={}){const{wrapper:MDXLayout}={..._provideComponents(),...props.components};return MDXLayout?_jsx(MDXLayout,{...props,children:_jsx(_createMdxContent,{...props})}):_createMdxContent(props)}return{GxFooter,GxStyle,default:MDXContent};function _missingMdxReference(id,component){throw new Error(`Expected `+(component?`component`:`object`)+\" `\"+id+\"` to be defined: you likely forgot to import, pass, or provide it.\")}","frontmatter":{},"scope":{"config":{},"pageMetadata":{"title":"Oracle BI Publisher Monitoring","sidebarTitle":"Oracle BI Publisher Observability","description":"Know when BI Publisher reports fail, a server stops or threads get stuck, from the WebLogic and diagnostic logs of every BI Publisher host.","icon":"plug","keywords":["Oracle BI Publisher","BI Publisher","BIP","bi_server1","xmlpserver"],"href":"/integrations/oracle-bi-publisher-monitoring"}}},"mdxSourceWithNoJs":null,"noJsSplices":[[136,153,"Style=()=>null;const GxFooter=()=>_jsx(`"],[255,12837,""],[53854,53874,"Style,GxFooter,defau"]]},"mdxExtracts":{"tableOfContents":[{"title":"Overview","slug":"overview","depth":2,"children":[{"title":"Questions It Answers","slug":"questions-it-answers","depth":3,"children":[]}]},{"title":"What Is Monitored","slug":"what-is-monitored","depth":2,"children":[]},{"title":"Analytics, Alerts and Automation","slug":"analytics-alerts-and-automation","depth":2,"children":[{"title":"AI Analysis","slug":"ai-analysis","depth":3,"children":[]},{"title":"Dashboards and Reports","slug":"dashboards-and-reports","depth":3,"children":[]},{"title":"Analysis","slug":"analysis","depth":3,"children":[]},{"title":"Investigate a Node Manager That Didn’t Start","slug":"investigate-a-node-manager-that-didn’t-start","depth":3,"children":[]},{"title":"Investigate a Server Restart","slug":"investigate-a-server-restart","depth":3,"children":[]},{"title":"Investigate Reporting Database Errors","slug":"investigate-reporting-database-errors","depth":3,"children":[]},{"title":"Investigate Failed Report Delivery","slug":"investigate-failed-report-delivery","depth":3,"children":[]},{"title":"SLAs and Alerts","slug":"slas-and-alerts","depth":3,"children":[]},{"title":"Correlation with Other Technologies","slug":"correlation-with-other-technologies","depth":3,"children":[]}]},{"title":"How It Works","slug":"how-it-works","depth":2,"children":[]},{"title":"Before You Start","slug":"before-you-start","depth":2,"children":[]},{"title":"Deploy","slug":"deploy","depth":2,"children":[]},{"title":"Validate","slug":"validate","depth":2,"children":[]},{"title":"Troubleshooting","slug":"troubleshooting","depth":2,"children":[]},{"title":"Security and Privacy","slug":"security-and-privacy","depth":2,"children":[]},{"title":"KPIs","slug":"kpis","depth":2,"children":[]},{"title":"Related Documentation","slug":"related-documentation","depth":2,"children":[]},{"title":"Get Help","slug":"get-help","depth":2,"children":[]}],"codeExamples":{}},"jsLinks":[],"subdomain":"germain-ux","siteName":"GermainUX Docs","title":"Oracle BI Publisher Monitoring - GermainUX Docs","navMaps":{"firstHrefInVersion":{},"firstHrefInLanguage":{}},"lastModified":"2026-11-17T10:42:25.441Z","originalFileLocation":"integrations/oracle-bi-publisher-monitoring.mdx"},"headHtml":"\u003cscript data-mint-head>(function(){var d=document.documentElement,p=null;if(!p){try{p=localStorage.getItem(\"isDarkMode\")}catch(e){}if(p==='true')p='dark';else if(p==='false')p='light';if(p!=='light'\u0026\u0026p!=='dark'\u0026\u0026p!=='system')p=\"light\"}var r=p==='system'?(matchMedia(\"(prefers-color-scheme: dark)\").matches?'dark':'light'):p;d.classList.remove(r==='dark'?'light':'dark');d.classList.add(r);d.setAttribute(\"data-theme-preference\",p)})();\u003c/script>\u003cmeta data-mint-head name=\"description\" content=\"Know when BI Publisher reports fail, a server stops or threads get stuck, from the WebLogic and diagnostic logs of every BI Publisher host.\">\u003cmeta data-mint-head name=\"application-name\" content=\"GermainUX Docs\">\u003cmeta data-mint-head name=\"generator\" content=\"Mintlify\">\u003clink data-mint-head rel=\"icon\" type=\"image/png\" sizes=\"192x192\" href=\"/mintlify-assets/_mintlify/favicons/germain-ux/_Kw8Od9IpYFcCZNX/_generated/favicon/android-chrome-192x192.png\" media=\"(prefers-color-scheme: light)\">\u003clink data-mint-head rel=\"apple-touch-icon\" type=\"image/png\" sizes=\"180x180\" href=\"/mintlify-assets/_mintlify/favicons/germain-ux/_Kw8Od9IpYFcCZNX/_generated/favicon/apple-touch-icon.png\">\u003clink data-mint-head rel=\"icon\" type=\"image/png\" sizes=\"16x16\" href=\"/mintlify-assets/_mintlify/favicons/germain-ux/_Kw8Od9IpYFcCZNX/_generated/favicon/favicon-16x16.png\" media=\"(prefers-color-scheme: light)\">\u003clink data-mint-head rel=\"icon\" type=\"image/png\" sizes=\"32x32\" href=\"/mintlify-assets/_mintlify/favicons/germain-ux/_Kw8Od9IpYFcCZNX/_generated/favicon/favicon-32x32.png\" media=\"(prefers-color-scheme: light)\">\u003clink data-mint-head rel=\"shortcut icon\" type=\"image/x-icon\" href=\"/mintlify-assets/_mintlify/favicons/germain-ux/_Kw8Od9IpYFcCZNX/_generated/favicon/favicon.ico\" media=\"(prefers-color-scheme: light)\">\u003clink data-mint-head rel=\"icon\" type=\"image/png\" sizes=\"192x192\" href=\"/mintlify-assets/_mintlify/favicons/germain-ux/_Kw8Od9IpYFcCZNX/_generated/favicon-dark/android-chrome-192x192.png\" media=\"(prefers-color-scheme: dark)\">\u003clink data-mint-head rel=\"icon\" type=\"image/png\" sizes=\"16x16\" href=\"/mintlify-assets/_mintlify/favicons/germain-ux/_Kw8Od9IpYFcCZNX/_generated/favicon-dark/favicon-16x16.png\" media=\"(prefers-color-scheme: dark)\">\u003clink data-mint-head rel=\"icon\" type=\"image/png\" sizes=\"32x32\" href=\"/mintlify-assets/_mintlify/favicons/germain-ux/_Kw8Od9IpYFcCZNX/_generated/favicon-dark/favicon-32x32.png\" media=\"(prefers-color-scheme: dark)\">\u003clink data-mint-head rel=\"shortcut icon\" type=\"image/x-icon\" href=\"/mintlify-assets/_mintlify/favicons/germain-ux/_Kw8Od9IpYFcCZNX/_generated/favicon-dark/favicon.ico\" media=\"(prefers-color-scheme: dark)\">\u003cmeta data-mint-head property=\"og:title\" content=\"Oracle BI Publisher Monitoring - GermainUX Docs\">\u003cmeta data-mint-head property=\"og:description\" content=\"Know when BI Publisher reports fail, a server stops or threads get stuck, from the WebLogic and diagnostic logs of every BI Publisher host.\">\u003cmeta data-mint-head property=\"og:site_name\" content=\"GermainUX Docs\">\u003cmeta data-mint-head property=\"og:url\" content=\"https://docs.germainux.com/integrations/oracle-bi-publisher-monitoring\">\u003cmeta data-mint-head property=\"og:type\" content=\"website\">\u003cmeta data-mint-head property=\"og:image\" content=\"https://germain-ux.mintlify.site/_mintlify/api/og/v2?division=Integrations\u0026amp;title=Oracle+BI+Publisher+Monitoring\u0026amp;description=Know+when+BI+Publisher+reports+fail%2C+a+server+stops+or+threads+get+stuck%2C+from+the+WebLogic+and+diagnostic+logs+of+every+BI+Publisher+host.\u0026amp;theme=f29cc06a49affea3bfdf77b7\u0026amp;signature=09439720f224e14d9c275e024971728fe611eb75af5a63ffcc3d64c4c7a0b6fd\">\u003cmeta data-mint-head property=\"og:image:width\" content=\"1200\">\u003cmeta data-mint-head property=\"og:image:height\" content=\"630\">\u003cmeta data-mint-head name=\"twitter:card\" content=\"summary_large_image\">\u003cmeta data-mint-head name=\"twitter:title\" content=\"Oracle BI Publisher Monitoring - GermainUX Docs\">\u003cmeta data-mint-head name=\"twitter:description\" content=\"Know when BI Publisher reports fail, a server stops or threads get stuck, from the WebLogic and diagnostic logs of every BI Publisher host.\">\u003cmeta data-mint-head name=\"twitter:image\" content=\"https://germain-ux.mintlify.site/_mintlify/api/og/v2?division=Integrations\u0026amp;title=Oracle+BI+Publisher+Monitoring\u0026amp;description=Know+when+BI+Publisher+reports+fail%2C+a+server+stops+or+threads+get+stuck%2C+from+the+WebLogic+and+diagnostic+logs+of+every+BI+Publisher+host.\u0026amp;theme=f29cc06a49affea3bfdf77b7\u0026amp;signature=09439720f224e14d9c275e024971728fe611eb75af5a63ffcc3d64c4c7a0b6fd\">\u003cmeta data-mint-head name=\"twitter:image:width\" content=\"1200\">\u003cmeta data-mint-head name=\"twitter:image:height\" content=\"630\">\u003cmeta data-mint-head name=\"msapplication-config\" content=\"/mintlify-assets/_mintlify/favicons/germain-ux/_Kw8Od9IpYFcCZNX/_generated/favicon/browserconfig.xml\">\u003cmeta data-mint-head name=\"apple-mobile-web-app-title\" content=\"GermainUX Docs\">\u003cmeta data-mint-head name=\"msapplication-TileColor\" content=\"#2E7DF2\">\u003cmeta data-mint-head name=\"og:locale\" content=\"en_US\">\u003clink data-mint-head rel=\"canonical\" href=\"https://docs.germainux.com/integrations/oracle-bi-publisher-monitoring\">\u003clink data-mint-head rel=\"alternate\" type=\"application/xml\" href=\"/sitemap.xml\">\u003clink data-mint-head rel=\"alternate\" type=\"text/markdown\" href=\"/integrations/oracle-bi-publisher-monitoring.md\">\u003cscript data-mint-head type=\"application/ld+json\">{\"@context\":\"https://schema.org\",\"@graph\":[{\"@type\":\"Organization\",\"@id\":\"https://docs.germainux.com/#organization\",\"name\":\"GermainUX Docs\",\"url\":\"https://docs.germainux.com\",\"logo\":{\"@type\":\"ImageObject\",\"url\":\"https://mintcdn.com/germain-ux/ok7-BbqwVV0uk3t8/images/logo-light.png?fit=max\u0026auto=format\u0026n=ok7-BbqwVV0uk3t8\u0026q=85\u0026s=3cfe3238ac55802e43da3e4da5806f0d\"}},{\"@type\":\"WebSite\",\"@id\":\"https://docs.germainux.com#website\",\"name\":\"GermainUX Docs\",\"url\":\"https://docs.germainux.com\",\"publisher\":{\"@id\":\"https://docs.germainux.com/#organization\"}},{\"@type\":\"WebPage\",\"@id\":\"https://docs.germainux.com/integrations/oracle-bi-publisher-monitoring#webpage\",\"url\":\"https://docs.germainux.com/integrations/oracle-bi-publisher-monitoring\",\"name\":\"Oracle BI Publisher Monitoring\",\"description\":\"Know when BI Publisher reports fail, a server stops or threads get stuck, from the WebLogic and diagnostic logs of every BI Publisher host.\",\"dateModified\":\"2026-11-17T10:42:25.441Z\",\"isPartOf\":{\"@id\":\"https://docs.germainux.com#website\"},\"breadcrumb\":{\"@id\":\"https://docs.germainux.com/integrations/oracle-bi-publisher-monitoring#breadcrumb\"}},{\"@type\":\"BreadcrumbList\",\"@id\":\"https://docs.germainux.com/integrations/oracle-bi-publisher-monitoring#breadcrumb\",\"itemListElement\":[{\"@type\":\"ListItem\",\"position\":1,\"name\":\"GermainUX Documentation\",\"item\":\"https://docs.germainux.com\"},{\"@type\":\"ListItem\",\"position\":2,\"name\":\"Integrations\",\"item\":\"https://docs.germainux.com/integrations/monitoring\"},{\"@type\":\"ListItem\",\"position\":3,\"name\":\"Oracle BI Publisher Monitoring\",\"item\":\"https://docs.germainux.com/integrations/oracle-bi-publisher-monitoring\"}]},{\"@type\":[\"Article\",\"TechArticle\"],\"@id\":\"https://docs.germainux.com/integrations/oracle-bi-publisher-monitoring#article\",\"headline\":\"Oracle BI Publisher Monitoring\",\"name\":\"Oracle BI Publisher Monitoring\",\"description\":\"Know when BI Publisher reports fail, a server stops or threads get stuck, from the WebLogic and diagnostic logs of every BI Publisher host.\",\"url\":\"https://docs.germainux.com/integrations/oracle-bi-publisher-monitoring\",\"mainEntityOfPage\":{\"@id\":\"https://docs.germainux.com/integrations/oracle-bi-publisher-monitoring#webpage\"},\"dateModified\":\"2026-11-17T10:42:25.441Z\",\"keywords\":\"Oracle BI Publisher, BI Publisher, BIP, bi_server1, xmlpserver\",\"publisher\":{\"@id\":\"https://docs.germainux.com/#organization\"},\"isPartOf\":{\"@id\":\"https://docs.germainux.com#website\"}}]}\u003c/script>\u003cscript data-mint-head type=\"application/ld+json\">{\"@context\":\"https://schema.org\",\"@type\":\"WebSite\",\"name\":\"GermainUX Docs\",\"publisher\":{\"@type\":\"Organization\",\"name\":\"GermainUX Docs\"},\"provider\":{\"@type\":\"Organization\",\"name\":\"Mintlify\",\"url\":\"https://mintlify.com\"}}\u003c/script>","agentPointerHref":"/integrations/oracle-bi-publisher-monitoring.md","siteName":"GermainUX Docs","nav":{"global":null,"tabs":[{"tab":"Documentation","groups":[{"group":"GermainUX Documentation","pages":[{"title":"GermainUX Documentation","sidebarTitle":"Overview","icon":"book-open","mode":"wide","href":""},{"group":"Getting Started","pages":[{"title":"GermainUX Overview","sidebarTitle":"At a Glance","icon":"flag","href":"/getting-started/germain-ux-getting-started"},{"title":"Overview \u0026 Key Benefits","sidebarTitle":"Overview \u0026 Key Benefits","icon":"lightbulb","href":"/getting-started/key-benefits-features"},{"title":"How GermainUX Works","sidebarTitle":"How GermainUX Works","icon":"diagram-project","href":"/getting-started/strategy-architecture"},{"title":"GermainUX Components","sidebarTitle":"Components","icon":"lightbulb","href":"/getting-started/components"},{"title":"Concepts \u0026 Terminologies","sidebarTitle":"Concepts \u0026 Terminologies","href":"/getting-started/concepts-terminologies"},{"title":"Sizing and Deployment Impact Analysis","sidebarTitle":"Sizing and Deployment Impact Analysis","href":"/getting-started/impact-analysis"},{"title":"Support and Contact","sidebarTitle":"Support and Contact","icon":"headset","href":"/getting-started/support"}]},{"group":"Deploy GermainUX","icon":"rocket","pages":[{"title":"Deploy GermainUX","sidebarTitle":"Overview","icon":"rocket","href":"/deploy/install-on-premise-or-cloud"},{"group":"GermainUX Agent","pages":[{"title":"GermainUX Agent","sidebarTitle":"Overview","icon":"lightbulb","href":"/deploy/germainux-agent/index"},{"title":"Setup \u0026 Configuration","sidebarTitle":"Setup \u0026 Configuration","icon":"rocket","href":"/deploy/germainux-agent/setup-configuration"},{"title":"Agent Installation","sidebarTitle":"Agent Installation","icon":"rocket","href":"/deploy/germainux-agent/agent-installation"},{"title":"Agent Settings(Registry)","sidebarTitle":"Agent Settings(Registry)","href":"/deploy/germainux-agent/agent-settings-registry"},{"title":"Monitoring Config Reference","sidebarTitle":"Monitoring Config Reference","icon":"lightbulb","href":"/deploy/germainux-agent/monitoring-config-reference"}]},{"title":"GermainUX Enterprise On Cloud","sidebarTitle":"GermainUX-Enterprise - On Cloud","icon":"lightbulb","href":"/deploy/deployment-on-our-cloud"},{"group":"GermainUX Enterprise On Premise","pages":[{"title":"GermainUX Enterprise On Premise","sidebarTitle":"Overview","icon":"lightbulb","href":"/deploy/deployment-on-premise/index"},{"group":"Requirements","pages":[{"title":"Requirements","sidebarTitle":"Overview","icon":"book","href":"/deploy/deployment-on-premise/requirements"},{"title":"Hardware Requirements","sidebarTitle":"Hardware Requirements","icon":"book","href":"/deploy/deployment-on-premise/hardware-requirements"},{"title":"Network Requirements","sidebarTitle":"Network Requirements","href":"/deploy/deployment-on-premise/network-requirements"},{"title":"Software Requirements","sidebarTitle":"Software Requirements","href":"/deploy/deployment-on-premise/software-requirements"},{"group":"Storage Requirements","pages":[{"title":"Storage Requirements","sidebarTitle":"Overview","icon":"book","href":"/deploy/deployment-on-premise/storage-requirements"},{"title":"Datastore Recommendation and Benchmark","sidebarTitle":"Datastore Recommendation and Benchmark","icon":"lightbulb","href":"/deploy/deployment-on-premise/datastore-which-to-choose"}]}]},{"title":"Package and License","sidebarTitle":"Package and License","icon":"lightbulb","href":"/deploy/deployment-on-premise/prerequisites"},{"group":"Installation","pages":[{"title":"Installation","sidebarTitle":"Overview","icon":"rocket","href":"/deploy/deployment-on-premise/installation"},{"title":"Quick Start Setup","sidebarTitle":"Quick Start Setup","icon":"rocket","href":"/deploy/deployment-on-premise/quick-start-setup"},{"group":"GermainUX Datastore","pages":[{"title":"GermainUX Datastore","sidebarTitle":"Overview","icon":"lightbulb","href":"/deploy/deployment-on-premise/germain-ux-datastore"},{"group":"Elasticsearch On Premise (Preferred)","pages":[{"title":"Elasticsearch On Premise (Preferred)","sidebarTitle":"Overview","icon":"lightbulb","href":"/deploy/deployment-on-premise/elasticsearch-database-preferred"},{"title":"Secure Elasticsearch and Kibana","sidebarTitle":"Secure Elasticsearch and Kibana","icon":"lightbulb","href":"/deploy/deployment-on-premise/securing-elastic-search-and-kibana"}]},{"title":"Elasticsearch On Cloud","sidebarTitle":"Elasticsearch - On Cloud","icon":"lightbulb","href":"/deploy/deployment-on-premise/elasticsearch-saas"},{"title":"MySQL Database Setup","sidebarTitle":"MySQL Database Setup","icon":"rocket","href":"/deploy/deployment-on-premise/mysql-database"},{"group":"Oracle Database Setup","pages":[{"title":"Oracle Database Setup","sidebarTitle":"Overview","icon":"rocket","href":"/deploy/deployment-on-premise/oracle-database"},{"title":"Oracle Database Troubleshooting","sidebarTitle":"Troubleshooting","icon":"wrench","href":"/deploy/deployment-on-premise/oracle-database-troubleshooting"}]},{"title":"PostgreSQL Database Setup","sidebarTitle":"PostgreSQL Database Setup","icon":"rocket","href":"/deploy/deployment-on-premise/postgresql-database"},{"title":"Other Databases","sidebarTitle":"Other Databases","icon":"lightbulb","href":"/deploy/deployment-on-premise/other-databases"}]},{"group":"GermainUX Enterprise (on Tomcat)","pages":[{"title":"GermainUX Enterprise (on Tomcat)","sidebarTitle":"Overview","icon":"lightbulb","href":"/deploy/deployment-on-premise/germain-ux-enterprise-on-tomcat"},{"group":"Apache ActiveMQ Setup","pages":[{"title":"Apache ActiveMQ Setup","sidebarTitle":"Overview","icon":"rocket","href":"/deploy/deployment-on-premise/apache-activemq-setup"},{"title":"Apache ActiveMQ Troubleshooting","sidebarTitle":"Apache ActiveMQ Troubleshooting","icon":"wrench","href":"/deploy/deployment-on-premise/apache-activemq-troubleshooting"}]},{"title":"Apache Kafka Setup","sidebarTitle":"Apache Kafka Setup","icon":"rocket","href":"/deploy/deployment-on-premise/apache-kafka-setup"},{"title":"Hazelcast Setup","sidebarTitle":"Hazelcast Setup","href":"/deploy/deployment-on-premise/hazelcast-setup"},{"title":"ZooKeeper Setup","sidebarTitle":"ZooKeeper Setup","href":"/deploy/deployment-on-premise/zookeeper-setup"},{"title":"GermainUX Services","sidebarTitle":"GermainUX Services","icon":"lightbulb","href":"/deploy/deployment-on-premise/germain-ux-services"},{"title":"GermainUX Init Configuration","sidebarTitle":"GermainUX Init Configuration","icon":"lightbulb","href":"/deploy/deployment-on-premise/germain-ux-init-configuration"},{"title":"GermainUX Enterprise Troubleshooting","sidebarTitle":"Troubleshooting","icon":"wrench","href":"/deploy/deployment-on-premise/germain-enterprise-troubleshooting"}]},{"title":"Kubernetes Setup","sidebarTitle":"Kubernetes Setup","icon":"rocket","href":"/deploy/deployment-on-premise/kubernetes-setup"},{"title":"OpenShift Setup","sidebarTitle":"OpenShift Setup","href":"/deploy/deployment-on-premise/openshift-setup"},{"title":"Validate Customizations","sidebarTitle":"Validate Customizations","icon":"lightbulb","href":"/deploy/deployment-on-premise/customizations"},{"title":"Sentinel: GermainUX Self-Monitoring","sidebarTitle":"Sentinel: GermainUX Self-Monitoring","icon":"lightbulb","href":"/deploy/deployment-on-premise/sentinel"}]}]},{"group":"GermainUX Engine","pages":[{"title":"GermainUX Engine","sidebarTitle":"Overview","icon":"lightbulb","href":"/deploy/germain-ux-engine/index"},{"group":"Engine Deployment","pages":[{"title":"Engine Deployment","sidebarTitle":"Overview","icon":"rocket","href":"/deploy/germain-ux-engine/engine-deployment"},{"title":"Deploy at Scale","sidebarTitle":"Deploy at Scale","icon":"rocket","href":"/deploy/germain-ux-engine/deploy-at-scale-using-profiles"}]},{"group":"Engine Configuration","pages":[{"title":"Engine Configuration","sidebarTitle":"Overview","icon":"lightbulb","href":"/deploy/germain-ux-engine/engine-configuration"},{"title":"Engine Memory Configuration","sidebarTitle":"Engine Memory Configuration","icon":"lightbulb","href":"/deploy/germain-ux-engine/engine-memory-configuration"},{"title":"Engine Proxy Configuration","sidebarTitle":"Engine Proxy Configuration","icon":"lightbulb","href":"/deploy/germain-ux-engine/engine-proxy-configuration"}]}]},{"title":"GermainUX Mobile App","sidebarTitle":"GermainUX-Mobile App","icon":"lightbulb","href":"/deploy/germain-ux-mobile-app"},{"title":"GermainUX Code Profiler","sidebarTitle":"GermainUX-Code Profiler","icon":"lightbulb","href":"/deploy/germain-ux-code-profiler"},{"title":"GermainUX JS Profiler","sidebarTitle":"GermainUX-JS Profiler","icon":"lightbulb","href":"/deploy/germain-ux-js-profiler"},{"title":"GermainUX RPA Bot Recorder","sidebarTitle":"GermainUX-RPA Bot Recorder","icon":"lightbulb","href":"/deploy/germain-ux-rpa-bot-recorder"},{"title":"GermainUX RUM Extension","sidebarTitle":"GermainUX-RUM Extension","icon":"lightbulb","href":"/deploy/germain-ux-rum-extension"},{"group":"GermainUX RUM JS","pages":[{"title":"GermainUX RUM JS","sidebarTitle":"Overview","icon":"lightbulb","href":"/deploy/germain-ux-rum-js/index"},{"title":"Deploy RUM JS (Google Tag Manager)","sidebarTitle":"Deploy RUM JS (Google Tag Manager)","icon":"rocket","href":"/deploy/germain-ux-rum-js/deploy-rum-js-google-tag-manager"}]},{"title":"GermainUX RUM Windows","sidebarTitle":"GermainUX-RUM Windows","icon":"lightbulb","href":"/deploy/germainux-rum-windows"}]},{"group":"Analytics","icon":"chart-simple","pages":[{"title":"Analytics","sidebarTitle":"Overview","icon":"chart-simple","href":"/analytics/index"},{"title":"Adoption Insights","sidebarTitle":"Adoption Insights","icon":"lightbulb","href":"/analytics/adoption-insights"},{"group":"AI Insights \u0026 Recommendations","pages":[{"title":"AI Insights \u0026 Recommendations","sidebarTitle":"Overview","icon":"lightbulb","href":"/analytics/ai-driven-insights/index"},{"title":"Configure AI Services \u0026 Prompts","sidebarTitle":"Configure AI Services \u0026 Prompts","icon":"list-check","href":"/analytics/ai-driven-insights/configure-ai-services-prompts"}]},{"title":"Averages vs Percentiles","sidebarTitle":"Averages vs Percentiles","icon":"lightbulb","href":"/analytics/averages-vs-percentiles"},{"title":"Impact at Scale for Any Issue","sidebarTitle":"Impact at Scale for Any Issue","icon":"lightbulb","href":"/analytics/business-impact-at-scale-for-any-issue"},{"title":"Behavior Analysis","sidebarTitle":"Behavior Analysis","icon":"lightbulb","href":"/analytics/behavior-analysis"},{"group":"Business Process and Workflow Mining","pages":[{"title":"Business Process and Workflow Mining","sidebarTitle":"Overview","icon":"lightbulb","href":"/analytics/business-process-workflow-monitoring/index"},{"title":"Configure a Business Process or Workflow","sidebarTitle":"Configure a Business Process or Workflow","icon":"list-check","href":"/analytics/business-process-workflow-monitoring/configure-a-business-process"}]},{"group":"Campaign","pages":[{"title":"Campaign","sidebarTitle":"Overview","icon":"lightbulb","href":"/analytics/marketing-campaign-monitoring/index"},{"title":"Configure Campaign Monitoring","sidebarTitle":"Configure Campaign Monitoring","icon":"list-check","href":"/analytics/marketing-campaign-monitoring/configure-campaign-monitoring"}]},{"group":"Categorization","pages":[{"title":"Categorization","sidebarTitle":"Overview","icon":"lightbulb","href":"/analytics/data-categorization/index"},{"title":"Configure Categorization","sidebarTitle":"Configure Categorization","icon":"list-check","href":"/analytics/data-categorization/configure-categorization"}]},{"title":"Code Profiling","sidebarTitle":"Code Profiling","icon":"lightbulb","href":"/analytics/code-profiling"},{"title":"Chat Analysis","sidebarTitle":"Chat Analysis","icon":"lightbulb","href":"/analytics/conversation-analysis"},{"title":"Conversion Insights","sidebarTitle":"Conversion Insights","icon":"lightbulb","href":"/analytics/conversion-analysis"},{"title":"Document Audit","sidebarTitle":"Document Audit","icon":"lightbulb","href":"/analytics/document-audit"},{"title":"Drop-Offs","sidebarTitle":"Drop-Offs","icon":"lightbulb","href":"/analytics/drop-offs"},{"group":"Error Analysis","pages":[{"title":"Error Analysis","sidebarTitle":"Overview","icon":"lightbulb","href":"/analytics/errors-analysis-ai-powered/index"},{"title":"Configure User Error Monitoring","sidebarTitle":"Configure User Error Monitoring","icon":"list-check","href":"/analytics/errors-analysis-ai-powered/configure-user-error-monitoring"}]},{"title":"Heatmaps","sidebarTitle":"Heatmaps","icon":"lightbulb","href":"/analytics/heatmaps"},{"title":"Insights (Automate Your Own)","sidebarTitle":"Insights (Automate Your Own)","icon":"lightbulb","href":"/analytics/custom-insights"},{"title":"Insights (Automated \u0026 Preconfigured)","sidebarTitle":"Insights (Automated \u0026 Preconfigured)","icon":"lightbulb","href":"/analytics/insights-to-boost-ux"},{"title":"Journey","sidebarTitle":"Journey","icon":"lightbulb","href":"/analytics/customer-journey"},{"group":"KPIs, Pivots \u0026 Measures","pages":[{"title":"AI KPIs, Pivots, Measures","sidebarTitle":"AI KPIs, Pivots, Measures","icon":"brain","href":"/analytics/kpis/ai-kpis-pivots-measures"},{"title":"KPIs, Pivots \u0026 Measures","sidebarTitle":"Overview","icon":"gauge","href":"/analytics/kpis/index"},{"title":"Business Process/Workflow KPIs, Pivots \u0026 Measures","sidebarTitle":"Business Process/Workflow KPIs, Pivots \u0026 Measures","icon":"gauge","href":"/analytics/kpis/kpis-business-process"},{"title":"Marketing KPIs, Pivots \u0026 Measures","sidebarTitle":"Marketing KPIs, Pivots \u0026 Measures","icon":"gauge","href":"/analytics/kpis/marketing-kpis-pivots-measures"},{"title":"Technologies KPIs, Pivots \u0026 Measures","sidebarTitle":"Technologies KPIs, Pivots \u0026 Measures","href":"/analytics/kpis/kpis-technologies-availability-performance-mobile"},{"title":"User Experience KPIs, Pivots \u0026 Measures","sidebarTitle":"User Experience KPIs, Pivots \u0026 Measures","href":"/analytics/kpis/kpis-user-monitoring-and-replay"},{"title":"Web Analytics KPIs, Pivots \u0026 Measures","sidebarTitle":"Web Analytics KPIs, Pivots \u0026 Measures","icon":"gauge","href":"/analytics/kpis/kpis-web-analytics"},{"title":"Display Name for KPIs, Pivots \u0026 Measures","sidebarTitle":"Display Name for KPIs, Pivots \u0026 Measures","icon":"gauge","href":"/analytics/kpis/display-name-for-kpi-field"},{"title":"KPI Relationships","sidebarTitle":"KPI Relationships","icon":"gauge","href":"/analytics/kpis/kpi-relationships"}]},{"title":"Outlier and Anomaly Detection","sidebarTitle":"Outlier and Anomaly Detection","icon":"lightbulb","href":"/analytics/outlier-detection"},{"title":"Preconfigured Analytics by Technology","sidebarTitle":"Preconfigured Analytics by Technology","href":"/analytics/plugins-that-use-these-analytics-features"},{"group":"Rules: Advanced Automated Analytics","pages":[{"title":"Rules: Advanced Automated Analytics","sidebarTitle":"Overview","icon":"lightbulb","href":"/analytics/rules-advanced-automated-analytics/index"},{"title":"Configure a Rule for Advanced Analytics","sidebarTitle":"Configure a Rule for Advanced Analytics","icon":"list-check","href":"/analytics/rules-advanced-automated-analytics/configure-a-rule-for-advanced-analytics"}]},{"title":"Sentiment Analysis","sidebarTitle":"Sentiment Analysis","icon":"lightbulb","href":"/analytics/sentiment-analysis-ai-driven"},{"group":"SLAs","pages":[{"title":"SLAs","sidebarTitle":"Overview","icon":"lightbulb","href":"/analytics/slas/index"},{"title":"Configure SLA","sidebarTitle":"Configure SLA","icon":"list-check","href":"/analytics/slas/configure-sla"}]},{"title":"SQL Query","sidebarTitle":"SQL Query","icon":"lightbulb","href":"/analytics/query-monitoring"},{"title":"Story Beat","sidebarTitle":"Story Beat","icon":"lightbulb","href":"/analytics/story-beat"},{"title":"Transaction Insights","sidebarTitle":"Transaction Insights","icon":"lightbulb","href":"/analytics/transaction-insights"},{"title":"User Role Lookup","sidebarTitle":"User Role Lookup","href":"/analytics/user-role-lookup"},{"group":"User Session Monitoring, Replay \u0026 6 Heatmaps","pages":[{"title":"User Session Monitoring, Replay \u0026 6 Heatmaps","sidebarTitle":"Overview","icon":"lightbulb","href":"/analytics/user-monitoring-and-replay/index"},{"title":"Deploy User Monitoring and Session Replay","sidebarTitle":"Deploy User Monitoring and Session Replay","icon":"rocket","href":"/analytics/user-monitoring-and-replay/user-monitoring-and-replay-deployment"},{"title":"Configure User Monitoring and Session Replay","sidebarTitle":"Configure User Monitoring and Session Replay","icon":"list-check","href":"/analytics/user-monitoring-and-replay/user-monitoring-and-replay-configuration"},{"group":"Session Replay Player","pages":[{"title":"Session Replay Player","sidebarTitle":"Overview","icon":"lightbulb","href":"/analytics/user-monitoring-and-replay/session-replay-player"},{"title":"Configure Session Replay Player","sidebarTitle":"Configure Session Replay Player","icon":"list-check","href":"/analytics/user-monitoring-and-replay/configure-session-replay-player"}]},{"title":"KPIs for User Monitoring and Session Replay","sidebarTitle":"KPIs for User Monitoring and Session Replay","icon":"gauge","href":"/analytics/user-monitoring-and-replay/user-monitoring-and-replay-kpis"},{"title":"APIs for User Monitoring and Session Replay","sidebarTitle":"APIs for User Monitoring and Session Replay","icon":"code","href":"/analytics/user-monitoring-and-replay/user-monitoring-and-replay-apis"}]},{"title":"Work Time Insights","sidebarTitle":"Work Time Insights","icon":"lightbulb","href":"/analytics/work-time-insights"},{"title":"Root-Cause Analysis","sidebarTitle":"Root-Cause Analysis","href":"/analytics/root-cause-analysis"}]},{"group":"Action","icon":"robot","pages":[{"title":"Automation","sidebarTitle":"Overview","icon":"robot","href":"/automation/index"},{"group":"Automated Actions","pages":[{"title":"Automated Actions","sidebarTitle":"Overview","icon":"lightbulb","href":"/automation/automated-actions/index"},{"title":"Configure AI Services \u0026 Prompts (Automated Actions)","sidebarTitle":"Configure AI Services \u0026 Prompts (Automated Actions)","icon":"list-check","href":"/automation/automated-actions/configure-ai-services-prompts-automated-actions"},{"title":"Scheduling of an Action","sidebarTitle":"Scheduling of an Action","icon":"lightbulb","href":"/automation/automated-actions/component-scheduling"}]},{"group":"Correlation or Tracing","pages":[{"title":"Correlation or Tracing","sidebarTitle":"Overview","icon":"lightbulb","href":"/analytics/correlation-and-tracing/index"},{"title":"Exact-Match Correlation","sidebarTitle":"Exact-Match Correlation","icon":"lightbulb","href":"/analytics/correlation-and-tracing/exact-match-correlation"},{"title":"Id-Based Correlation","sidebarTitle":"Id-Based Correlation","icon":"lightbulb","href":"/analytics/correlation-and-tracing/id-based-correlation"},{"title":"Stream Correlation","sidebarTitle":"Stream Correlation","icon":"lightbulb","href":"/analytics/correlation-and-tracing/stream-correlation"}]},{"title":"File Archiving","sidebarTitle":"File Archiving","icon":"lightbulb","href":"/automation/file-archiving"},{"title":"File Deletion/Purge","sidebarTitle":"File Deletion/Purge","icon":"lightbulb","href":"/automation/automatic-delete-purge-of-files"},{"title":"File Download","sidebarTitle":"File Download","icon":"lightbulb","href":"/automation/file-download"},{"group":"HTTP and HTTPS Execution","pages":[{"title":"HTTP and HTTPS Execution","sidebarTitle":"Overview","icon":"lightbulb","href":"/automation/synthetic-http-execution/index"},{"title":".Har File (Import/Export)","sidebarTitle":".Har File (Import/Export)","icon":"lightbulb","href":"/automation/synthetic-http-execution/har-file-import-export"},{"title":"Configure Execution of Http Request","sidebarTitle":"Configure Execution of Http Request","icon":"list-check","href":"/automation/synthetic-http-execution/configure-execution-of-http-request"}]},{"title":"Log File Analysis","sidebarTitle":"Log File Analysis","icon":"file-lines","href":"/automation/log-file-analysis"},{"title":"Log Level Auto-Setting","sidebarTitle":"Log Level Auto-Setting","icon":"lightbulb","href":"/automation/log-level-auto-setting"},{"title":"Monitoring","sidebarTitle":"Monitoring","icon":"lightbulb","href":"/automation/monitoring"},{"title":"Moogsoft","sidebarTitle":"Moogsoft","icon":"lightbulb","href":"/automation/moogsoft"},{"group":"Notifications","pages":[{"title":"Notifications","sidebarTitle":"Overview","icon":"lightbulb","href":"/automation/notifications/index"},{"group":"Alert (email and sms)","pages":[{"title":"Alert (Email and Sms)","sidebarTitle":"Overview","icon":"lightbulb","href":"/automation/notifications/alert-email-and-sms"},{"title":"Create an Alert","sidebarTitle":"Create an Alert","icon":"list-check","href":"/automation/notifications/create-an-alert"}]},{"title":"Quiet Times","sidebarTitle":"Quiet Times","icon":"lightbulb","href":"/automation/notifications/quiet-times"},{"title":"Microsoft Teams Notification","sidebarTitle":"Microsoft Teams","icon":"lightbulb","href":"/automation/notifications/microsoft-teams-notification"},{"title":"Slack","sidebarTitle":"Slack","icon":"lightbulb","href":"/automation/notifications/slack"},{"title":"Watch \u0026 Be Notified","sidebarTitle":"Watch \u0026 Be Notified","icon":"lightbulb","href":"/automation/notifications/watch"}]},{"title":"Plugins (That Use These Automation Features)","sidebarTitle":"Plugins (That Use These Automation Features)","href":"/automation/plugins-that-use-these-automation-features"},{"title":"Program Execution (RPA Bots)","sidebarTitle":"Program Execution (RPA Bots)","icon":"lightbulb","href":"/automation/local-program-execution"},{"group":"Reports (Automatic, Scheduled)","pages":[{"title":"Reports (Automatic, Scheduled)","sidebarTitle":"Overview","icon":"lightbulb","href":"/automation/notifications/reporting-automatic"},{"title":"Create a Report","sidebarTitle":"Create a Report","icon":"list-check","href":"/automation/notifications/create-a-automatic-report"}]},{"group":"Rules: Advanced Automation","pages":[{"title":"Rules: Advanced Automation","sidebarTitle":"Overview","icon":"lightbulb","href":"/automation/rules/index"},{"title":"Create a Rule for Advanced Automation","sidebarTitle":"Create a Rule for Advanced Automation","icon":"list-check","href":"/automation/rules/create-a-rule-for-advanced-automation"}]},{"group":"Script Execution","pages":[{"title":"Script Execution","sidebarTitle":"Overview","icon":"lightbulb","href":"/automation/script/index"},{"title":"Configure Script Execution","sidebarTitle":"Configure Script Execution","icon":"list-check","href":"/automation/script/configure-script-execution"}]},{"title":"ServiceNow","sidebarTitle":"ServiceNow","icon":"lightbulb","href":"/automation/servicenow"},{"title":"SQL Execution","sidebarTitle":"SQL Execution","icon":"lightbulb","href":"/automation/sql-execution"},{"title":"SSH Execution","sidebarTitle":"SSH Execution","icon":"lightbulb","href":"/automation/ssh-execution"},{"group":"Synthetic/User Click Scenario","pages":[{"title":"Synthetic/User Click Scenario","sidebarTitle":"Overview","icon":"lightbulb","href":"/automation/user-click-synthetic-user-scenario/index"},{"title":"Record a Synthetic Scenario","sidebarTitle":"Record a Synthetic Scenario","icon":"list-check","href":"/automation/user-click-synthetic-user-scenario/record-a-synthetic-scenario"},{"title":"Configure a Synthetic Scenario","sidebarTitle":"Configure a Synthetic Scenario","icon":"list-check","href":"/automation/user-click-synthetic-user-scenario/configure-a-synthetic-scenario"},{"title":"Deploy Synthetic Scenario","sidebarTitle":"Deploy Synthetic Scenario","icon":"rocket","href":"/automation/user-click-synthetic-user-scenario/deploy-synthetic-scenario"},{"title":"Troubleshoot Synthetic Scenario","sidebarTitle":"Troubleshoot Synthetic Scenario","href":"/automation/user-click-synthetic-user-scenario/troubleshoot-synthetic-scenario"},{"title":"Monitor a Synthetic Scenario","sidebarTitle":"Monitor a Synthetic Scenario","icon":"list-check","href":"/automation/user-click-synthetic-user-scenario/monitor-a-synthetic-scenario"}]},{"group":"User Feedback","pages":[{"title":"User Feedback","sidebarTitle":"Overview","icon":"lightbulb","href":"/automation/user-feedback/index"},{"title":"Configure User Feedback","sidebarTitle":"Configure User Feedback","icon":"list-check","href":"/automation/user-feedback/configure-user-feedback"}]},{"title":"Web Driver Auto-Update","sidebarTitle":"Web Driver Auto-Update","icon":"lightbulb","href":"/automation/browser-auto-update"},{"title":"Website Audit and SEO","sidebarTitle":"Website Audit and SEO","icon":"lightbulb","href":"/automation/website-audit-seo"},{"title":"Website Crawler","sidebarTitle":"Website Crawler","icon":"lightbulb","href":"/automation/crawler"},{"title":"WMI Execution","sidebarTitle":"WMI Execution","icon":"lightbulb","href":"/automation/wmi-execution"}]},{"group":"Integrations","icon":"plug","pages":[{"title":"Integrations","sidebarTitle":"Overview","icon":"plug","href":"/integrations/monitoring"},{"group":".NET Operational Experience Intelligence","pages":[{"title":".NET Operational Experience Intelligence","sidebarTitle":"Overview","icon":"plug","href":"/integrations/net-monitoring/index"},{"title":"Deploy and Configure Monitoring for .NET","sidebarTitle":"Deploy and Configure Monitoring for .NET","icon":"rocket","href":"/integrations/net-monitoring/deploy-and-configure-monitoring-for-net"},{"title":"KPIs for .NET Monitoring, Automation \u0026 Session Replay","sidebarTitle":"KPIs for .NET Monitoring, Automation \u0026 Session Replay","icon":"gauge","href":"/integrations/net-monitoring/kpis-for-net-monitoring-automation-session-replay"}]},{"title":"ActiveMQ Observability","sidebarTitle":"ActiveMQ Observability","icon":"plug","href":"/integrations/apache-activemq-monitoring"},{"title":"Apache HTTP Server Monitoring","sidebarTitle":"Apache HTTP Server Observability","icon":"plug","href":"/integrations/apache-http-server-monitoring"},{"title":"AIX Observability","sidebarTitle":"AIX Observability","icon":"plug","href":"/integrations/aix-monitoring"},{"group":"Amazon EC2 Observability","pages":[{"title":"Amazon EC2 Observability","sidebarTitle":"Overview","icon":"plug","href":"/integrations/amazon-ec2-observability/index"},{"title":"Configure Monitoring for Amazon EC2","sidebarTitle":"Configure Monitoring for Amazon EC2","icon":"list-check","href":"/integrations/amazon-ec2-observability/amazon-ec2-monitoring-configuration"}]},{"title":"Amazon Web Services Monitoring","sidebarTitle":"AWS Inspector, RDS and SES Observability","icon":"plug","href":"/integrations/aws-monitoring"},{"group":"Android Application Observability","pages":[{"title":"Android Application Observability","sidebarTitle":"Overview","icon":"plug","href":"/integrations/android-application-observability/index"},{"title":"Deploy Monitoring for Android App","sidebarTitle":"Deploy Monitoring for Android App","icon":"rocket","href":"/integrations/android-application-observability/android-app-monitoring-deployment"},{"group":"Configure Monitoring for Android App","pages":[{"title":"Configure Monitoring for Android App","sidebarTitle":"Overview","icon":"list-check","href":"/integrations/android-application-observability/android-app-monitoring-configuration"},{"title":"Error and Exception Monitoring for Android App","sidebarTitle":"Error and Exception Monitoring for Android App","icon":"lightbulb","href":"/integrations/android-application-observability/android-app-error-and-exception-monitoring"},{"title":"Event Monitoring for Android App","sidebarTitle":"Event Monitoring for Android App","icon":"lightbulb","href":"/integrations/android-application-observability/android-app-event-monitoring"},{"title":"Session Monitoring for Android App","sidebarTitle":"Session Monitoring for Android App","icon":"lightbulb","href":"/integrations/android-application-observability/android-app-session-monitoring"},{"title":"Transaction Monitoring for Android App","sidebarTitle":"Transaction Monitoring for Android App","icon":"lightbulb","href":"/integrations/android-application-observability/android-app-transaction-monitoring"},{"title":"Fragment and View Monitoring for Android App","sidebarTitle":"Fragment and View Monitoring for Android App","icon":"lightbulb","href":"/integrations/android-application-observability/android-app-fragment-and-view-monitoring"}]},{"title":"KPIs for Android App Monitoring","sidebarTitle":"KPIs for Android App Monitoring","icon":"gauge","href":"/integrations/android-application-observability/android-app-monitoring-kpis"}]},{"title":"Android Device Observability","sidebarTitle":"Android Device Observability","icon":"plug","href":"/integrations/android-mobile-device-monitoring"},{"group":"Angular Operational Experience Intelligence","pages":[{"title":"Angular Operational Experience Intelligence","sidebarTitle":"Overview","icon":"plug","href":"/integrations/angular-monitoring/index"},{"title":"Deploy Monitoring for Angular","sidebarTitle":"Deploy Monitoring for Angular","icon":"rocket","href":"/integrations/angular-monitoring/deploy-monitoring-for-angular"}]},{"group":"BigCommerce Operational Experience Intelligence","pages":[{"title":"BigCommerce Operational Experience Intelligence","sidebarTitle":"Overview","icon":"plug","href":"/integrations/bigcommerce-monitoring/index"},{"title":"Deploy Monitoring for BigCommerce","sidebarTitle":"Deploy Monitoring for BigCommerce","icon":"rocket","href":"/integrations/bigcommerce-monitoring/deploy-monitoring-for-bigcommerce"}]},{"group":"BigPanda Incident Intelligence","pages":[{"title":"BigPanda Incident Intelligence","sidebarTitle":"Overview","icon":"plug","href":"/integrations/bigpanda-incident-intelligence/index"},{"title":"Deploy Incident Intelligence for BigPanda","sidebarTitle":"Deploy Incident Intelligence for BigPanda","icon":"rocket","href":"/integrations/bigpanda-incident-intelligence/deploy-incident-intelligence-for-bigpanda"}]},{"group":"Browser Observability","pages":[{"title":"Browser Observability","sidebarTitle":"Overview","icon":"plug","href":"/integrations/browser-monitoring/index"},{"title":"Deploy Monitoring for Browsers","sidebarTitle":"Deploy Monitoring for Browsers","href":"/integrations/browser-monitoring/deployment-for-browser-monitoring"},{"group":"Configure Monitoring for Browsers","pages":[{"title":"Configure Monitoring for Browsers","sidebarTitle":"Overview","icon":"list-check","href":"/integrations/browser-monitoring/configuration-for-browser-monitoring"},{"title":"Battery Level Monitoring","sidebarTitle":"Battery Level Monitoring","icon":"lightbulb","href":"/integrations/browser-monitoring/battery-level-monitoring"},{"title":"Browser Crash Monitoring","sidebarTitle":"Browser Crash Monitoring","icon":"lightbulb","href":"/integrations/browser-monitoring/browser-crash-monitoring"},{"title":"Browser Deprecated Features and Policy Violations Monitoring","sidebarTitle":"Browser Deprecated Features and Policy Violations Monitoring","icon":"lightbulb","href":"/integrations/browser-monitoring/deprecated-features-and-policy-violations-monitoring"},{"title":"Chat/CTI Monitoring","sidebarTitle":"Chat/CTI Monitoring","icon":"lightbulb","href":"/integrations/browser-monitoring/chat-cti-monitoring"},{"title":"Core Web Vitals","sidebarTitle":"Core Web Vitals","icon":"lightbulb","href":"/integrations/browser-monitoring/core-web-vitals"},{"title":"Dead, Error and Rage Click Monitoring","sidebarTitle":"Dead, Error and Rage Click Monitoring","icon":"lightbulb","href":"/integrations/browser-monitoring/dead-error-and-rage-click-monitoring"},{"title":"Element and Mark Performance Monitoring","sidebarTitle":"Element and Mark Performance Monitoring","icon":"lightbulb","href":"/integrations/browser-monitoring/element-and-mark-performance-monitoring"},{"title":"JavaScript and Page Memory Monitoring","sidebarTitle":"JavaScript and Page Memory Monitoring","icon":"lightbulb","href":"/integrations/browser-monitoring/javascript-and-page-memory-monitoring"},{"title":"JavaScript Console and Error Monitoring","sidebarTitle":"JavaScript Console and Error Monitoring","icon":"lightbulb","href":"/integrations/browser-monitoring/javascript-console-and-error-monitoring"},{"title":"JavaScript Long Task or Browser Freeze Detection Configuration","sidebarTitle":"JavaScript Long Task or Browser Freeze Detection Configuration","icon":"lightbulb","href":"/integrations/browser-monitoring/javascript-long-task-monitoring"},{"title":"Metadata Extractors","sidebarTitle":"Metadata Extractors","icon":"lightbulb","href":"/integrations/browser-monitoring/metadata-extractors"},{"title":"Network Requests Monitoring","sidebarTitle":"Network Requests Monitoring","icon":"lightbulb","href":"/integrations/browser-monitoring/network-requests-monitoring"},{"title":"Popup Dialog Monitoring","sidebarTitle":"Popup Dialog Monitoring","icon":"lightbulb","href":"/integrations/browser-monitoring/popup-dialog-monitoring"},{"title":"Server Timing Monitoring","sidebarTitle":"Server Timing Monitoring","icon":"lightbulb","href":"/integrations/browser-monitoring/server-timing-monitoring"},{"title":"Unhandled Promise Rejection Monitoring","sidebarTitle":"Unhandled Promise Rejection Monitoring","icon":"lightbulb","href":"/integrations/browser-monitoring/unhandled-promise-rejection-monitoring"},{"title":"Video Monitoring (Vimeo, ...)","sidebarTitle":"Video Monitoring (Vimeo, ...)","icon":"lightbulb","href":"/integrations/browser-monitoring/video-monitoring-vimeo"},{"title":"WebMCP Monitoring","sidebarTitle":"WebMCP Monitoring","icon":"lightbulb","href":"/integrations/browser-monitoring/webmcp-monitoring"},{"title":"WebSocket Monitoring","sidebarTitle":"WebSocket Monitoring","icon":"lightbulb","href":"/integrations/browser-monitoring/websocket-monitoring"}]},{"title":"KPIs for Browser Monitoring","sidebarTitle":"KPIs for Browser Monitoring","icon":"gauge","href":"/integrations/browser-monitoring/kpis-for-browser-monitoring"},{"title":"APIs for Browser Monitoring","sidebarTitle":"APIs for Browser Monitoring","icon":"code","href":"/integrations/browser-monitoring/apis-for-browser-monitoring"}]},{"title":"Channel Talk Observability","sidebarTitle":"Channel Talk Observability","icon":"plug","href":"/integrations/channel-talk-monitoring"},{"title":"Chatbot Observability","sidebarTitle":"Chatbot Observability","icon":"plug","href":"/integrations/chat-monitoring"},{"title":"Citrix Observability","sidebarTitle":"Citrix Observability","icon":"plug","href":"/integrations/citrix-user-monitoring"},{"title":"DB2 UDB Observability","sidebarTitle":"DB2 UDB Observability","icon":"plug","href":"/integrations/db2-udb-monitoring"},{"group":"Docker Observability","pages":[{"title":"Docker Observability","sidebarTitle":"Overview","icon":"plug","href":"/integrations/docker-monitoring/index"},{"title":"Deploy Monitoring for Docker","sidebarTitle":"Deploy Monitoring for Docker","icon":"rocket","href":"/integrations/docker-monitoring/deploy-monitoring-for-docker"}]},{"group":"Drupal Operational Experience Intelligence","pages":[{"title":"Drupal Operational Experience Intelligence","sidebarTitle":"Overview","icon":"plug","href":"/integrations/drupal-monitoring/index"},{"title":"Deploy Monitoring for Drupal","sidebarTitle":"Deploy Monitoring for Drupal","icon":"rocket","href":"/integrations/drupal-monitoring/deploy-monitoring-for-drupal"}]},{"title":"Elasticsearch Monitoring","sidebarTitle":"Elasticsearch Observability","icon":"plug","href":"/integrations/elasticsearch-monitoring"},{"title":"Files / Logs Observability","sidebarTitle":"Files / Logs Observability","icon":"plug","href":"/integrations/file-log-monitoring"},{"title":"Genesys Cloud Observability","sidebarTitle":"Genesys Cloud Observability","icon":"plug","href":"/integrations/genesys-cloud-desktop"},{"title":"Genesys CTI Observability","sidebarTitle":"Genesys CTI Observability","icon":"plug","href":"/integrations/genesys-monitoring"},{"title":"GlassFish Server Monitoring","sidebarTitle":"GlassFish Observability","icon":"plug","href":"/integrations/glassfish-monitoring"},{"group":"Go Observability","pages":[{"title":"Go Observability","sidebarTitle":"Overview","icon":"plug","href":"/integrations/golang-monitoring/index"},{"title":"Deploy Monitoring for GoLang","sidebarTitle":"Deploy Monitoring for GoLang","icon":"rocket","href":"/integrations/golang-monitoring/deploy-code-profiling-usage-monitoring-for-golang"},{"title":"Configure Monitoring for GoLang","sidebarTitle":"Configure Monitoring for GoLang","icon":"table-columns","href":"/integrations/golang-monitoring/configure-analytics-automation-dashboard-and-report-for-golang"}]},{"title":"Hazelcast Monitoring","sidebarTitle":"Hazelcast Observability","icon":"plug","href":"/integrations/hazelcast-monitoring"},{"group":"HTML/JQuery Operational Experience Intelligence","pages":[{"title":"HTML/JQuery Operational Experience Intelligence","sidebarTitle":"Overview","icon":"plug","href":"/integrations/html-jquery-monitoring/index"},{"title":"Deploy Monitoring for HTML/JQuery","sidebarTitle":"Deploy Monitoring for HTML/JQuery","icon":"rocket","href":"/integrations/html-jquery-monitoring/deploy-monitoring-for-html-jquery"}]},{"title":"HPUX Observability","sidebarTitle":"HPUX Observability","icon":"plug","href":"/integrations/hpux-monitoring"},{"title":"IBM HTTP Server Monitoring","sidebarTitle":"IBM HTTP Server Observability","icon":"plug","href":"/integrations/ibm-http-server-monitoring"},{"title":"IIS / Internet Information Services Observability","sidebarTitle":"IIS / Internet Information Services Observability","icon":"plug","href":"/integrations/iis-log-parsing-monitoring"},{"title":"IMAP Observability","sidebarTitle":"IMAP Observability","icon":"plug","href":"/integrations/imap-monitoring"},{"title":"Infrastructure, Cloud and Operating Systems","sidebarTitle":"Infrastructure","icon":"server","href":"/integrations/infrastructure-monitoring"},{"group":"Java Operational Experience Intelligence","pages":[{"title":"Java Operational Experience Intelligence","sidebarTitle":"Overview","icon":"plug","href":"/integrations/java-monitoring/index"},{"title":"Deploy Monitoring for Java","sidebarTitle":"Deploy Monitoring for Java","icon":"rocket","href":"/integrations/java-monitoring/deploy-monitoring-automation-for-java-with-germainux"},{"title":"Configure Monitoring for Java","sidebarTitle":"Configure Monitoring for Java","icon":"list-check","href":"/integrations/java-monitoring/configuring-monitoring-and-automation-for-java-with-germainux"}]},{"group":"JavaScript Observability","pages":[{"title":"JavaScript Observability","sidebarTitle":"Overview","icon":"plug","href":"/integrations/javascript-profiling/index"},{"title":"Deploy Monitoring for JavaScript","sidebarTitle":"Deploy Monitoring for JavaScript","icon":"rocket","href":"/integrations/javascript-profiling/deploy-monitoring-for-javascript"},{"title":"Configure Monitoring for JavaScript","sidebarTitle":"Configure Monitoring for JavaScript","icon":"list-check","href":"/integrations/javascript-profiling/configure-monitoring-for-javascript"}]},{"title":"Kafka Observability","sidebarTitle":"Kafka Observability","icon":"plug","href":"/integrations/apache-kafka-monitoring"},{"group":"Kubernetes Observability","pages":[{"title":"Kubernetes Observability","sidebarTitle":"Overview","icon":"plug","href":"/integrations/kubernetes-monitoring/index"},{"title":"Deploy Monitoring for Kubernetes","sidebarTitle":"Deploy Monitoring for Kubernetes","icon":"rocket","href":"/integrations/kubernetes-monitoring/deploy-monitoring-for-kubernetes"},{"title":"Kubernetes KPIs","sidebarTitle":"Kubernetes KPIs","icon":"gauge","href":"/integrations/kubernetes-monitoring/kubernetes-kpis"}]},{"group":"Linux (RedHat, SUSE) Observability","pages":[{"title":"Linux (RedHat, SUSE) Observability","sidebarTitle":"Overview","icon":"plug","href":"/integrations/linux-redhat-suse-monitoring/index"},{"title":"Deploy Monitoring for Linux","sidebarTitle":"Deploy Monitoring for Linux","icon":"rocket","href":"/integrations/linux-redhat-suse-monitoring/deploy-monitoring-for-linux"}]},{"group":"Magento Operational Experience Intelligence","pages":[{"title":"Magento Operational Experience Intelligence","sidebarTitle":"Overview","icon":"plug","href":"/integrations/magento-monitoring/index"},{"title":"Deploy Monitoring for Magento","sidebarTitle":"Deploy Monitoring for Magento","icon":"rocket","href":"/integrations/magento-monitoring/deploy-monitoring-for-magento"},{"title":"Configure Error Monitoring for Magento","sidebarTitle":"Configure Error Monitoring for Magento","icon":"list-check","href":"/integrations/magento-monitoring/deploy-critical-user-error-monitoring-for-magento"}]},{"group":"Marko Operational Experience Intelligence","pages":[{"title":"Marko Operational Experience Intelligence","sidebarTitle":"Overview","icon":"plug","href":"/integrations/markojs-monitoring/index"},{"title":"Deploy Monitoring for MarkoJS","sidebarTitle":"Deploy Monitoring for MarkoJS","icon":"rocket","href":"/integrations/markojs-monitoring/deploy-monitoring-for-marko"},{"title":"Configure Monitoring for MarkoJS","sidebarTitle":"Configure Monitoring for MarkoJS","icon":"list-check","href":"/integrations/markojs-monitoring/configure-monitoring-for-markojs"}]},{"group":"MCP Server","icon":"plug","pages":[{"title":"GermainUX MCP Server","sidebarTitle":"Overview","icon":"plug","href":"/integrations/mcp-server"},{"title":"Enable the MCP Server","sidebarTitle":"Enable the MCP Server","icon":"toggle-on","href":"/integrations/mcp-server/enable-the-mcp-server"},{"title":"Connect an AI Client","sidebarTitle":"Connect an AI Client","icon":"plug","href":"/integrations/mcp-server/connect-an-ai-client"},{"title":"Example Prompts","sidebarTitle":"Example Prompts","icon":"message","href":"/integrations/mcp-server/example-prompts"}]},{"group":"Microsoft Dynamics 365 Operational Experience Intelligence","pages":[{"title":"Microsoft Dynamics 365 Operational Experience Intelligence","sidebarTitle":"Overview","icon":"plug","href":"/integrations/microsoft-dynamics-365-monitoring/index"},{"title":"Deploy Monitoring for Microsoft Dynamics 365","sidebarTitle":"Deploy Monitoring for Microsoft Dynamics 365","icon":"rocket","href":"/integrations/microsoft-dynamics-365-monitoring/deploy-monitoring-for-microsoft-dynamics-365"}]},{"group":"Microsoft Power BI Operational Experience Intelligence","pages":[{"title":"Microsoft Power BI Operational Experience Intelligence","sidebarTitle":"Overview","icon":"plug","href":"/integrations/microsoft-power-bi-monitoring/index"},{"title":"Deploy Monitoring for Microsoft Power BI","sidebarTitle":"Deploy Monitoring for Microsoft Power BI","icon":"rocket","href":"/integrations/microsoft-power-bi-monitoring/deploy-monitoring-for-microsoft-power-bi"},{"title":"Configure Monitoring for Microsoft Power BI","sidebarTitle":"Configure Monitoring for Microsoft Power BI","icon":"list-check","href":"/integrations/microsoft-power-bi-monitoring/configure-monitoring-for-microsoft-power-bi"}]},{"group":"Microsoft SQL Server Observability","pages":[{"title":"Microsoft SQL Server Observability","sidebarTitle":"Overview","icon":"plug","href":"/integrations/sql-server-monitoring/index"},{"title":"Deploy Monitoring for Microsoft SQL Server","sidebarTitle":"Deploy Monitoring for Microsoft SQL Server","icon":"rocket","href":"/integrations/sql-server-monitoring/deploy-monitoring-for-microsoft-sql-server"},{"title":"Configure Monitoring for Microsoft SQL Server","sidebarTitle":"Configure Monitoring for Microsoft SQL Server","icon":"gauge","href":"/integrations/sql-server-monitoring/configure-monitoring-for-microsoft-sql-server"}]},{"title":"Microsoft Teams","icon":"lightbulb","href":"/integrations/microsoft-teams-notifications"},{"title":"Middleware and Integrations","sidebarTitle":"Middleware and Integrations","icon":"network-wired","href":"/integrations/middleware-and-integrations-monitoring"},{"group":"Mobile Operational Experience Intelligence","pages":[{"title":"Mobile Operational Experience Intelligence","sidebarTitle":"Overview","icon":"plug","href":"/integrations/mobile-monitoring/index"},{"title":"Deploy Monitoring for Mobile Applications and Devices","sidebarTitle":"Deploy Monitoring for Mobile Applications and Devices","icon":"rocket","href":"/integrations/mobile-monitoring/deploying-germainux-monitoring-for-mobile-applications-and-devices"},{"title":"Configure Monitoring for Mobile Applications","sidebarTitle":"Configure Monitoring for Mobile Applications","icon":"list-check","href":"/integrations/mobile-monitoring/configuring-monitoring-for-mobile-applications-with-germainux"}]},{"title":"Moogsoft Incident Intelligence","icon":"lightbulb","href":"/integrations/moogsoft-incident-intelligence"},{"group":"MuleSoft Observability","pages":[{"title":"MuleSoft Observability","sidebarTitle":"Overview","icon":"plug","href":"/integrations/mulesoft-monitoring/index"},{"title":"Deploy Monitoring for MuleSoft","sidebarTitle":"Deploy Monitoring for MuleSoft","icon":"rocket","href":"/integrations/mulesoft-monitoring/deploying-germainux-monitoring-for-mulesoft-a-step-by-step-guide"},{"title":"Configure Monitoring for MuleSoft","sidebarTitle":"Configure Monitoring for MuleSoft","icon":"gauge","href":"/integrations/mulesoft-monitoring/configure-monitoring-for-mulesoft"},{"title":"Anypoint Platform Monitoring for MuleSoft","sidebarTitle":"Anypoint Platform Monitoring","icon":"cloud","href":"/integrations/mulesoft-monitoring/mulesoft-anypoint-platform-monitoring"},{"title":"Runtime Monitoring for MuleSoft","sidebarTitle":"Runtime Monitoring","icon":"server","href":"/integrations/mulesoft-monitoring/mulesoft-runtime-monitoring"}]},{"group":"MySQL Observability","pages":[{"title":"MySQL Observability","sidebarTitle":"Overview","icon":"plug","href":"/integrations/mysql-monitoring/index"},{"title":"Deploy Monitoring for MySQL","sidebarTitle":"Deploy Monitoring for MySQL","icon":"rocket","href":"/integrations/mysql-monitoring/deploy-monitoring-for-mysql-with-germainux"},{"title":"Configure Monitoring for MySQL","sidebarTitle":"Configure Monitoring for MySQL","icon":"gauge","href":"/integrations/mysql-monitoring/configure-monitoring-for-mysql"}]},{"group":"Network Observability","pages":[{"title":"Network Observability","sidebarTitle":"Overview","icon":"plug","href":"/integrations/network-monitoring/index"},{"title":"Deploy Monitoring for Networks","sidebarTitle":"Deploy Monitoring for Networks","icon":"rocket","href":"/integrations/network-monitoring/deploy-monitoring-for-network"},{"title":"Configure Monitoring for Networks","sidebarTitle":"Configure Monitoring for Networks","icon":"list-check","href":"/integrations/network-monitoring/configure-monitoring-for-network"}]},{"title":"Nginx Web Server Monitoring","sidebarTitle":"Nginx Observability","icon":"plug","href":"/integrations/nginx-monitoring"},{"group":"Node.js Observability","pages":[{"title":"Node.js Observability","sidebarTitle":"Overview","icon":"plug","href":"/integrations/node-js-monitoring/index"},{"title":"Deploy Monitoring for Node.js","sidebarTitle":"Deploy Monitoring for Node.js","icon":"rocket","href":"/integrations/node-js-monitoring/node-js-monitoring-deployment"},{"group":"Configure Monitoring for Node.js","pages":[{"title":"Configure Monitoring for Node.js","sidebarTitle":"Overview","icon":"list-check","href":"/integrations/node-js-monitoring/node-js-monitoring-configuration"},{"title":"Node.js Error and Exception Monitoring","sidebarTitle":"Node.js Error and Exception Monitoring","icon":"lightbulb","href":"/integrations/node-js-monitoring/node-js-error-and-exception-monitoring"},{"title":"Node.js Network Monitoring","sidebarTitle":"Node.js Network Monitoring","href":"/integrations/node-js-monitoring/node-js-network-monitoring"}]}]},{"group":"OBIEE Observability","pages":[{"title":"OBIEE Observability","sidebarTitle":"Overview","icon":"plug","href":"/integrations/obiee-monitoring/index"},{"title":"Deploy Monitoring for OBIEE","sidebarTitle":"Deploy Monitoring for OBIEE","icon":"rocket","href":"/integrations/obiee-monitoring/deploy-monitoring-for-obiee"},{"title":"Configure Monitoring for OBIEE","sidebarTitle":"Configure Monitoring for OBIEE","icon":"list-check","href":"/integrations/obiee-monitoring/configuring-monitoring-automation-for-obiee"}]},{"group":"Olark Operational Experience Intelligence","pages":[{"title":"Olark Operational Experience Intelligence","sidebarTitle":"Overview","icon":"plug","href":"/integrations/olark-monitoring/index"},{"title":"Deploy Monitoring for Olark","sidebarTitle":"Deploy Monitoring for Olark","icon":"rocket","href":"/integrations/olark-monitoring/deploying-germainux-monitoring-for-olark"},{"title":"Configure Monitoring for Olark","sidebarTitle":"Configure Monitoring for Olark","icon":"list-check","href":"/integrations/olark-monitoring/configure-monitoring-for-olark"}]},{"group":"Oracle Analytics Cloud Observability","pages":[{"title":"Oracle Analytics Cloud Observability","sidebarTitle":"Overview","icon":"plug","href":"/integrations/oracle-analytics-cloud-observability/index"},{"title":"Deploy Monitoring for Oracle Analytics Cloud","sidebarTitle":"Deploy Monitoring for Oracle Analytics Cloud","icon":"rocket","href":"/integrations/oracle-analytics-cloud-observability/deploy-monitoring-for-oracle-analytics-cloud"},{"title":"Configure Monitoring for Oracle Analytics Cloud","sidebarTitle":"Configure Monitoring for Oracle Analytics Cloud","description":"Configure GermainUX to analyze Oracle Analytics Cloud user experience, dashboards, queries, usage, APIs, OCI metrics, and synthetic workflows.","icon":"list-check","href":"/integrations/oracle-analytics-cloud-observability/configure-monitoring-for-oracle-analytics-cloud"}]},{"title":"Oracle BI Publisher Monitoring","sidebarTitle":"Oracle BI Publisher Observability","icon":"plug","href":"/integrations/oracle-bi-publisher-monitoring"},{"group":"Oracle DB Observability","pages":[{"title":"Oracle DB Observability","sidebarTitle":"Overview","description":"GermainUX provides real-time Observability, Performance Monitoring, Analytics, Alerting, and Automation for Oracle Database.","icon":"plug","href":"/integrations/oracle-db-observability/index"},{"title":"Configure Monitoring for Oracle Database","sidebarTitle":"Configure Monitoring for Oracle Database","icon":"list-check","href":"/integrations/oracle-db-observability/configure-monitoring-for-oracle-database"},{"title":"Deploy Monitoring for Oracle Database","sidebarTitle":"Deploy Monitoring for Oracle Database","icon":"rocket","href":"/integrations/oracle-db-observability/deploy-monitoring-for-oracle-database"}]},{"title":"Oracle E-Business Suite Monitoring","sidebarTitle":"Oracle E-Business Suite Operational Experience Intelligence","icon":"plug","href":"/integrations/oracle-e-business-suite-monitoring"},{"title":"Oracle Knowledge Management Monitoring","sidebarTitle":"Oracle Knowledge Operational Experience Intelligence","icon":"plug","href":"/integrations/oracle-knowledge-management-monitoring"},{"group":"Oracle Siebel CRM Operational Experience Intelligence","pages":[{"title":"Oracle Siebel CRM Operational Experience Intelligence","sidebarTitle":"Overview","icon":"plug","href":"/integrations/oracle-siebel-crm/index"},{"group":"Deploy Monitoring for Oracle Siebel CRM","pages":[{"title":"Deploy Monitoring for Oracle Siebel CRM","sidebarTitle":"Overview","icon":"rocket","href":"/integrations/oracle-siebel-crm/oracle-siebel-crm-monitoring-deployment"},{"title":"Engine Deployment for Oracle Siebel CRM","sidebarTitle":"Engine Deployment for Oracle Siebel CRM","icon":"rocket","href":"/integrations/oracle-siebel-crm/engine-deployment-for-oracle-siebel-crm"},{"title":"JS Profiler Deployment for Oracle Siebel CRM","sidebarTitle":"JS Profiler Deployment for Oracle Siebel CRM","icon":"rocket","href":"/integrations/oracle-siebel-crm/js-profiler-deployment-for-oracle-siebel-crm"},{"title":"RPA Bot Recorder Deployment for Oracle Siebel CRM","sidebarTitle":"RPA Bot Recorder Deployment for Oracle Siebel CRM","icon":"rocket","href":"/integrations/oracle-siebel-crm/rpa-bot-recorder-deployment-for-oracle-siebel-crm"},{"title":"RUM JS Deployment for Oracle Siebel CRM","sidebarTitle":"RUM JS Deployment for Oracle Siebel CRM","icon":"rocket","href":"/integrations/oracle-siebel-crm/deploy-rum-js-siebel-openui"}]},{"group":"Configure Monitoring for Oracle Siebel CRM","pages":[{"title":"Configure Monitoring for Oracle Siebel CRM","sidebarTitle":"Overview","icon":"list-check","href":"/integrations/oracle-siebel-crm/oracle-siebel-crm-monitoring-configuration"},{"title":"Application Monitoring for Oracle Siebel CRM (Configure)","sidebarTitle":"Application Monitoring for Oracle Siebel CRM (Configure)","icon":"list-check","href":"/integrations/oracle-siebel-crm/siebel-application-monitoring-configuration"},{"title":"Business Process Monitoring for Oracle Siebel CRM (Configure)","sidebarTitle":"Business Process Monitoring for Oracle Siebel CRM (Configure)","icon":"list-check","href":"/integrations/oracle-siebel-crm/siebel-business-process-monitoring-configuration"},{"title":"Crash Monitoring for Oracle Siebel CRM (Configure)","sidebarTitle":"Crash Monitoring for Oracle Siebel CRM (Configure)","icon":"list-check","href":"/integrations/oracle-siebel-crm/siebel-crash-monitoring-configuration"},{"title":"Error Monitoring for Oracle Siebel CRM (Configure)","sidebarTitle":"Error Monitoring for Oracle Siebel CRM (Configure)","icon":"list-check","href":"/integrations/oracle-siebel-crm/siebel-error-monitoring-configuration"},{"title":"eScript \u0026 Browser Real-Time Debugger for Oracle Siebel CRM (Configure)","sidebarTitle":"eScript \u0026 Browser Real-Time Debugger for Oracle Siebel CRM (Configure)","icon":"list-check","href":"/integrations/oracle-siebel-crm/siebel-escript-real-time-debugger-configuration"},{"title":"Outlier Detection for Oracle Siebel CRM (Configuration)","sidebarTitle":"Outlier Detection for Oracle Siebel CRM (Configuration)","icon":"list-check","href":"/integrations/oracle-siebel-crm/outlier-detection-for-oracle-siebel-crm-configuration"},{"title":"RPA Bots for Proactive Issue Detection and Resolution (Configure)","sidebarTitle":"RPA Bots for Proactive Issue Detection and Resolution (Configure)","icon":"list-check","href":"/integrations/oracle-siebel-crm/rpa-bots-for-proactive-issue-detection-and-resolution"},{"title":"Synthetic User Scenario for Oracle Siebel CRM (Recording)","sidebarTitle":"Synthetic User Scenario for Oracle Siebel CRM (Recording)","icon":"list-check","href":"/integrations/oracle-siebel-crm/synthetic-user-scenario-recording"},{"title":"User Feedback for Oracle Siebel CRM (Configure)","sidebarTitle":"User Feedback for Oracle Siebel CRM (Configure)","icon":"list-check","href":"/integrations/oracle-siebel-crm/siebel-user-feedback-configuration"},{"title":"User Monitoring and Session Replay for Oracle Siebel CRM (Configure)","sidebarTitle":"User Monitoring and Session Replay for Oracle Siebel CRM (Configure)","icon":"list-check","href":"/integrations/oracle-siebel-crm/siebel-user-monitoring-and-replay-configuration"}]},{"title":"KPIs for Oracle Siebel CRM Monitoring","sidebarTitle":"KPIs","icon":"gauge","href":"/integrations/oracle-siebel-crm/oracle-siebel-crm-monitoring-kpis"}]},{"title":"Oracle WebLogic Server Monitoring","sidebarTitle":"Oracle WebLogic Observability","icon":"plug","href":"/integrations/oracle-weblogic-monitoring"},{"group":"PHP Observability","pages":[{"title":"PHP Observability","sidebarTitle":"Overview","icon":"plug","href":"/integrations/php-monitoring/index"},{"title":"Deploy Monitoring for PHP","sidebarTitle":"Deploy Monitoring for PHP","icon":"rocket","href":"/integrations/php-monitoring/deploy-monitoring-for-php"},{"title":"Configure Monitoring for PHP","sidebarTitle":"Configure Monitoring for PHP","icon":"list-check","href":"/integrations/php-monitoring/configure-monitoring-for-php"}]},{"title":"Plugins (Integrate to Other Technologies)","sidebarTitle":"Plugins (Integrate to Other Technologies)","icon":"lightbulb","href":"/integrations/other-plugins"},{"group":"POP3 Mailbox Observability","pages":[{"title":"POP3 Mailbox Observability","sidebarTitle":"Overview","icon":"plug","href":"/integrations/pop3-mailbox-monitoring/index"},{"title":"Configure Monitoring for POP3 Mailbox","sidebarTitle":"Configure Monitoring for POP3 Mailbox","icon":"list-check","href":"/integrations/pop3-mailbox-monitoring/configure-pop3-mailbox"},{"title":"Deploy Monitoring for POP3 Mailbox","sidebarTitle":"Deploy Monitoring for POP3 Mailbox","icon":"rocket","href":"/integrations/pop3-mailbox-monitoring/deploy-monitoring-for-pop3-mailbox"}]},{"title":"PostgreSQL Database Monitoring","sidebarTitle":"PostgreSQL Observability","icon":"plug","href":"/integrations/postgresql-monitoring"},{"group":"ReactJS Operational Experience Intelligence","pages":[{"title":"ReactJS Operational Experience Intelligence","sidebarTitle":"Overview","icon":"plug","href":"/integrations/react-js-monitoring/index"},{"title":"Deploy Monitoring for ReactJS","sidebarTitle":"Deploy Monitoring for ReactJS","icon":"rocket","href":"/integrations/react-js-monitoring/deploy-monitoring-for-reactjs"},{"title":"Configure Monitoring for ReactJS","sidebarTitle":"Configure Monitoring for ReactJS","icon":"list-check","href":"/integrations/react-js-monitoring/configuring-germainux-monitoring-for-reactjs-applications"}]},{"group":"RingCentral Operational Experience Intelligence","pages":[{"title":"RingCentral Operational Experience Intelligence","sidebarTitle":"Overview","icon":"plug","href":"/integrations/ringcentral-monitoring/index"},{"title":"Deploy Monitoring for RingCentral","sidebarTitle":"Deploy Monitoring for RingCentral","icon":"rocket","href":"/integrations/ringcentral-monitoring/deploy-monitoring-for-ringcentral"},{"title":"Configure Monitoring for RingCentral","sidebarTitle":"Configure Monitoring for RingCentral","icon":"list-check","href":"/integrations/ringcentral-monitoring/configure-monitoring-for-ringcentral"}]},{"group":"Salesforce Experience Cloud Operational Experience Intelligence","pages":[{"title":"Salesforce Experience Cloud Operational Experience Intelligence","sidebarTitle":"Overview","icon":"plug","href":"/integrations/salesforce-experience-cloud-monitoring/index"},{"title":"Deploy Monitoring for Salesforce Experience Cloud","sidebarTitle":"Deploy Monitoring for Salesforce Experience Cloud","icon":"rocket","href":"/integrations/salesforce-experience-cloud-monitoring/deploy-monitoring-for-sfdc-experience-cloud"},{"group":"Configure Monitoring for Salesforce Experience Cloud","pages":[{"title":"Configure Monitoring for Salesforce Experience Cloud","sidebarTitle":"Overview","icon":"list-check","href":"/integrations/salesforce-experience-cloud-monitoring/configure-monitoring-for-salesforce-experience-cloud"},{"title":"User Feedback for Salesforce Experience Cloud (Configure)","sidebarTitle":"User Feedback for Salesforce Experience Cloud (Configure)","icon":"list-check","href":"/integrations/salesforce-experience-cloud-monitoring/user-feedback-for-salesforce-experience-cloud-configure"},{"title":"User Monitoring for Salesforce Experience Cloud (Configure)","sidebarTitle":"User Monitoring for Salesforce Experience Cloud (Configure)","icon":"list-check","href":"/integrations/salesforce-experience-cloud-monitoring/user-monitoring-for-salesforce-experience-cloud-configure"}]},{"title":"KPIs for Salesforce Experience Cloud Monitoring","sidebarTitle":"KPIs for Salesforce Experience Cloud Monitoring","icon":"gauge","href":"/integrations/salesforce-experience-cloud-monitoring/kpis-for-salesforce-experience-cloud-monitoring"}]},{"group":"Salesforce Operational Experience Intelligence","pages":[{"title":"Salesforce Operational Experience Intelligence","sidebarTitle":"Overview","icon":"plug","href":"/integrations/salesforce-monitoring/index"},{"title":"Deploy Monitoring for Salesforce","sidebarTitle":"Deploy Monitoring for Salesforce","icon":"rocket","href":"/integrations/salesforce-monitoring/salesforce-monitoring-deployment"},{"title":"Deploy Engine Monitoring for Salesforce","sidebarTitle":"Deploy Engine Monitoring","icon":"server","href":"/integrations/salesforce-monitoring/salesforce-engine-monitoring-deployment"},{"group":"Configure Monitoring for Salesforce","pages":[{"title":"Configure Monitoring for Salesforce","sidebarTitle":"Overview","icon":"list-check","href":"/integrations/salesforce-monitoring/salesforce-monitoring-configuration"},{"title":"Agentforce Monitoring for Salesforce","sidebarTitle":"Agentforce Monitoring for Salesforce","icon":"list-check","href":"/integrations/salesforce-monitoring/salesforce-agentforce-monitoring"},{"title":"Apex Code Monitoring for Salesforce Cloud (Configure)","sidebarTitle":"Apex Code Monitoring for Salesforce Cloud (Configure)","icon":"list-check","href":"/integrations/salesforce-monitoring/salesforce-code-monitoring"},{"title":"Apex Exception Monitoring for Salesforce Cloud (Configure)","sidebarTitle":"Apex Exception Monitoring for Salesforce Cloud (Configure)","icon":"list-check","href":"/integrations/salesforce-monitoring/apex-exception-monitoring-for-salesforce-cloud-configure"},{"title":"Audit Monitoring for Salesforce Cloud (Configuration)","sidebarTitle":"Audit Monitoring for Salesforce Cloud (Configuration)","icon":"list-check","href":"/integrations/salesforce-monitoring/salesforce-audit-monitoring"},{"title":"Debug Log Monitoring for Salesforce Cloud (Configure)","sidebarTitle":"Debug Log Monitoring for Salesforce Cloud (Configure)","icon":"list-check","href":"/integrations/salesforce-monitoring/salesforce-debug-log-monitoring"},{"title":"Error Monitoring for Salesforce Cloud (Configure)","sidebarTitle":"Error Monitoring for Salesforce Cloud (Configure)","icon":"list-check","href":"/integrations/salesforce-monitoring/error-monitoring-for-salesforce-cloud-configure"},{"title":"Instance Status Monitoring for Salesforce Cloud (Configure)","sidebarTitle":"Instance Status Monitoring for Salesforce Cloud (Configure)","icon":"list-check","href":"/integrations/salesforce-monitoring/salesforce-instance-status-monitoring"},{"title":"Log Monitoring for Salesforce Cloud (Configure)","sidebarTitle":"Log Monitoring for Salesforce Cloud (Configure)","icon":"list-check","href":"/integrations/salesforce-monitoring/salesforce-log-monitoring"},{"title":"Omni-Channel Monitoring for Salesforce Cloud (Configure)","sidebarTitle":"Omni-Channel Monitoring for Salesforce Cloud (Configure)","icon":"list-check","href":"/integrations/salesforce-monitoring/omni-channel-monitoring-for-salesforce-cloud-configure"},{"title":"Real-Time Event Monitoring for Salesforce Cloud (Configure)","sidebarTitle":"Real-Time Event Monitoring for Salesforce Cloud (Configure)","icon":"list-check","href":"/integrations/salesforce-monitoring/salesforce-real-time-event-monitoring"},{"title":"Stats Monitoring for Salesforce Cloud (Configure)","sidebarTitle":"Stats Monitoring for Salesforce Cloud (Configure)","icon":"list-check","href":"/integrations/salesforce-monitoring/salesforce-stats-monitoring"},{"title":"User Click Analysis for Salesforce Cloud (Configure)","sidebarTitle":"User Click Analysis for Salesforce Cloud (Configure)","icon":"list-check","href":"/integrations/salesforce-monitoring/salesforce-user-click-analysis"},{"title":"User Feedback for Salesforce (Configure)","sidebarTitle":"User Feedback for Salesforce (Configure)","icon":"list-check","href":"/integrations/salesforce-monitoring/user-feedback-for-salesforce-configure"},{"title":"User Monitoring and Session Replay for Salesforce Cloud (Configure)","sidebarTitle":"User Monitoring and Session Replay for Salesforce Cloud (Configure)","icon":"list-check","href":"/integrations/salesforce-monitoring/salesforce-user-monitoring-and-replay"}]},{"title":"KPIs for Salesforce Monitoring","sidebarTitle":"KPIs for Salesforce Monitoring","icon":"gauge","href":"/integrations/salesforce-monitoring/salesforce-monitoring-kpis"},{"title":"APIs for Salesforce (Classic, Lightning)","sidebarTitle":"APIs for Salesforce (Classic, Lightning)","icon":"code","href":"/integrations/salesforce-monitoring/apis-for-salesforce-classic-lightning"}]},{"group":"SAP Commerce Cloud Operational Experience Intelligence","icon":"cubes","pages":[{"title":"SAP Commerce Cloud Operational Experience Intelligence","sidebarTitle":"Overview","href":"/integrations/sap-commerce-cloud/index"},{"group":"Deploy Monitoring for SAP Commerce Cloud","pages":[{"title":"Deploy Monitoring for SAP Commerce Cloud","sidebarTitle":"Overview","href":"/integrations/sap-commerce-cloud/deploy-monitoring-for-sap"},{"title":"Engine Deployment for SAP Commerce Cloud","href":"/integrations/sap-commerce-cloud/engine-deployment-for-sap"},{"title":"JS Profiler Deployment for SAP Commerce Cloud","href":"/integrations/sap-commerce-cloud/js-profiler-deployment-for-sap"},{"title":"RPA Bot Recorder Deployment for SAP Commerce Cloud","href":"/integrations/sap-commerce-cloud/rpa-bot-recorder-deployment-for-sap"},{"title":"RUM JS Deployment for SAP Commerce Cloud","href":"/integrations/sap-commerce-cloud/rum-js-deployment-for-sap"}]},{"group":"Configure Monitoring for SAP Commerce Cloud","pages":[{"title":"Configure Monitoring for SAP Commerce Cloud","sidebarTitle":"Overview","href":"/integrations/sap-commerce-cloud/configure-monitoring-for-sap"},{"title":"Browser Real-Time Debugger for SAP Commerce Cloud (Configure)","href":"/integrations/sap-commerce-cloud/abap-browser-real-time-debugger-for-sap-configure"},{"title":"Application Monitoring for SAP Commerce Cloud (Configure)","href":"/integrations/sap-commerce-cloud/application-monitoring-for-sap-configure"},{"title":"Business Process Monitoring for SAP Commerce Cloud (Configure)","href":"/integrations/sap-commerce-cloud/business-process-monitoring-for-sap-configure"},{"title":"Crash and Diagnostic-File Monitoring for SAP Commerce Cloud (Configure)","href":"/integrations/sap-commerce-cloud/crash-monitoring-for-sap-configure"},{"title":"Error Monitoring for SAP Commerce Cloud (Configure)","href":"/integrations/sap-commerce-cloud/error-monitoring-for-sap-configure"},{"title":"Outlier Detection for SAP Commerce Cloud (Configuration)","href":"/integrations/sap-commerce-cloud/outlier-detection-for-sap-configuration"},{"title":"RPA Bots for Proactive Issue Detection and Resolution for SAP Commerce Cloud (Configure)","href":"/integrations/sap-commerce-cloud/rpa-bots-for-proactive-issue-detection-and-resolution"},{"title":"User Feedback for SAP Commerce Cloud (Configure)","href":"/integrations/sap-commerce-cloud/user-feedback-for-sap-configure"},{"title":"User Monitoring and Session Replay for SAP Commerce Cloud (Configure)","href":"/integrations/sap-commerce-cloud/user-monitoring-and-session-replay-for-sap-configure"}]},{"title":"KPIs for SAP Commerce Cloud","href":"/integrations/sap-commerce-cloud/kpis-for-sap"}]},{"group":"SAP ERP Operational Experience Intelligence","icon":"cubes","pages":[{"title":"SAP ERP Operational Experience Intelligence","sidebarTitle":"Overview","icon":"plug","href":"/integrations/sap-erp/index"}]},{"group":"Shopify Operational Experience Intelligence","pages":[{"title":"Shopify Operational Experience Intelligence","sidebarTitle":"Overview","icon":"plug","href":"/integrations/shopify/index"},{"title":"Deploy Monitoring for Shopify","sidebarTitle":"Deploy Monitoring for Shopify","icon":"rocket","href":"/integrations/shopify/deploy-monitoring-for-shopify"},{"group":"Configure Monitoring for Shopify","pages":[{"title":"Configure Monitoring for Shopify","sidebarTitle":"Overview","icon":"list-check","href":"/integrations/shopify/configure-monitoring-for-shopify"},{"title":"3rd-Party Checkouts Monitoring for Shopify (Configure)","sidebarTitle":"3rd-Party Checkouts Monitoring for Shopify (Configure)","icon":"list-check","href":"/integrations/shopify/3rd-party-checkouts-monitoring-for-shopify-configure"},{"title":"Error Monitoring for Shopify (Configure)","sidebarTitle":"Error Monitoring for Shopify (Configure)","icon":"list-check","href":"/integrations/shopify/error-monitoring-for-shopify-configure"},{"title":"Shopify Events (Configure)","sidebarTitle":"Shopify Events (Configure)","icon":"list-check","href":"/integrations/shopify/configure-shopify-events-add-to-cart-remove-from-cart"},{"title":"User Feedback for Shopify (Configure)","sidebarTitle":"User Feedback for Shopify (Configure)","icon":"list-check","href":"/integrations/shopify/user-feedback-for-shopify-configure"}]},{"title":"KPIs for Shopify Monitoring","sidebarTitle":"KPIs for Shopify Monitoring","icon":"gauge","href":"/integrations/shopify/kpis-for-shopify-monitoring"}]},{"title":"ServiceNow Incident Intelligence","icon":"lightbulb","href":"/integrations/service-now-incident-intelligence"},{"title":"SnapLogic Operational Experience Intelligence","sidebarTitle":"SnapLogic Operational Experience Intelligence","icon":"plug","href":"/integrations/snaplogic-operational-experience-intelligence"},{"title":"SNMP Device Monitoring","sidebarTitle":"SNMP Device Observability","icon":"plug","href":"/integrations/snmp-monitoring"},{"title":"Slack Notifications","icon":"lightbulb","href":"/integrations/slack-notifications"},{"group":"Soap Observability","pages":[{"title":"SOAP Observability","sidebarTitle":"Overview","icon":"plug","href":"/integrations/soap-monitoring/index"},{"title":"Deploy Monitoring for SOAP","sidebarTitle":"Deploy Monitoring for SOAP","icon":"rocket","href":"/integrations/soap-monitoring/deploy-monitoring-for-soap"},{"title":"Configure Monitoring for SOAP","sidebarTitle":"Configure Monitoring for SOAP","icon":"list-check","href":"/integrations/soap-monitoring/configure-monitoring-for-soap"}]},{"group":"Solaris Observability","pages":[{"title":"Solaris Observability","sidebarTitle":"Overview","icon":"plug","href":"/integrations/solaris-monitoring/index"},{"title":"Deploy Monitoring for Solaris","sidebarTitle":"Deploy Monitoring for Solaris","icon":"rocket","href":"/integrations/solaris-monitoring/deploy-monitoring-for-solaris"},{"title":"Configure Monitoring for Solaris","sidebarTitle":"Configure Monitoring for Solaris","icon":"list-check","href":"/integrations/solaris-monitoring/configure-monitoring-for-solaris"}]},{"group":"Squarespace Operational Experience Intelligence","pages":[{"title":"Squarespace Operational Experience Intelligence","sidebarTitle":"Overview","icon":"plug","href":"/integrations/squarespace-monitoring/index"},{"title":"Deploy Monitoring for Squarespace","sidebarTitle":"Deploy Monitoring for Squarespace","icon":"rocket","href":"/integrations/squarespace-monitoring/deploy-monitoring-for-squarespace"},{"title":"Configure Monitoring for Squarespace","sidebarTitle":"Configure Monitoring for Squarespace","icon":"list-check","href":"/integrations/squarespace-monitoring/configure-monitoring-for-squarespace"}]},{"group":"Tibco Observability","pages":[{"title":"Tibco Observability","sidebarTitle":"Overview","icon":"plug","href":"/integrations/tibco-monitoring/index"},{"title":"Deploy Monitoring for TIBCO","sidebarTitle":"Deploy Monitoring for TIBCO","href":"/integrations/tibco-monitoring/deploy-monitoring-for-tibco"},{"title":"Configure Monitoring for TIBCO","sidebarTitle":"Configure Monitoring for TIBCO","icon":"list-check","href":"/integrations/tibco-monitoring/configure-monitoring-for-tibco"}]},{"group":"Tomcat Observability","pages":[{"title":"Tomcat Observability","sidebarTitle":"Overview","icon":"plug","href":"/integrations/apache-tomcat-monitoring/index"},{"title":"Deploy Monitoring for Apache Tomcat","sidebarTitle":"Deploy Monitoring for Apache Tomcat","icon":"rocket","href":"/integrations/apache-tomcat-monitoring/deploy-monitoring-for-apache-tomcat"},{"title":"Configure Monitoring for Apache Tomcat","sidebarTitle":"Configure Monitoring for Apache Tomcat","icon":"list-check","href":"/integrations/apache-tomcat-monitoring/configure-monitoring-for-apache-tomcat"}]},{"title":"Vercel (AI Chat)","icon":"plug","href":"/integrations/vercel"},{"group":"Vue.js Operational Experience Intelligence","pages":[{"title":"Vue.js Operational Experience Intelligence","sidebarTitle":"Overview","icon":"plug","href":"/integrations/vue-js-monitoring/index"},{"title":"Deploy Monitoring for VueJS","sidebarTitle":"Deploy Monitoring for VueJS","icon":"rocket","href":"/integrations/vue-js-monitoring/deploy-monitoring-for-vuejs"},{"title":"Configure Monitoring for Vue.js","sidebarTitle":"Configure Monitoring for Vue.js","icon":"list-check","href":"/integrations/vue-js-monitoring/configure-monitoring-for-vue-js"}]},{"group":"Webflow Observability","pages":[{"title":"Webflow Observability","sidebarTitle":"Overview","icon":"plug","href":"/integrations/webflow-monitoring/index"},{"title":"Deploy Monitoring for Webflow","sidebarTitle":"Deploy Monitoring for Webflow","icon":"rocket","href":"/integrations/webflow-monitoring/deploy-monitoring-for-webflow"},{"title":"Configure Monitoring for Webflow","sidebarTitle":"Configure Monitoring for Webflow","icon":"list-check","href":"/integrations/webflow-monitoring/configure-monitoring-for-webflow"}]},{"group":"WebSphere MQ Observability","pages":[{"title":"WebSphere MQ Observability","sidebarTitle":"Overview","icon":"plug","href":"/integrations/websphere-mq-monitoring/index"},{"title":"Deploy Monitoring for IBM WebSphere MQ","sidebarTitle":"Deploy Monitoring for IBM WebSphere MQ","icon":"rocket","href":"/integrations/websphere-mq-monitoring/deploy-monitoring-for-ibm-websphere-mq"},{"title":"Configure Monitoring for IBM WebSphere MQ","sidebarTitle":"Configure Monitoring for IBM WebSphere MQ","icon":"list-check","href":"/integrations/websphere-mq-monitoring/configure-monitoring-for-ibm-websphere-mq"}]},{"group":"Windows Application Operational Experience Intelligence","pages":[{"title":"Windows Application Operational Experience Intelligence","sidebarTitle":"Overview","icon":"plug","href":"/integrations/windows-monitoring/index"},{"group":"Deploy Monitoring for Windows Application","pages":[{"title":"Deploy Monitoring for Windows Application","sidebarTitle":"Overview","icon":"rocket","href":"/integrations/windows-monitoring/deploy-monitoring-or-automation-for-windows-application"},{"title":"GermainUX Agent Installation","sidebarTitle":"GermainUX-Agent Installation","icon":"rocket","href":"/integrations/windows-monitoring/germainux-agent-installation"},{"title":"GermainUX Agent Settings (Registry)","sidebarTitle":"GermainUX-Agent Settings (Registry)","icon":"lightbulb","href":"/integrations/windows-monitoring/germainux-agent-settings-registry"}]},{"title":"Configure Monitoring for Windows Application","sidebarTitle":"Configure Monitoring for Windows Application","icon":"list-check","href":"/integrations/windows-monitoring/configure-monitoring-or-automation-for-windows-application"},{"title":"KPIs for Windows Application Monitoring, Automation \u0026 Session Replay","sidebarTitle":"KPIs for Windows Application Monitoring, Automation \u0026 Session Replay","icon":"gauge","href":"/integrations/windows-monitoring/kpis-for-windows-application-monitoring-automation-session-replay"},{"title":"GermainUX Agent Troubleshooting","sidebarTitle":"GermainUX Agent Troubleshooting","icon":"wrench","href":"/integrations/windows-monitoring/germainux-agent-troubleshooting"}]},{"group":"Wix Operational Experience Intelligence","pages":[{"title":"Wix Operational Experience Intelligence","sidebarTitle":"Overview","icon":"plug","href":"/integrations/wix-monitoring/index"},{"title":"Deploy Monitoring for Wix","sidebarTitle":"Deploy Monitoring for Wix","icon":"rocket","href":"/integrations/wix-monitoring/deploy-monitoring-for-wix"},{"title":"Configure Monitoring for Wix","sidebarTitle":"Configure Monitoring for Wix","icon":"list-check","href":"/integrations/wix-monitoring/configure-monitoring-for-wix"}]},{"group":"WooCommerce Operational Experience Intelligence","pages":[{"title":"WooCommerce Operational Experience Intelligence","sidebarTitle":"Overview","icon":"plug","href":"/integrations/woocommerce-monitoring/index"},{"title":"Deploy Monitoring for WooCommerce","sidebarTitle":"Deploy Monitoring for WooCommerce","icon":"rocket","href":"/integrations/woocommerce-monitoring/deploy-monitoring-for-woocommerce"},{"title":"Configure Monitoring for WooCommerce","sidebarTitle":"Configure Monitoring for WooCommerce","icon":"list-check","href":"/integrations/woocommerce-monitoring/configure-monitoring-for-woocommerce"}]},{"group":"WordPress Operational Experience Intelligence","pages":[{"title":"WordPress Operational Experience Intelligence","sidebarTitle":"Overview","icon":"plug","href":"/integrations/wordpress-monitoring/index"},{"title":"Deploy Monitoring for WordPress","sidebarTitle":"Deploy Monitoring for WordPress","icon":"rocket","href":"/integrations/wordpress-monitoring/deploy-monitoring-for-wordpress"},{"title":"Configure Monitoring for WordPress","sidebarTitle":"Configure Monitoring for WordPress","icon":"list-check","href":"/integrations/wordpress-monitoring/configure-monitoring-for-wordpress"}]},{"group":"Zookeeper Observability","pages":[{"title":"Zookeeper Observability","sidebarTitle":"Overview","icon":"plug","href":"/integrations/apache-zookeeper-monitoring/index"},{"title":"Deploy Monitoring for Apache ZooKeeper","sidebarTitle":"Deploy Monitoring for Apache ZooKeeper","icon":"rocket","href":"/integrations/apache-zookeeper-monitoring/deploy-monitoring-for-apache-zookeeper"},{"title":"Configure Monitoring for Apache ZooKeeper","sidebarTitle":"Configure Monitoring for Apache ZooKeeper","icon":"list-check","href":"/integrations/apache-zookeeper-monitoring/configure-monitoring-for-apache-zookeeper"}]}]},{"group":"Dashboards and Reports","icon":"table-columns","pages":[{"title":"Dashboards and Reports","sidebarTitle":"Overview","icon":"table-columns","href":"/dashboards/dashboard-and-report"},{"title":"AI Advice Dashboard","sidebarTitle":"AI Advice Dashboard","icon":"table-columns","href":"/dashboards/ai-advice-dashboard"},{"group":"Analytics Dashboard","pages":[{"title":"Analytics Dashboard","sidebarTitle":"Overview","icon":"table-columns","href":"/dashboards/analytics-dashboard/index"},{"group":"1-Aggregate Dashboard","pages":[{"title":"1-Aggregate Dashboard","sidebarTitle":"Overview","icon":"table-columns","href":"/dashboards/analytics-dashboard/1-aggregate-dashboard"},{"title":"Score Configuration (for \"Worst Instance..\")","sidebarTitle":"Score Configuration (for \"Worst Instance..\")","icon":"lightbulb","href":"/dashboards/analytics-dashboard/score-configuration-for-worst-instance"}]},{"title":"2-Pivot Dashboard","sidebarTitle":"2-Pivot Dashboard","icon":"table-columns","href":"/dashboards/analytics-dashboard/2-pivot-dashboard"},{"title":"3-Drill-Through Dashboard","sidebarTitle":"3-Drill-Through Dashboard","icon":"table-columns","href":"/dashboards/analytics-dashboard/3-drill-through-dashboard"},{"title":"4-Analysis Dashboard","sidebarTitle":"4-Analysis Dashboard","icon":"table-columns","href":"/dashboards/analytics-dashboard/4-analysis-dashboard"}]},{"title":"Configuration \u0026 Customization Dashboards","sidebarTitle":"Configuration \u0026 Customization Dashboards","icon":"table-columns","href":"/dashboards/management-dashboards"},{"title":"Frictions Dashboard","sidebarTitle":"Frictions Dashboard","icon":"table-columns","href":"/dashboards/frictions-dashboard"},{"title":"Notes and Tickets Dashboard","sidebarTitle":"Notes and Tickets Dashboard","icon":"table-columns","href":"/dashboards/note-ticket-dashboards"},{"group":"Operational Dashboard","pages":[{"title":"Operational Dashboard","sidebarTitle":"Overview","icon":"table-columns","href":"/dashboards/operational-dashboard/index"},{"title":"Adoption Tab","sidebarTitle":"Adoption Tab","icon":"table-columns","href":"/dashboards/operational-dashboard/adoption-tab"},{"title":"Conversion Tab","sidebarTitle":"Conversion Tab","icon":"table-columns","href":"/dashboards/operational-dashboard/conversion-tab"},{"title":"Technology Health Tab","sidebarTitle":"Technology Tab","icon":"table-columns","href":"/dashboards/operational-dashboard/technology-health-tab"}]},{"title":"Reports (Manual)","sidebarTitle":"Reports (Manual)","icon":"lightbulb","href":"/dashboards/reports"},{"title":"Search and Filters","sidebarTitle":"Search and Filters","icon":"lightbulb","href":"/dashboards/search-and-filters"},{"title":"SLA Violation Dashboard","sidebarTitle":"SLA Violation Dashboard","icon":"gauge-high","href":"/dashboards/sla-violation-dashboard"}]},{"group":"Management","icon":"sliders","pages":[{"title":"Management","sidebarTitle":"Overview","icon":"sliders","href":"/management/index"},{"title":"AA Unit / Day","sidebarTitle":"AA Unit / Day","icon":"lightbulb","href":"/management/analytics-and-automation-unit-aa-unit"},{"title":"Access to Germain UI/Workspace","sidebarTitle":"Access to Germain UI/Workspace","icon":"lightbulb","href":"/management/request-access"},{"title":"AI Features Management","sidebarTitle":"AI Features Management","icon":"lightbulb","href":"/management/ai-settings"},{"title":"Automation Management","sidebarTitle":"Automation Management","icon":"lightbulb","href":"/management/automation-management"},{"group":"Compliance, Data Privacy and Security","pages":[{"title":"Compliance, Data Privacy and Security","sidebarTitle":"Overview","icon":"lightbulb","href":"/management/compliance-privacy-and-security/index"},{"title":"AI Governance, Security, and Responsible Use","sidebarTitle":"AI Governance","icon":"scale-balanced","href":"/management/compliance-privacy-and-security/ai-governance"},{"title":"Certifications and Policies","sidebarTitle":"Certifications and Policies","icon":"lightbulb","href":"/management/compliance-privacy-and-security/compliance"},{"title":"Cookie Consent \u0026 User Privacy","sidebarTitle":"Cookie Consent \u0026 User Privacy","href":"/management/compliance-privacy-and-security/cookie-consent"},{"group":"Data Privacy","pages":[{"title":"Data Privacy","sidebarTitle":"Overview","icon":"lightbulb","href":"/management/compliance-privacy-and-security/data-privacy"},{"title":"AI Driven Detection","sidebarTitle":"AI Driven Detection","icon":"lightbulb","href":"/management/compliance-privacy-and-security/pii-detection-ai-driven"},{"title":"Exclusion Process","sidebarTitle":"Exclusion Process","icon":"lightbulb","href":"/management/compliance-privacy-and-security/exclusion-process"}]},{"title":"Data Security","sidebarTitle":"Data Security","icon":"lightbulb","href":"/management/compliance-privacy-and-security/data-security"},{"title":"Form Privacy and UX Monitoring Profile View","sidebarTitle":"Form Privacy and UX Monitoring Profile View","icon":"lightbulb","href":"/management/compliance-privacy-and-security/form-privacy-and-ux-monitoring-profile-view"}]},{"title":"Dashboard Management","sidebarTitle":"Dashboard Management","icon":"table-columns","href":"/management/dashboard-visibility-team-owners"},{"title":"Data Retention","sidebarTitle":"Data Retention","icon":"lightbulb","href":"/management/data-retention"},{"title":"Data Sources","sidebarTitle":"Data Sources","icon":"lightbulb","href":"/management/data-source"},{"group":"Data Warehouse","pages":[{"title":"Data Warehouse","sidebarTitle":"Overview","icon":"lightbulb","href":"/management/data-analysis/index"},{"title":"Data Model","sidebarTitle":"Data Model","icon":"lightbulb","hidden":true,"href":"/management/data-analysis/data-model"},{"title":"Data Query API","sidebarTitle":"Data Query API","icon":"code","href":"/management/data-analysis/data-query-api"},{"title":"Data Ingestion API","sidebarTitle":"Data Ingestion API","icon":"code","href":"/management/data-analysis/data-ingestion-api"},{"title":"Dynamic Database Table Creation","sidebarTitle":"Dynamic Database Table Creation","icon":"lightbulb","href":"/management/data-analysis/dynamic-database-table-creation"},{"title":"Data Model Extensibility","sidebarTitle":"Data Model Extensibility","icon":"puzzle-piece","href":"/management/data-analysis/data-model-extensibility"}]},{"title":"Display Settings","sidebarTitle":"Display Settings","icon":"lightbulb","href":"/management/display-settings"},{"group":"Germain Health","pages":[{"title":"Germain Health","sidebarTitle":"Overview","icon":"lightbulb","href":"/management/germain-health/index"},{"title":"Disaster Recovery","sidebarTitle":"Disaster Recovery","icon":"lightbulb","href":"/management/germain-health/setting-up-disaster-recovery"},{"title":"Health Check Endpoint","sidebarTitle":"Health Check Endpoint","icon":"lightbulb","href":"/management/germain-health/health-check-endpoint"},{"title":"Prometheus Metrics","sidebarTitle":"Prometheus Metrics","href":"/management/germain-health/prometheus-metrics"}]},{"title":"KPIs Management","sidebarTitle":"KPIs Management","icon":"lightbulb","href":"/management/manage-kpis"},{"title":"License","sidebarTitle":"License","icon":"lightbulb","href":"/management/license"},{"title":"Maintenance Period","sidebarTitle":"Maintenance Period","icon":"lightbulb","href":"/management/maintenance-window"},{"title":"Monitoring Management","sidebarTitle":"Monitoring Management","href":"/management/monitoring-management"},{"title":"My Data: Save Insights for Later","sidebarTitle":"My Data: Save Insights for Later","icon":"lightbulb","href":"/management/my-data-save-this-for-later"},{"title":"MySQL Database Backup","sidebarTitle":"MySQL Database Backup","icon":"lightbulb","href":"/management/how-to-backup-mysql-databases"},{"title":"Note and Ticket Management","sidebarTitle":"Note and Ticket Management","icon":"lightbulb","href":"/management/note-ticket-management"},{"title":"Presentation Mode","sidebarTitle":"Presentation Mode","icon":"lightbulb","href":"/management/presentation-mode"},{"title":"Profiles: Monitoring and Automation Sets","sidebarTitle":"Profiles: Monitoring and Automation Sets","icon":"lightbulb","href":"/management/profiles-to-deploy-at-scale"},{"group":"Template Editor for Alerts and Reports","pages":[{"title":"Template Editor for Alerts and Reports","sidebarTitle":"Overview","icon":"lightbulb","href":"/management/templates/index"},{"title":"Edit a Template","sidebarTitle":"Edit a Template","icon":"list-check","href":"/management/templates/edit-a-template"},{"title":"Template Audit Trail","sidebarTitle":"Template Audit Trail","icon":"lightbulb","href":"/management/templates/audit-trail-of-a-template"}]},{"title":"Time Ranges","sidebarTitle":"Time Ranges","icon":"lightbulb","href":"/management/time-ranges"},{"group":"User Management","pages":[{"title":"User Management","sidebarTitle":"Overview","icon":"lightbulb","href":"/management/user-management/index"},{"group":"Users","pages":[{"title":"Users","sidebarTitle":"Overview","icon":"lightbulb","href":"/management/user-management/users"},{"title":"Database Users and Roles","sidebarTitle":"Database Users and Roles","icon":"lightbulb","href":"/management/user-management/database-user-management"},{"title":"LDAP User Management","sidebarTitle":"LDAP User Management","icon":"lightbulb","href":"/management/user-management/ldap-user-management"},{"group":"OAuth User Management","pages":[{"title":"OAuth User Management","sidebarTitle":"Overview","icon":"lightbulb","href":"/management/user-management/oauth-user-management"},{"title":"Okta User Management","sidebarTitle":"Okta User Management","icon":"lightbulb","href":"/management/user-management/okta-oauth-integration-with-germain"},{"title":"PingFederate OIDC","sidebarTitle":"PingFederate OIDC","icon":"lightbulb","href":"/management/user-management/ping-federated-oidc"},{"title":"PingID User Management","sidebarTitle":"PingID User Management","icon":"lightbulb","href":"/management/user-management/pingid"}]},{"title":"Password Reset","sidebarTitle":"Password Reset","icon":"lightbulb","href":"/management/user-management/password-reset"},{"title":"User Access Request","sidebarTitle":"User Access Request","icon":"lightbulb","href":"/management/user-management/user-access-request"},{"title":"Windows Active Directory User Management","sidebarTitle":"Windows Active Directory User Management","icon":"lightbulb","href":"/management/user-management/windows-active-directory-user-management"}]},{"title":"Roles","sidebarTitle":"Roles","icon":"lightbulb","href":"/management/user-management/users-roles"},{"title":"Teams","sidebarTitle":"Teams","icon":"lightbulb","href":"/management/user-management/teams"},{"title":"API Keys","sidebarTitle":"API Keys","icon":"code","href":"/management/user-management/api-keys"}]},{"title":"Configure GermainUX with WebMCP","sidebarTitle":"WebMCP","icon":"robot","href":"/management/configure-with-webmcp"},{"title":"Wizard","sidebarTitle":"Wizard","icon":"lightbulb","href":"/management/wizard"},{"title":"Workspace","sidebarTitle":"Workspace","icon":"lightbulb","href":"/management/workspace"}]}]},{"group":"Editor Toolkit","icon":"toolbox","hidden":true,"pages":[{"title":"Gx brand","href":"/snippets/gx-brand"},{"title":"Template: Feature or concept page","sidebarTitle":"Feature or concept","icon":"lightbulb","href":"/templates/feature-page"},{"title":"Template: How-to or configuration guide","sidebarTitle":"How-to guide","icon":"list-check","href":"/templates/how-to-guide"},{"title":"Template: Deployment guide","sidebarTitle":"Deployment guide","icon":"rocket","href":"/templates/deployment-guide"},{"title":"Template: Integration overview","sidebarTitle":"Integration overview","icon":"plug","href":"/templates/integration-overview"},{"title":"Template: KPI reference","sidebarTitle":"KPI reference","icon":"gauge","href":"/templates/kpi-reference"},{"title":"Template: Dashboard guide","sidebarTitle":"Dashboard guide","icon":"table-columns","href":"/templates/dashboard-guide"},{"title":"Template: Release notes","sidebarTitle":"Release notes","icon":"rocket","href":"/templates/release-notes"},{"title":"Template: Section landing page","sidebarTitle":"Section landing page","icon":"folder-open","href":"/templates/section-landing"},{"title":"Template: Success story","sidebarTitle":"Success story","icon":"trophy","href":"/templates/success-story"},{"title":"Template: API reference","sidebarTitle":"API reference","icon":"code","href":"/templates/api-reference"},{"title":"Template: Reference or requirements","sidebarTitle":"Reference","icon":"book","href":"/templates/reference"},{"title":"Template: Troubleshooting guide","sidebarTitle":"Troubleshooting","icon":"wrench","href":"/templates/troubleshooting"},{"title":"Template: Release notes archive (2018 to 2022)","sidebarTitle":"Release notes archive","icon":"box-archive","href":"/templates/release-notes-archive"}]}]},{"tab":"Release Notes","pages":[{"title":"Release Notes","href":"/release-notes/overview"}]},{"tab":"Success Stories","pages":[{"title":"Success Stories","href":"/success-stories/overview"}]},{"tab":"Use Cases","pages":[{"title":"Use Cases","href":"/use-cases/overview"}]}]},"basePath":"","title":"Oracle BI Publisher Monitoring - GermainUX Docs","deploymentId":"dpl_HhUetB7eHHDAmK9T1Teip38TgFx9","buildId":"dpl_HhUetB7eHHDAmK9T1Teip38TgFx9","dynamics":["07c022d89b","a74be98ba7"],"chunks":["Frame-DevImLcx.js","DynamicMarkdown-BGHukeRM.js","zoom-image-lightbox-DQG3o8Eu.js","lightbox-handle-r17bVUz3.js"]}