

What Is Monitored
How It Works
Deploy
KPIs
Overview
GermainUX shows you how busy each Apache HTTP Server is and what it serves. You see busy and idle workers, request rate, throughput and Apache process memory next to every request from the access log, with its URL, status and client. When a server runs out of workers or a backend starts returning errors, the charts show it within a minute. Your team finds the saturated server without logging in to readserver-status pages and log files one by one.
Worker Saturation at a Glance
Every Request, Searchable
Failures Stand Out
400 or higher count as failed, so error spikes on a URL or a server show up right away.Ready-Made Dashboard
Questions It Answers
- Is any Apache server close to running out of workers?
- Which URLs return 5xx errors right now, and since when?
- Is one server handling more traffic or failing more requests than the others?
- Are clients or bots scanning for pages that don’t exist?
- Is the network dropping packets between clients and the web server?
- Did traffic really change, or did Apache restart?
- Is every Apache server still sending data to GermainUX?
What Is Monitored
Analytics, Alerts and Automation
AI Analysis
Ask AI Explore questions such as “Which Apache URLs failed most this week?” and get the answer without building a report. Outlier detection flags unusual spikes or drops in busy workers, request rate and failures.Dashboards and Reports
GermainUX ships the Apache HTTP dashboard. In the left menu, go to Dashboards > All, and then open Apache HTTP. It has one trend chart per KPI: Apache Busy Workers, Apache Idle Workers, Apache Process Count, Apache Request Rate, Apache Request Size, Apache Shared Memory, Apache Throughput and TCP Retransmissions. Busy workers that climb while idle workers fall to zero mean the server has reached its worker limit. New requests then wait in the queue or time out.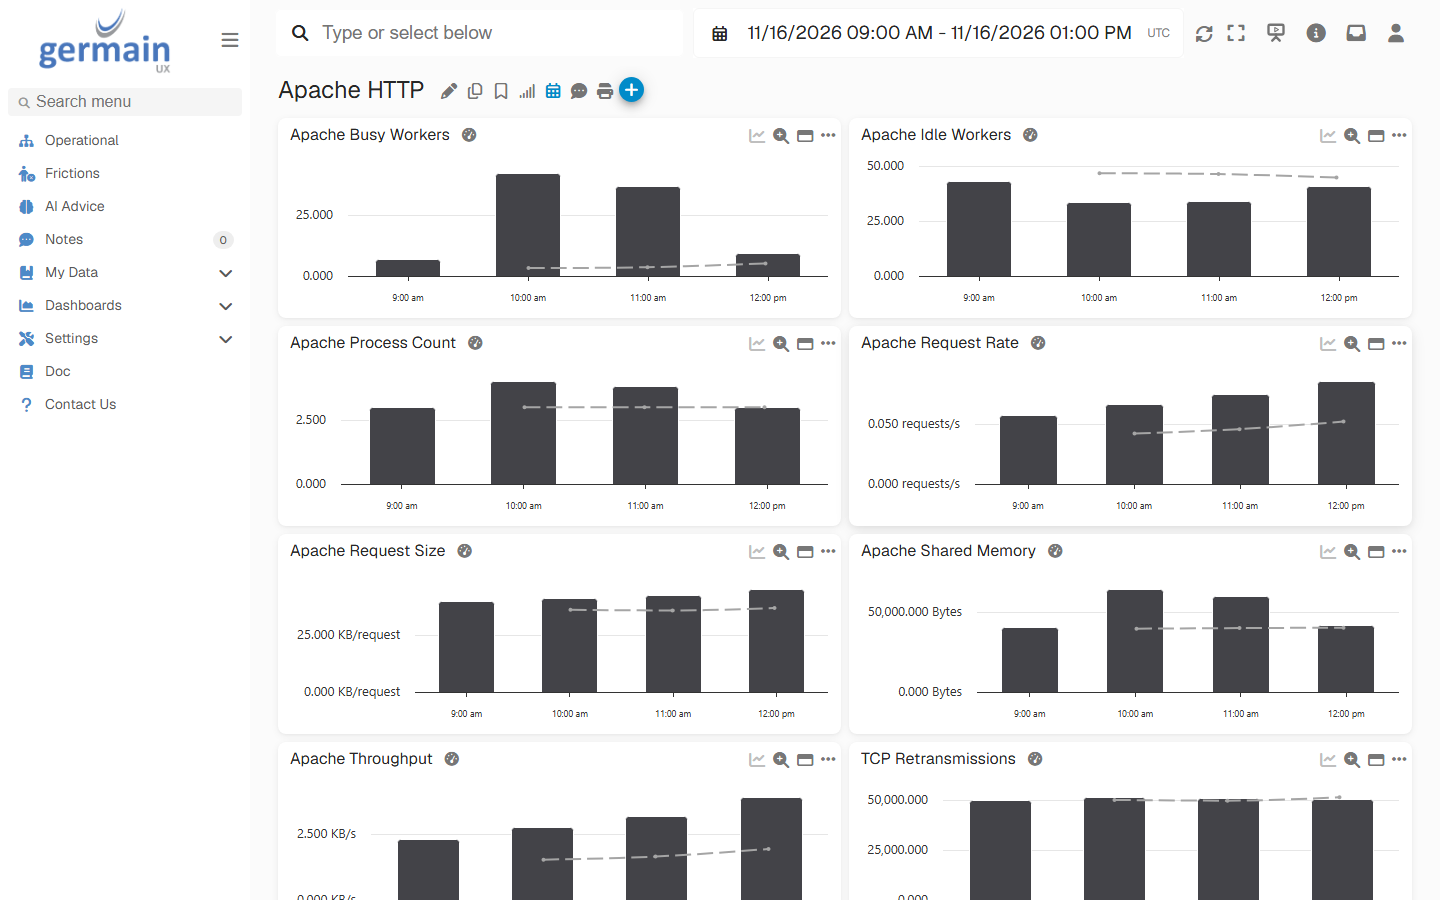
Apache HTTP Dashboard - GermainUX
Analysis
Click a chart on the dashboard to open its KPI in the Analysis screen. The segmentation breakdown lists the servers and applications that changed most, and labels each one as a spike, an outlier or degraded.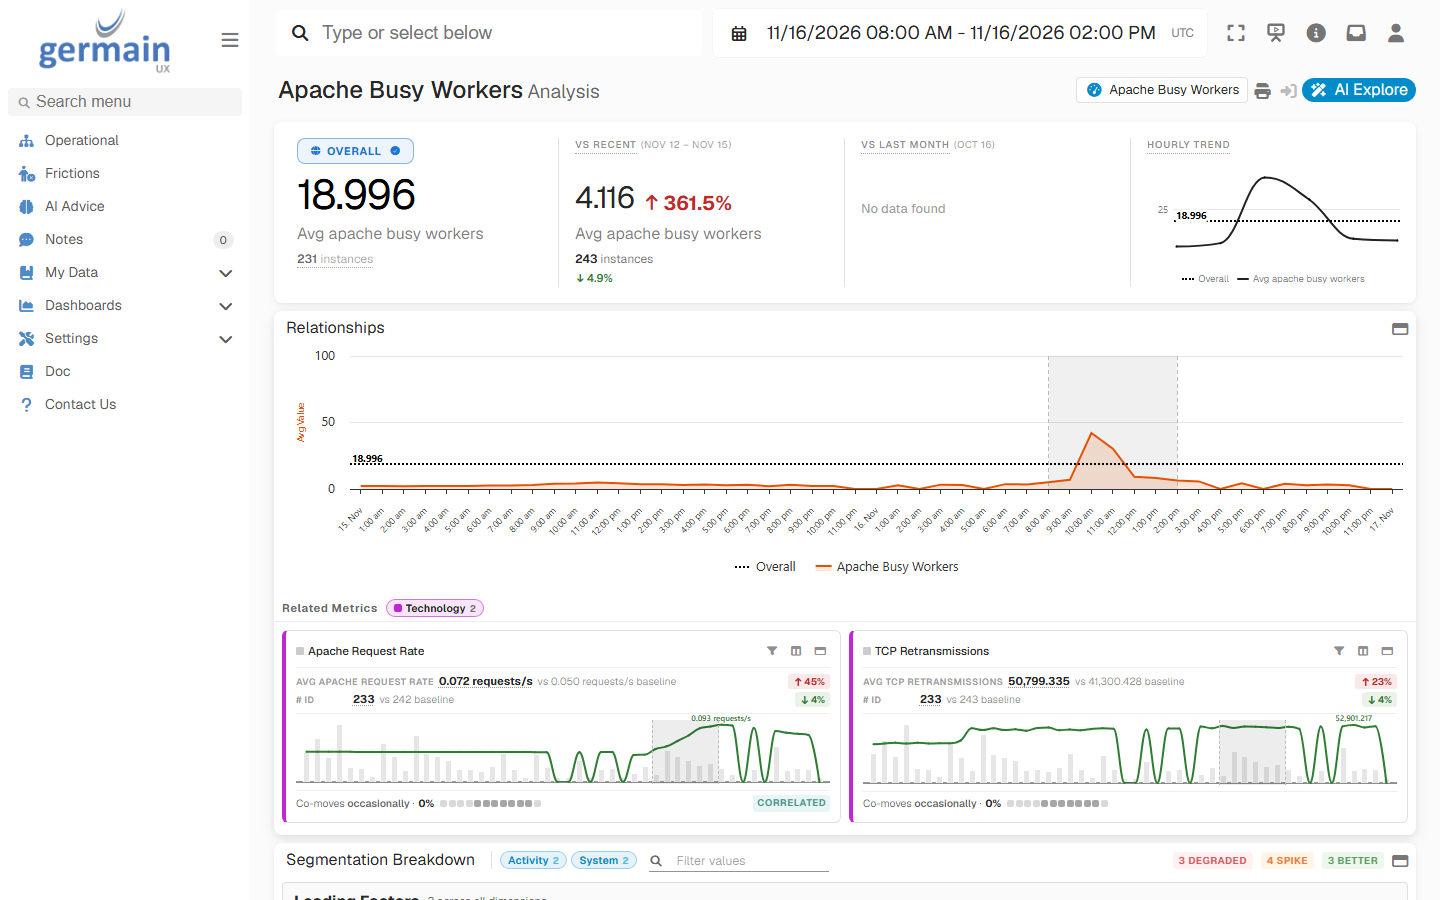
Analysis of Apache Busy Workers - GermainUX
Investigate Backend Errors Behind mod_proxy
When an application server behind Apache stops, mod_proxy answers 503 to every request it forwards there, and each of these requests counts as failed. Open the Inbound HTTP Request KPI in the Analysis screen, filtered to failed Apache requests: Success is false and Member is Apache HTTP. The top row counts the failed requests, compares them with the same hours on the previous days, and shows the hourly trend. The segmentation breakdown shows which server they come from.
In the example below, app-02 stops for 45 minutes on the afternoon of 15 November. mod_proxy on web-02, which forwards /app/ and /api/ requests to app-02, answers 503 to each of them. The screen counts 46 failed requests between 11:00 and 16:00 UTC, up 411.1% on the previous days, all in one hour. The breakdown marks web-02 as a spike with 44 of them, so you know which backend to check. The failures stop when app-02 is back. An SLA on the failure rate per server, with an alert, tells you about the next outage as it starts.
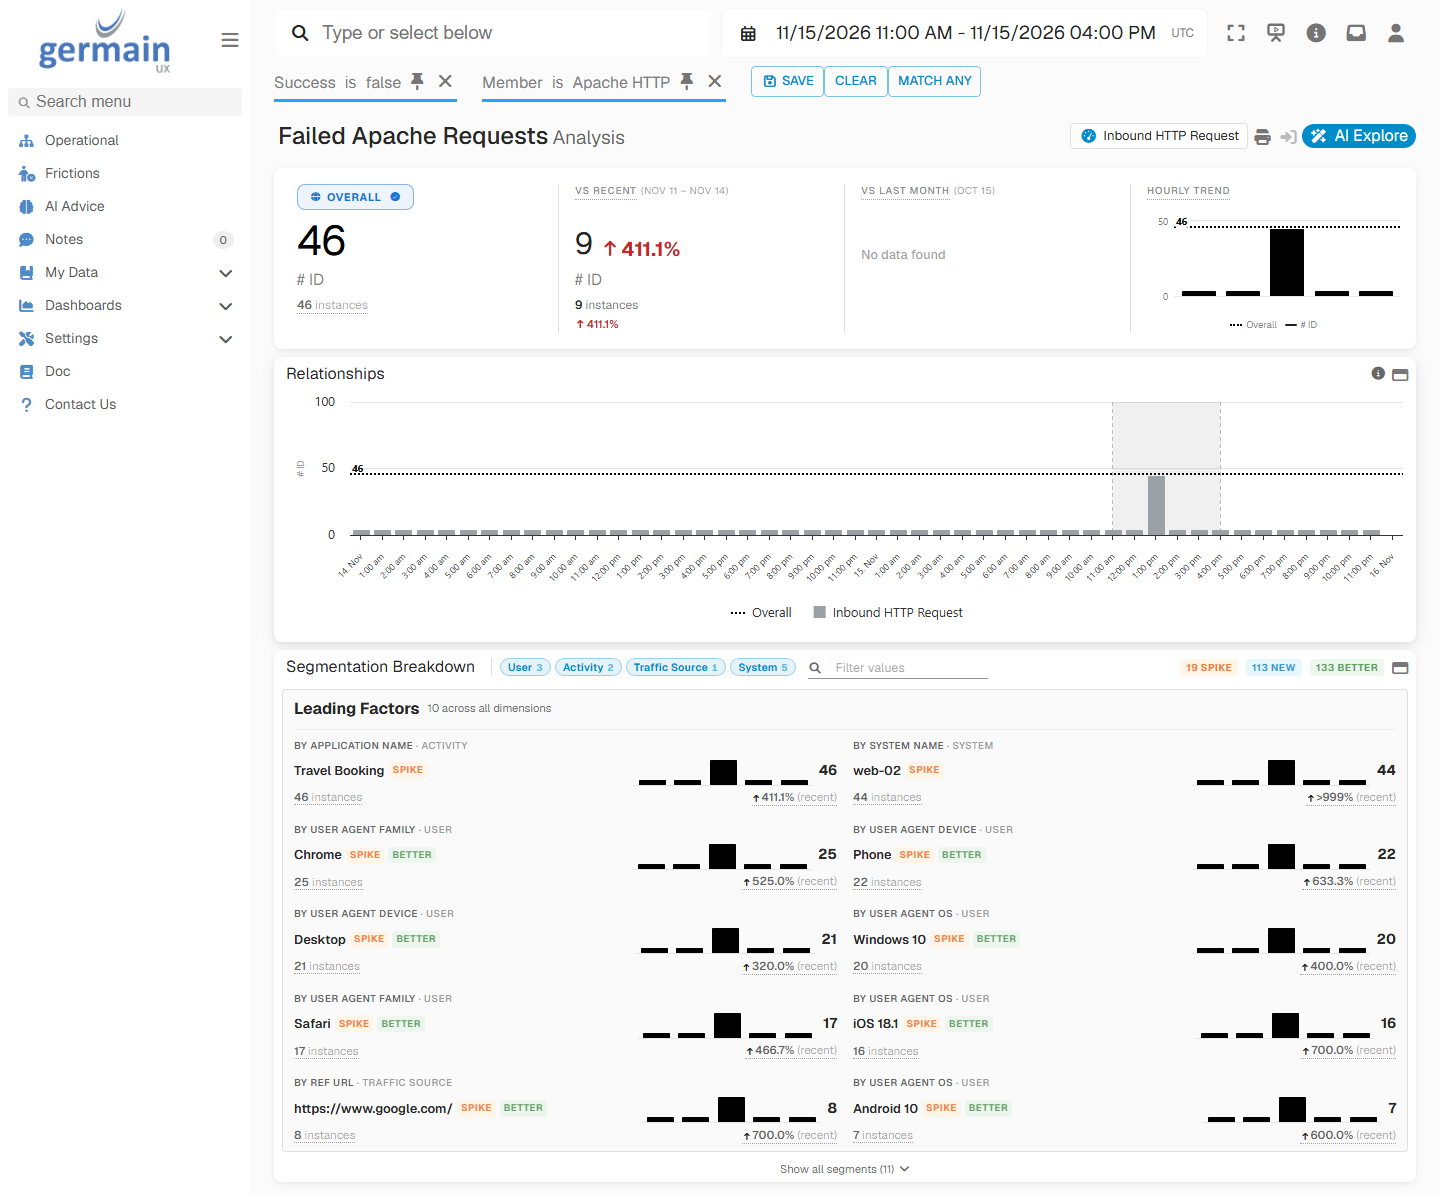
Aggregate Analysis of Failed Apache Requests During a Backend Outage - GermainUX
Investigate a 404 Scan
A vulnerability scanner or a bot that probes for files that don’t exist causes a burst of404 responses. Open the failed Apache requests in the Analysis screen, as for backend errors. The segmentation breakdown lists the servers, user agents and URLs that the failed requests have in common.
In the example below, a scanner probes both servers for 50 minutes in the night of 16 November, asking for paths such as /.env, /.aws/credentials, /xmlrpc.php and /backup.tar.gz. The screen counts 843 failed requests between 23:00 and 04:00 UTC, against 2 at the same hours on the previous days. The breakdown splits them between web-01 (440) and web-02 (403), marks the Robot user agent device as new, and lists each probed path. None of these paths exists on the site, so the requests don’t come from real users.
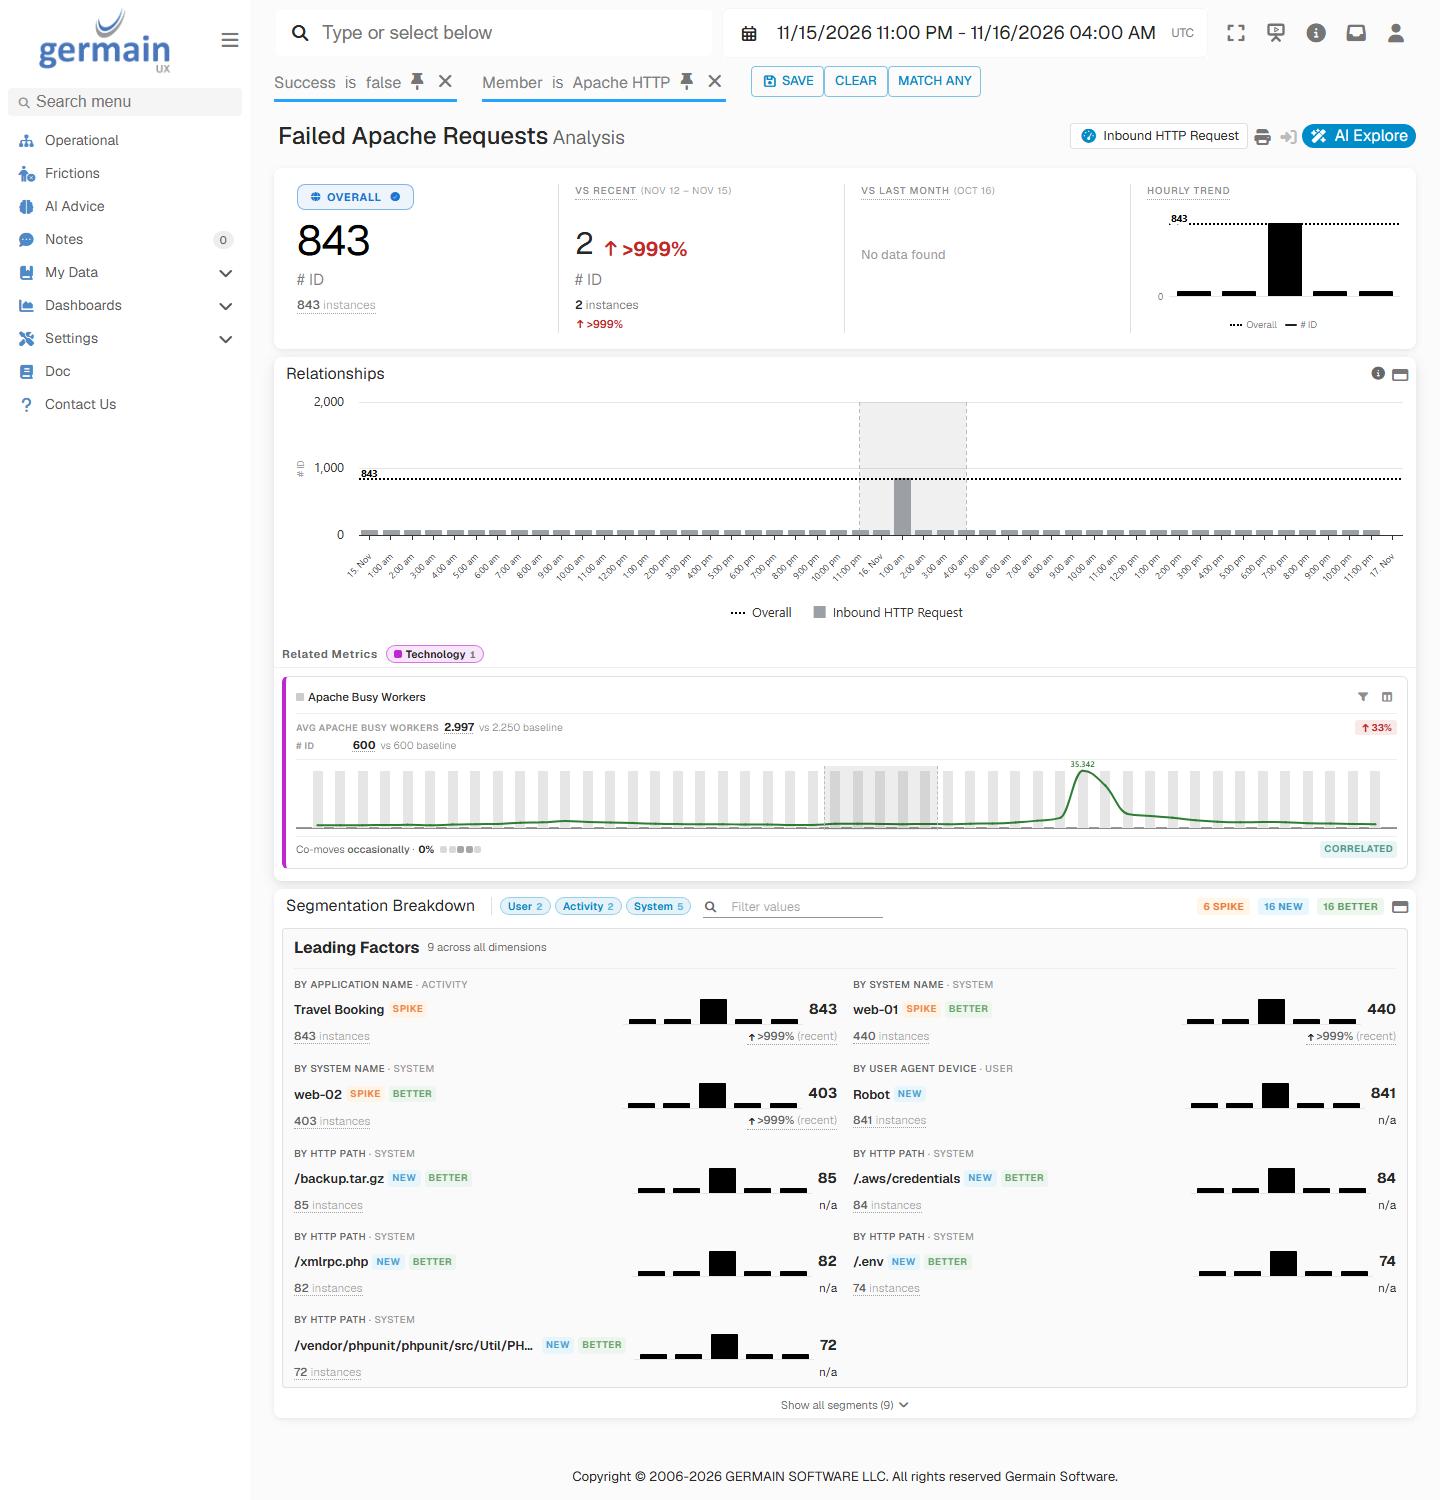
Aggregate Analysis of Failed Apache Requests During a 404 Scan - GermainUX
Investigate Packet Loss on a Web Server
TCP Retransmissions holds the total number of TCP segments the Apache host has retransmitted since it started, so its line always climbs. Packet loss shows as a steeper climb, not as a spike. Click the TCP Retransmissions chart on the Apache HTTP dashboard to open it in the Analysis screen, and compare the slope of each server in the segmentation breakdown. In the example below, a faulty switch port drops packets on web-02 for 45 minutes in the morning of 15 November. The breakdown marks web-02 as degraded: its total climbs steeply during the fault, then levels off, and ends up 28.7% higher than on the previous days. The total of web-01 climbs slowly and evenly, 7.1% above the previous days.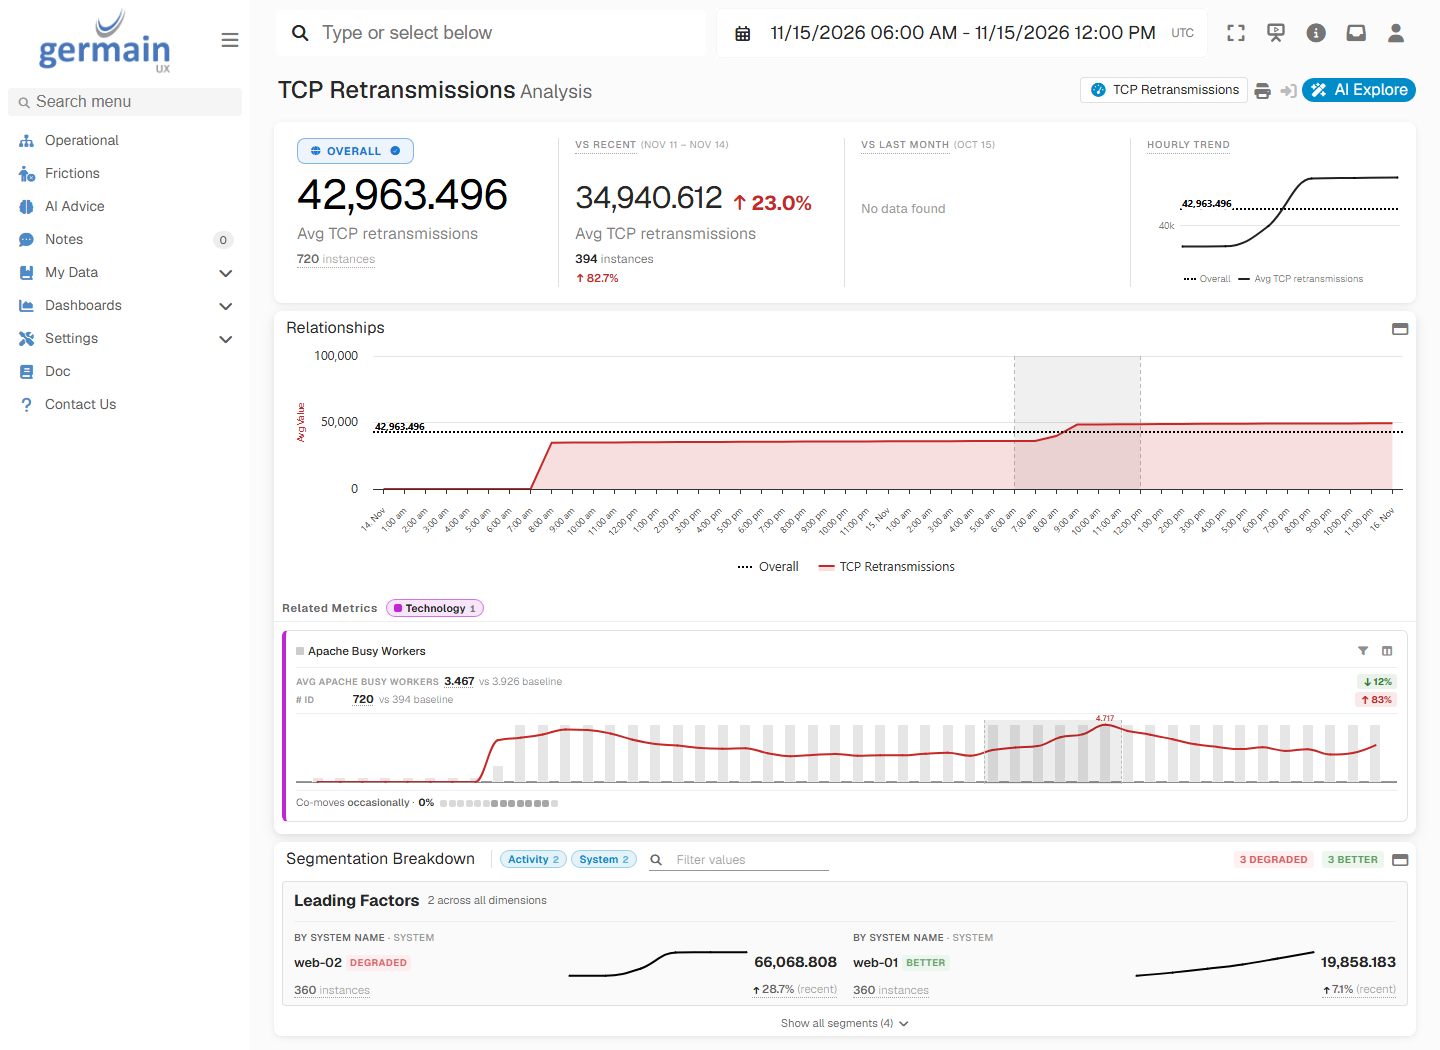
Aggregate Analysis of TCP Retransmissions - GermainUX
Investigate a Request Rate Change After a Restart
Apache Request Rate, Apache Throughput and Apache Request Size are averages thatmod_status computes over the time since Apache started. After days of uptime they barely move, so their lines look flat. When Apache restarts, mod_status starts again from zero. The first values cover only the few requests since the restart, and the line then follows the traffic of the hours since. Busy workers, idle workers and process count are current values, so a restart doesn’t move them this way. Before you read a jump in these three KPIs as a traffic change, check whether Apache restarted at that time.
In the example below, Apache restarts on web-01 and web-02 at 05:00 UTC on 16 November to load a renewed certificate. Before the restart, the request rate is a flat line at about 0.046 requests per second. Right after it, the line dips, because few requests arrive at that hour, and then climbs with the day’s traffic to close to 0.1 requests per second in the afternoon. Both servers show the same shape in the segmentation breakdown. Traffic didn’t change; only the period that the average covers did.
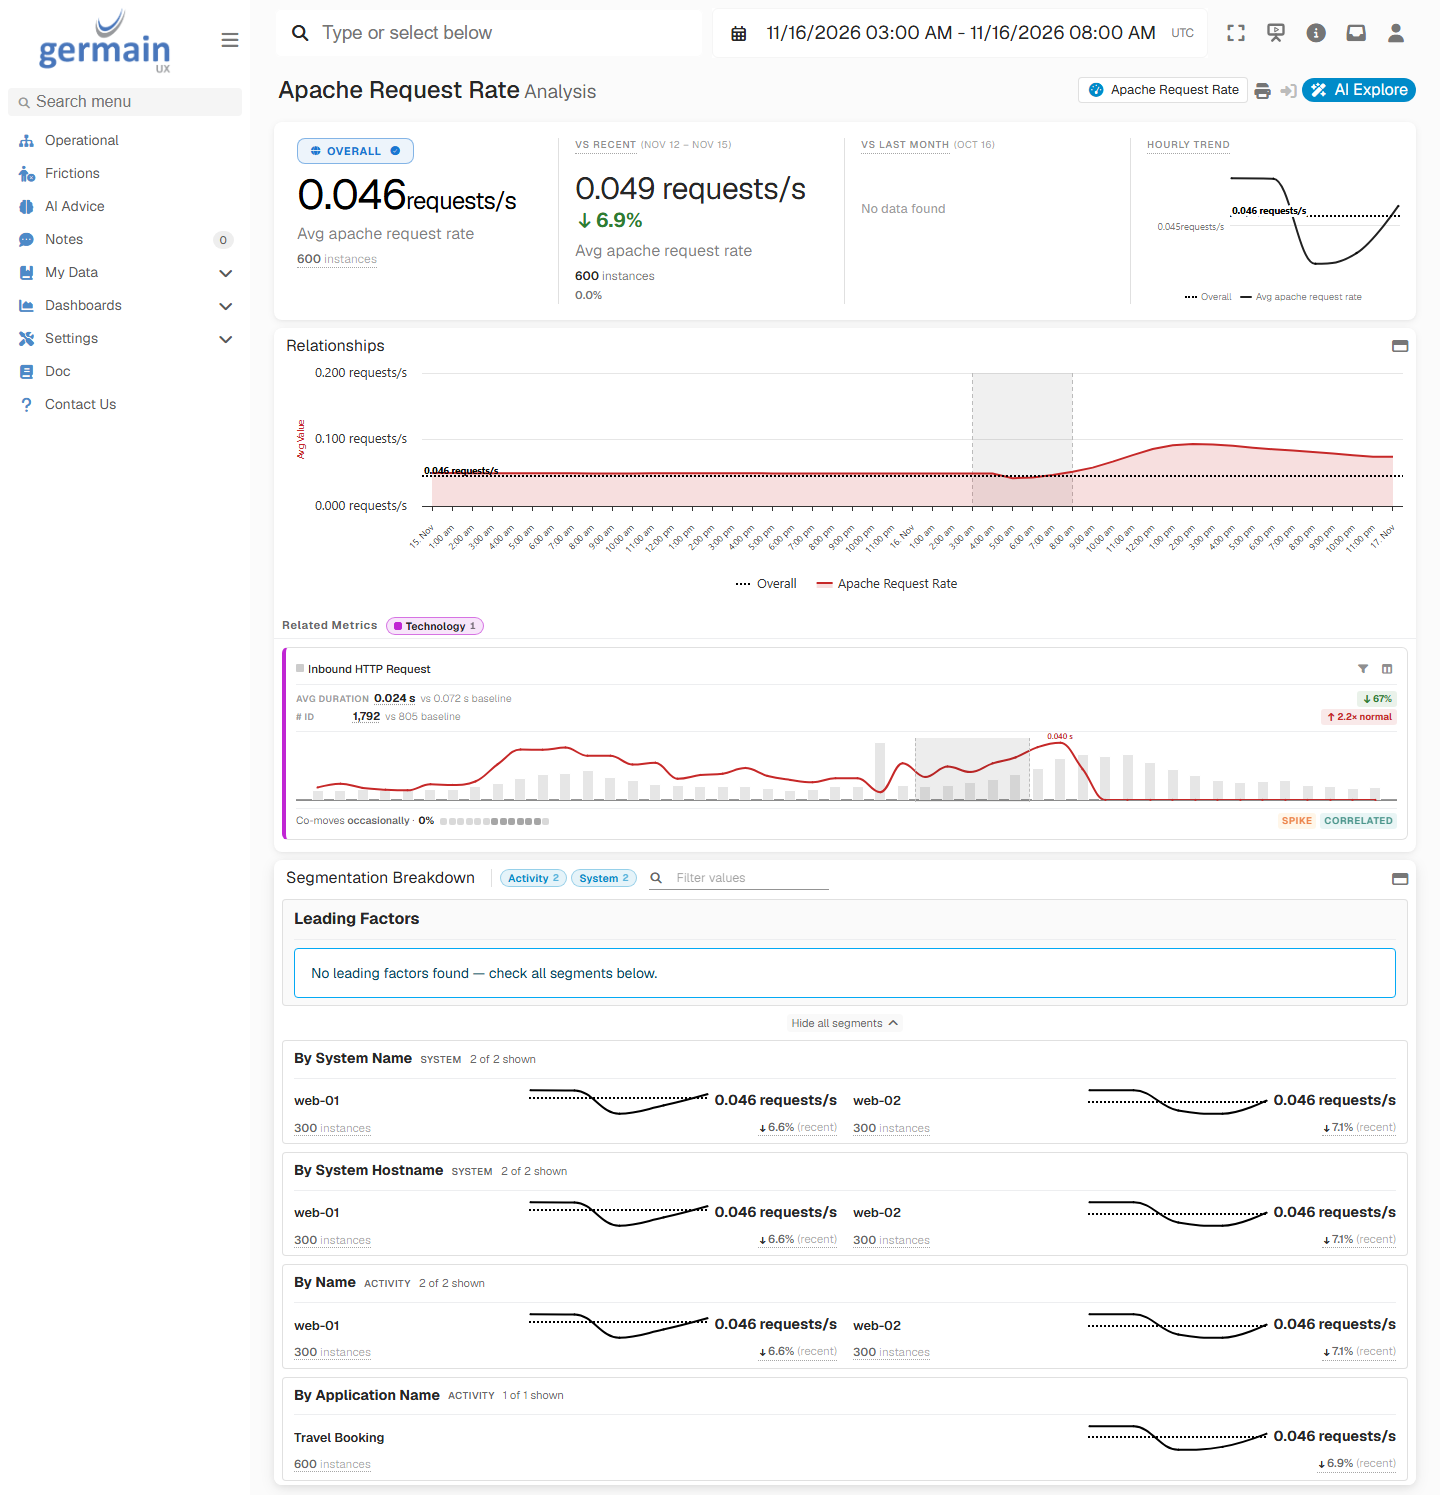
Aggregate Analysis of Apache Request Rate After a Restart - GermainUX
SLAs and Alerts
Set SLAs on busy workers, request rate or the failure rate of requests, and get an alert by email, SMS, Slack or Teams when one is breached. An SLA on idle workers tells you when a server is about to run out of capacity.Correlation with Other Technologies
Correlate Apache requests with browser sessions and with the application servers behind Apache, such as Apache Tomcat, to follow a failed request to its cause.How It Works
Before You Start
- A GermainUX Engine is deployed on the Apache host, which runs Linux. See GermainUX Engine.
- The Apache host is set up as a server in GermainUX, and the Engine on it is registered for that server.
mod_statusis enabled, andhttp://APACHE_HOST/server-statusanswers on port80from the Apache host itself.ExtendedStatusisOn, soserver-statusreports request rate, throughput and request size.- The access log uses the
combinedformat and is written to a file namedaccess.log. - The Engine’s account can read the access log directory, for example
/var/log/apache2. /usr/bin/wgetand/bin/netstatare installed on the Apache host.
Deploy
Check the Apache configuration
server-status is enabled and that the access log uses the combined format:Open the Apache HTTP Server wizard
Select the Apache servers
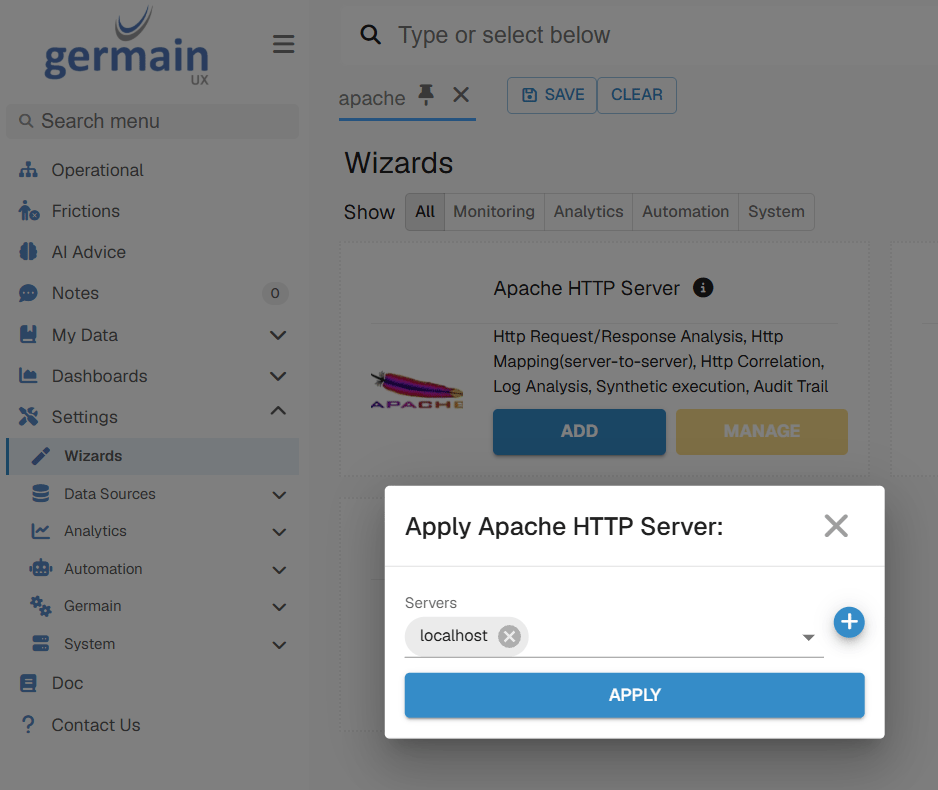
Apply Apache HTTP Server Dialog - GermainUX
Fill in the profile settings
server-status and the access log.Validate
Check server-status
APACHE_HOST with the host name of the Apache server. The output shows the number of busy and idle workers.Send test requests
Find the data in GermainUX
/ and /germainux-test-missing. Check that the 404 request counts as failed.Troubleshooting
The Apache HTTP dashboard stays empty
The Apache HTTP dashboard stays empty
wget -qO- http://APACHE_HOST/server-status returns the status page on the Apache host, and that mod_status allows requests from the host itself. Check that the components run on the Engine of the Apache host: in the left menu, go to Settings > Wizards, and click Manage on the Apache HTTP Server card.Request rate, throughput and request size stay at zero
Request rate, throughput and request size stay at zero
server-status reports these values only when ExtendedStatus is On. Turn it on and reload Apache.No Apache requests appear
No Apache requests appear
access.log, that it’s in the Access Log Directory you selected, and that the Engine’s account can read it. A log written to another file name, such as access_log or ssl_access.log, isn’t picked up.Some access-log lines are missing
Some access-log lines are missing
combined format. This happens when a CustomLog line uses another format, such as common or a custom one. Use the combined format for access.log.TCP retransmissions are missing
TCP retransmissions are missing
/bin/netstat. Install the package that provides it, such as net-tools.Security and Privacy
Apache HTTP Server monitoring data includes personal data:- Identity data: the client address and the authenticated user name of each request
- URLs: the request path and query string, and the referrer URL. Query strings can contain email addresses, IDs or tokens, so treat them as possibly containing personal or customer data.
- Device data: the user agent of each request, with the browser and operating system
KPIs
Related Documentation
Apache Tomcat
File and Log Monitoring
Automation
Get Help
The GermainUX team can help you monitor Apache servers that use a custom log format, another log file name or a non-default status URL.Contact GermainUX Support
Can't Find What You Need?
The content of this document is proprietary to GERMAIN SOFTWARE.