

What GermainUX Monitors
Hosts, containers, cloud, network
Supported Technologies
Full list of integrations
Automation
Act on infrastructure conditions
Overview
GermainUX monitors the infrastructure that applications and business processes depend on: physical and virtual hosts, containers, cloud resources, network devices and operating systems. Infrastructure data is analyzed alongside user, application, code, database and integration activity. This helps teams determine whether a slow page, failed transaction or interrupted workflow is caused by an infrastructure condition, and how many users or business processes are affected.What GermainUX Monitors
Available metrics depend on the technology, deployment method, accessible interfaces and installed GermainUX components.
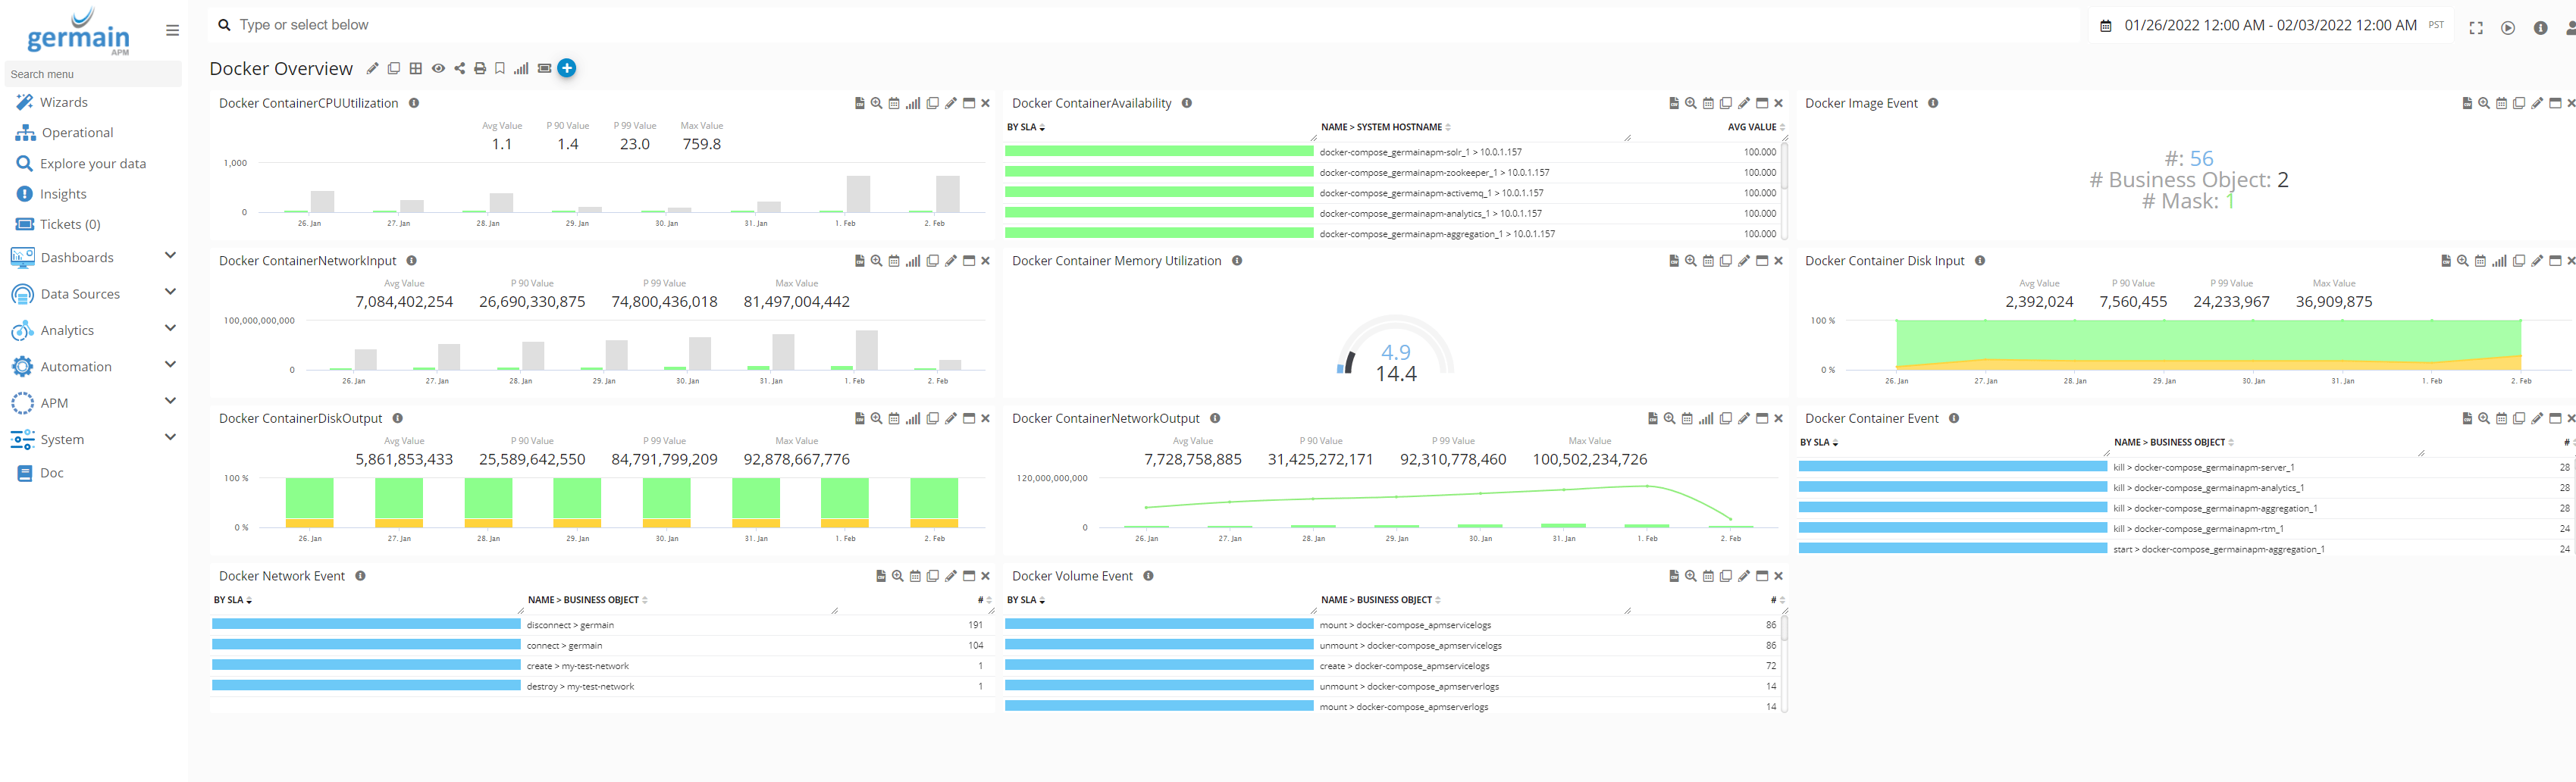
Docker Overview dashboard with container CPU, memory, disk, network and events - GermainUX
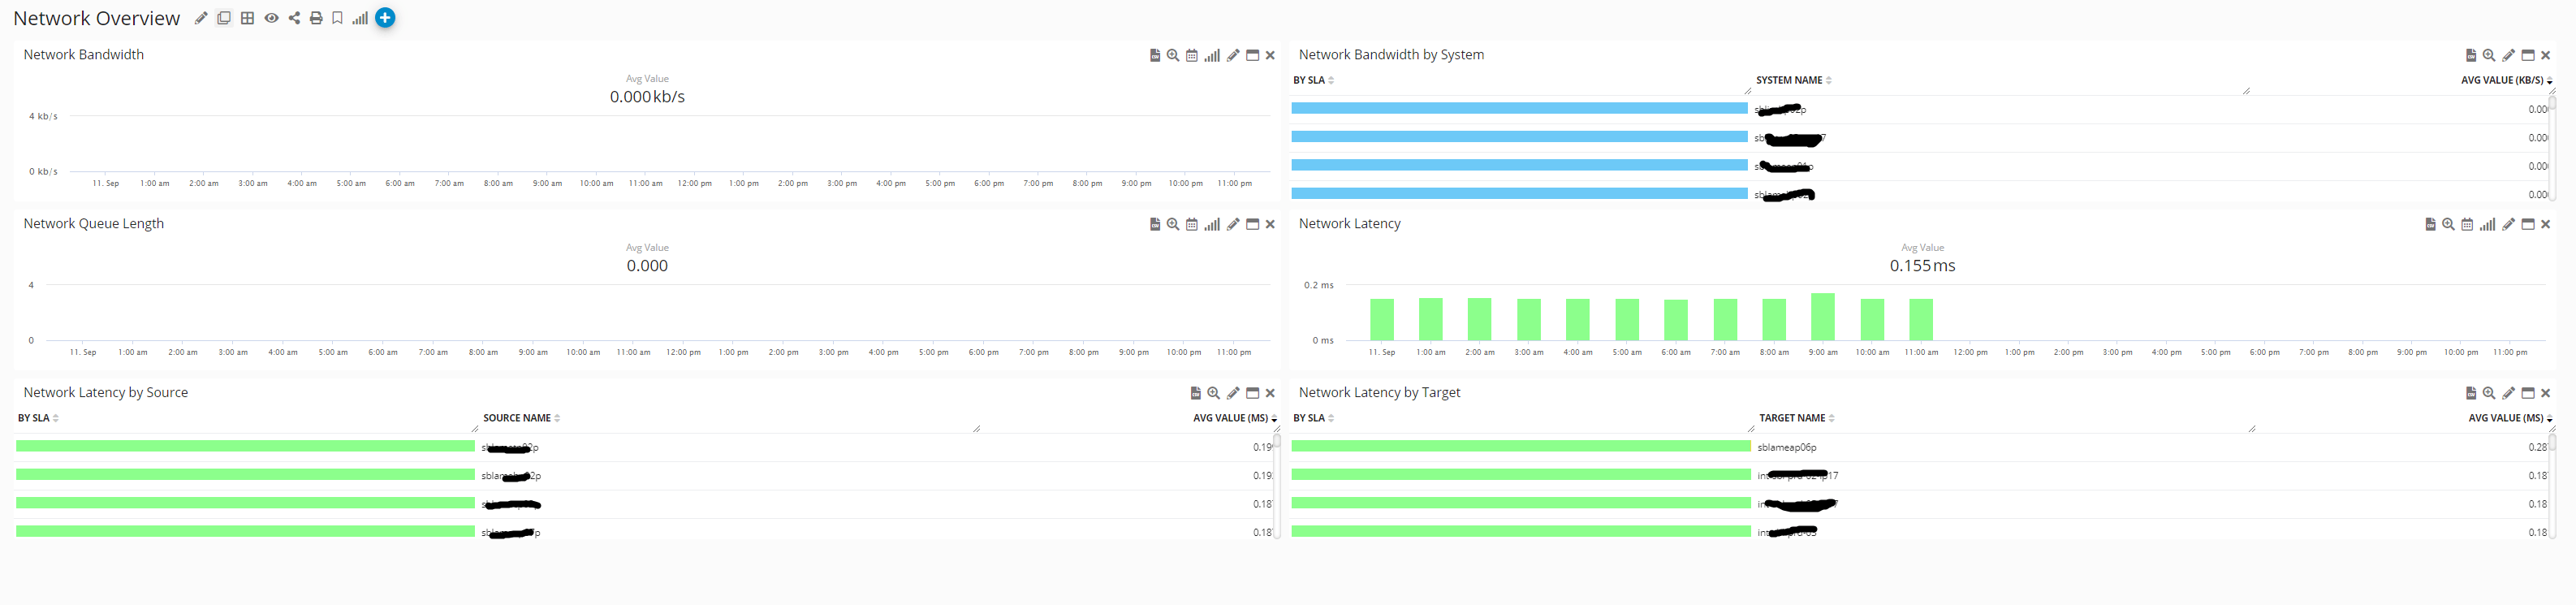
Network Overview dashboard with bandwidth and latency by source and target - GermainUX
Supported Technologies
Web and application servers such as Tomcat, Nginx and IIS are listed under Code and application runtimes on the Integrations overview.
Analyze Infrastructure Impact
Infrastructure metrics become more useful when connected to the users and workflows they affect. With GermainUX you can:- Correlate host, container and network conditions with slow user interactions, errors and failed transactions. See Correlation and Tracing.
- Separate infrastructure events with no observed user impact from those affecting users or business processes. See Impact at Scale for Any Issue.
- Detect abnormal trends and spikes in capacity or utilization. See Outlier and Anomaly Detection.
- Define thresholds and alerts with SLAs.
- Investigate a condition from the KPI to the affected population in the Analysis Dashboard.
- Monitor overall health in real time on the Operational Dashboard.
Automation for Infrastructure
Infrastructure components can also be targets for GermainUX actions, run manually, on a schedule or when a configured condition is met.
See Automation for all available actions.
Deployment
Infrastructure monitoring is typically collected by the GermainUX Engine, locally or remotely, and by the GermainUX Agent on supported hosts. See each technology page above for its specific deployment and configuration steps.Related Pages
Integrations Overview
All supported integrations
Middleware and Integrations
Queues, messaging and services
Data Sources
Hosts, databases, files and URIs
Get Help
Contact GermainUX Support
The GermainUX team helps you get up and running faster, empower your team, turn data into actionable insights, and optimize performance to deliver measurable business outcomes.
Can't Find What You Need?
Search all GermainUX docs with Ctrl + K, or use the feedback buttons at the bottom of this page to tell us what is missing.
The content of this document is proprietary to GERMAIN SOFTWARE.