

What Is Monitored
Vulnerabilities, storage, email
How It Works
AWS CLI on the Engine
Deploy
IAM access and monitors
KPIs
13 KPIs, default SLAs
Overview
GermainUX shows how many critical, high and medium vulnerabilities Amazon Inspector has found on each EC2 instance and each container image in Amazon ECR. It tracks how full your Amazon RDS storage is, and how many emails Amazon SES sent, bounced, rejected or drew complaints for in the last hour. Default SLAs come with every KPI, so you get an alert when a new critical vulnerability appears, RDS storage passes 80%, or a recipient marks your email as spam. Security, database and email teams watch these signals next to the rest of their monitoring, instead of checking three AWS consoles.Vulnerabilities by Instance and Image
Critical, high and medium Amazon Inspector findings for each EC2 instance and each ECR image, with the AMI, operating system and image tag.
RDS Storage Headroom
The share of allocated RDS storage that is in use, with an alert before a database runs out of space.
Email Delivery Health
Sent, bounced, rejected and complaint counts from Amazon SES every hour, so a sending problem shows up before it affects your sender reputation.
Suppressed Recipients
The number of addresses on the SES account-level suppression list because of bounces or complaints, and which addresses they are.
Questions It Answers
- Which EC2 instances have critical vulnerabilities right now?
- Which container images in ECR need patching before the next release?
- How close is our RDS storage to full?
- Did Amazon SES stop sending email in the last hour?
- Are bounces or complaints rising after a campaign?
- Which recipients are suppressed because of complaints?
What Is Monitored
For EC2 instance metrics such as CPU, network and status checks, see Amazon EC2.
Analytics, Alerts and Automation
Dashboards and Reports
Build dashboards and reports on the AWS KPIs: open vulnerabilities by instance, image or operating system, RDS storage use over time, and SES bounces and complaints by hour. GermainUX ships the AWS Overview dashboard as a starting point. In the left menu, go to Dashboards > All, and then open AWS Overview in the AWS folder. It shows RDS storage use, the burst balance of each EC2 instance, critical, high and medium vulnerabilities on EC2 instances and container images, critical vulnerabilities by instance and by repository, SES sent, bounced, complaint and rejected mails, and suppressed addresses.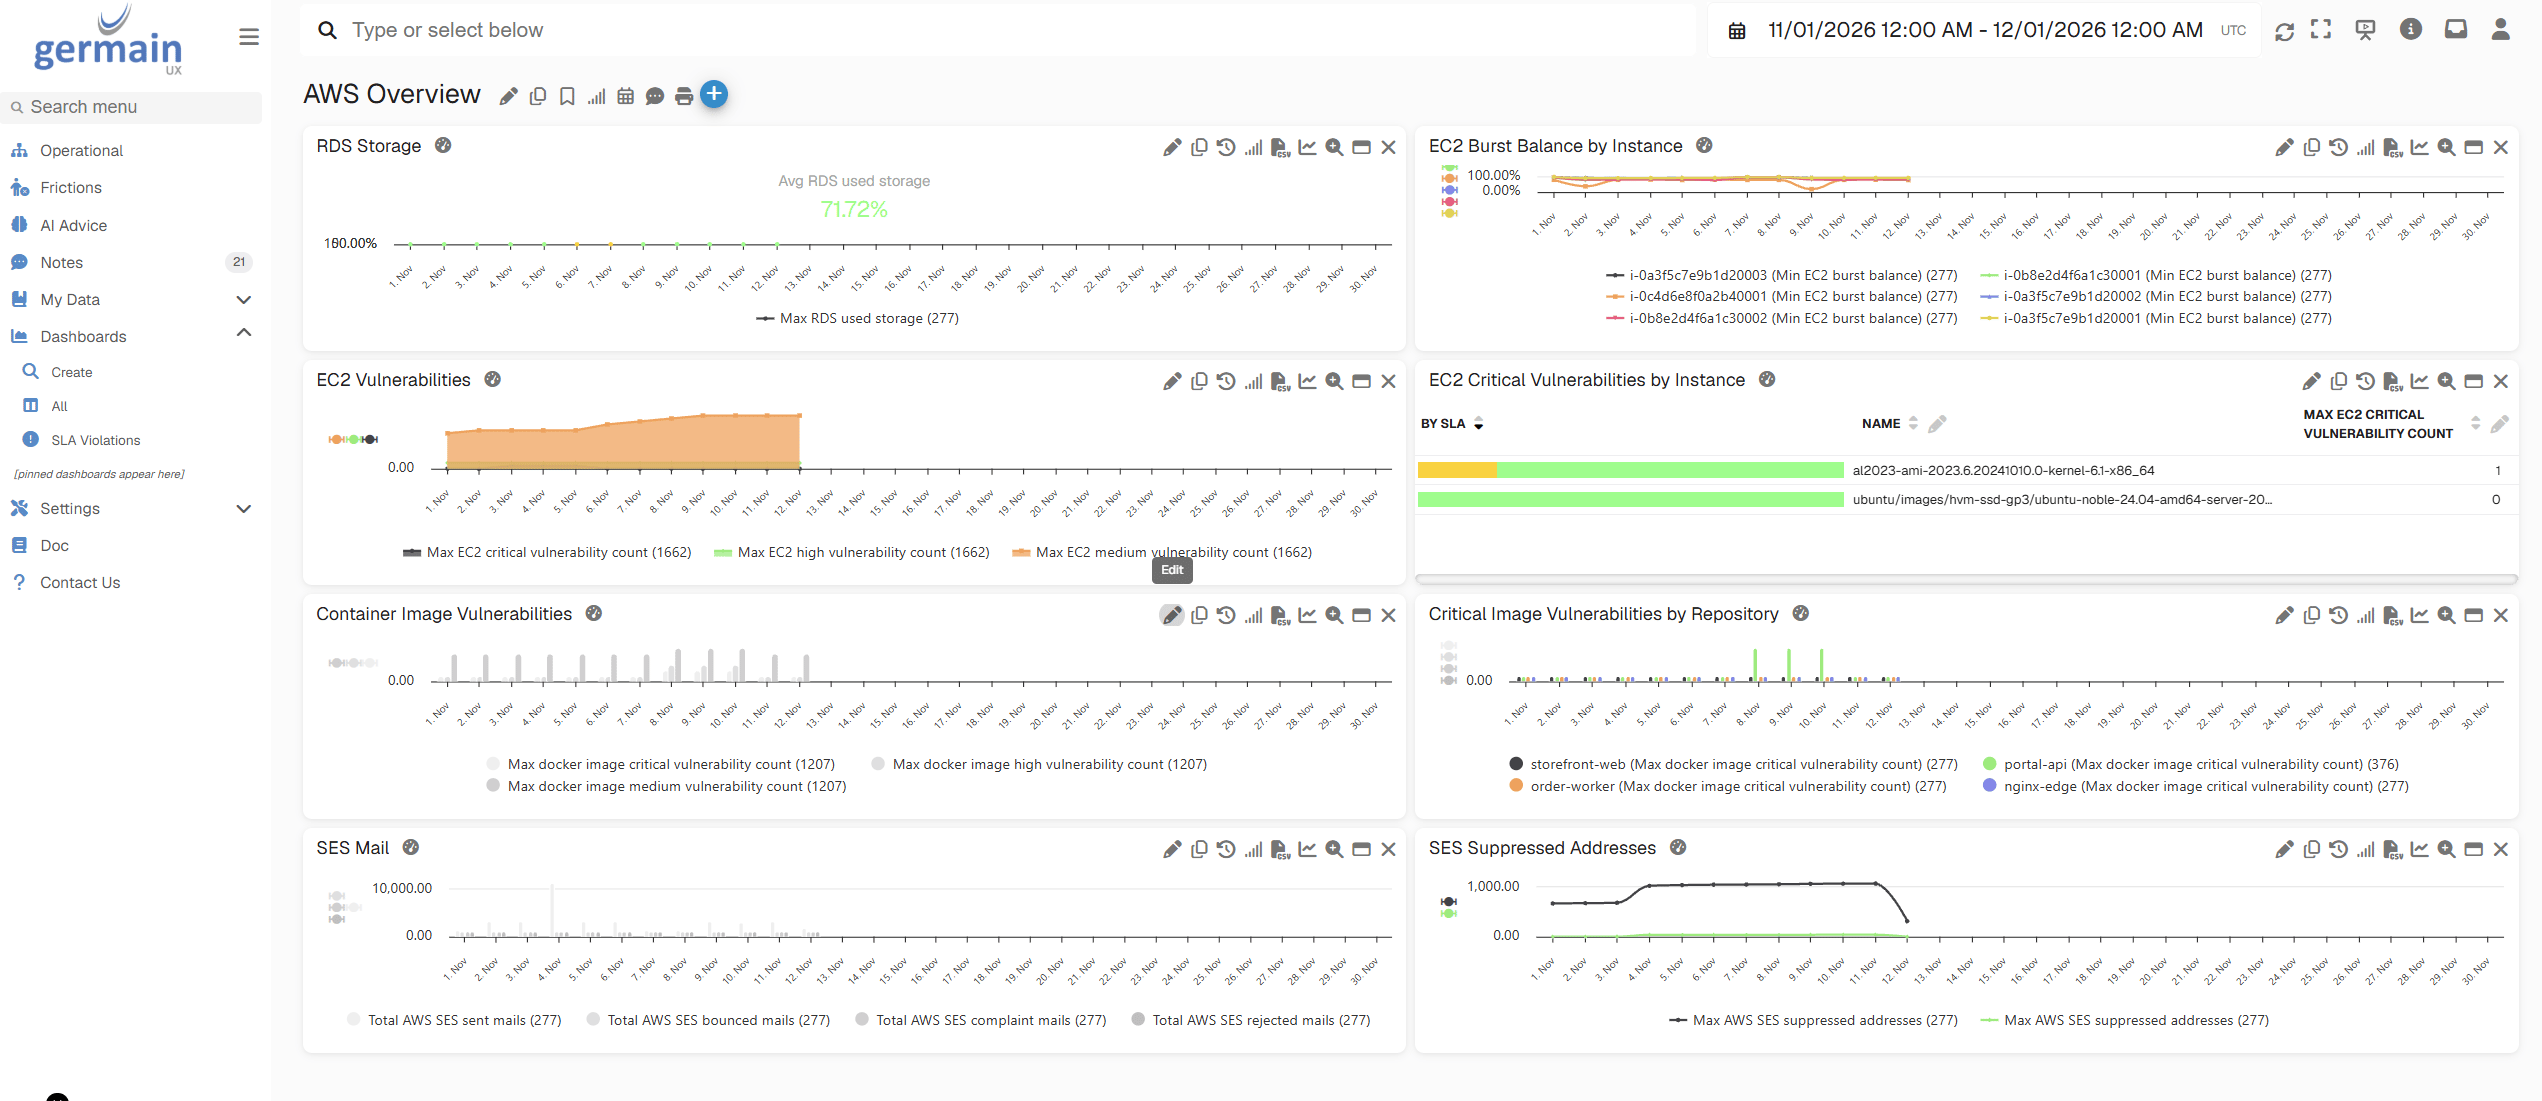
AWS Overview Dashboard - GermainUX
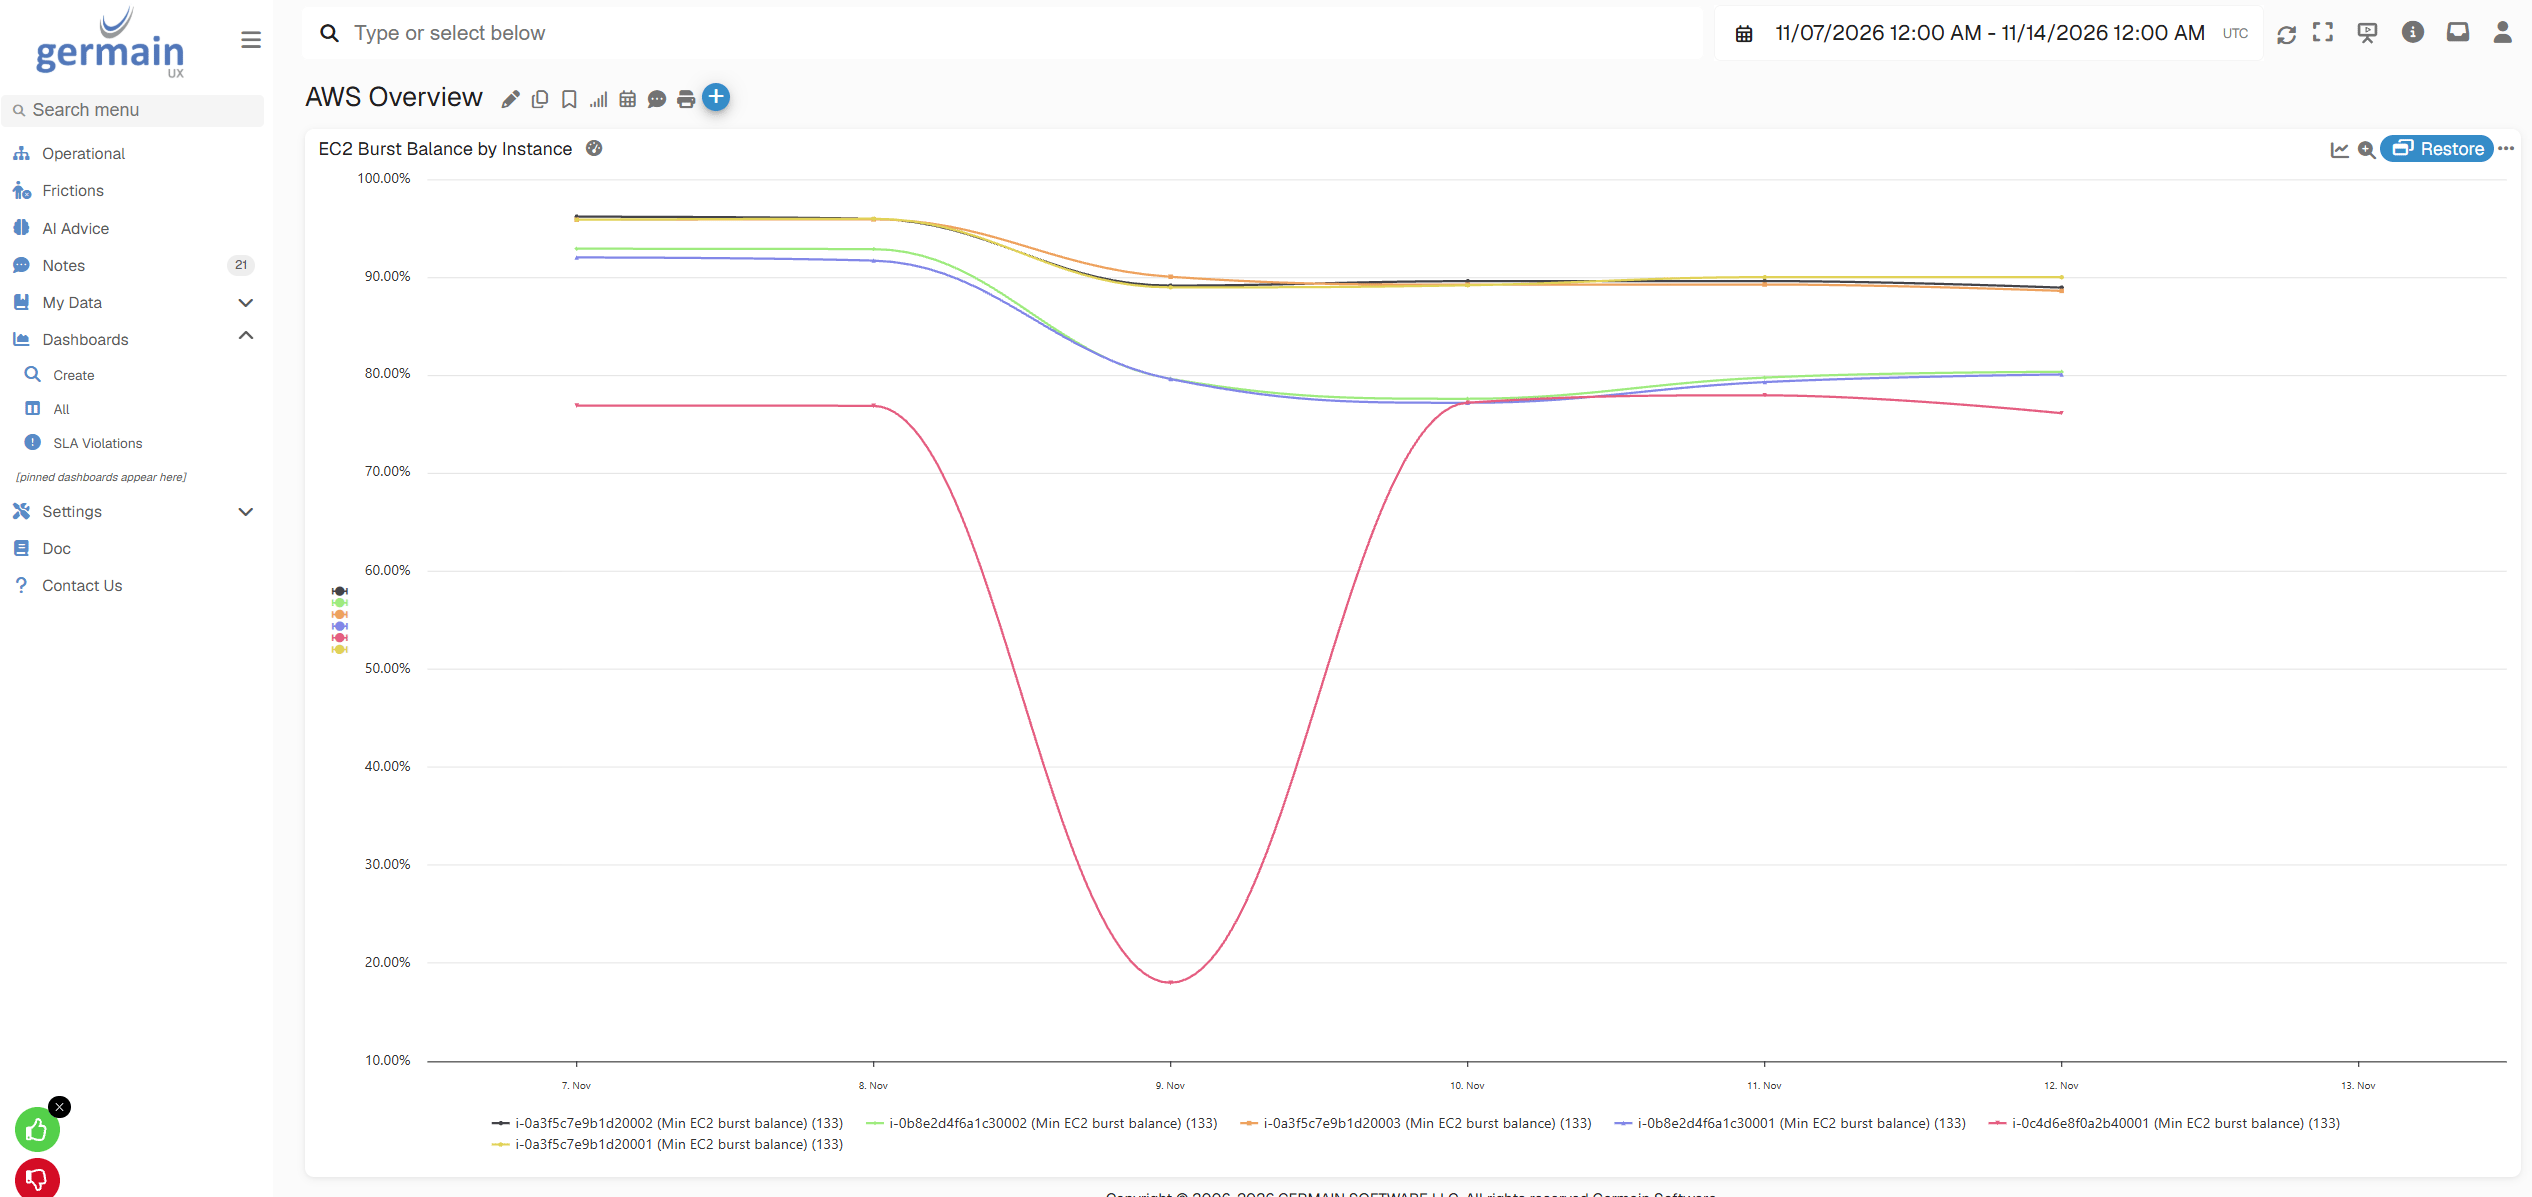
EC2 Burst Balance by Instance - GermainUX
Analysis
Click a value on the dashboard to open it in the Analysis screen. The aggregate view compares a KPI with the previous period and the last quarter, and shows its daily trend. It charts related KPIs, such as EC2 High Vulnerability Count next to EC2 Critical Vulnerability Count, and breaks the value down by AMI and by instance.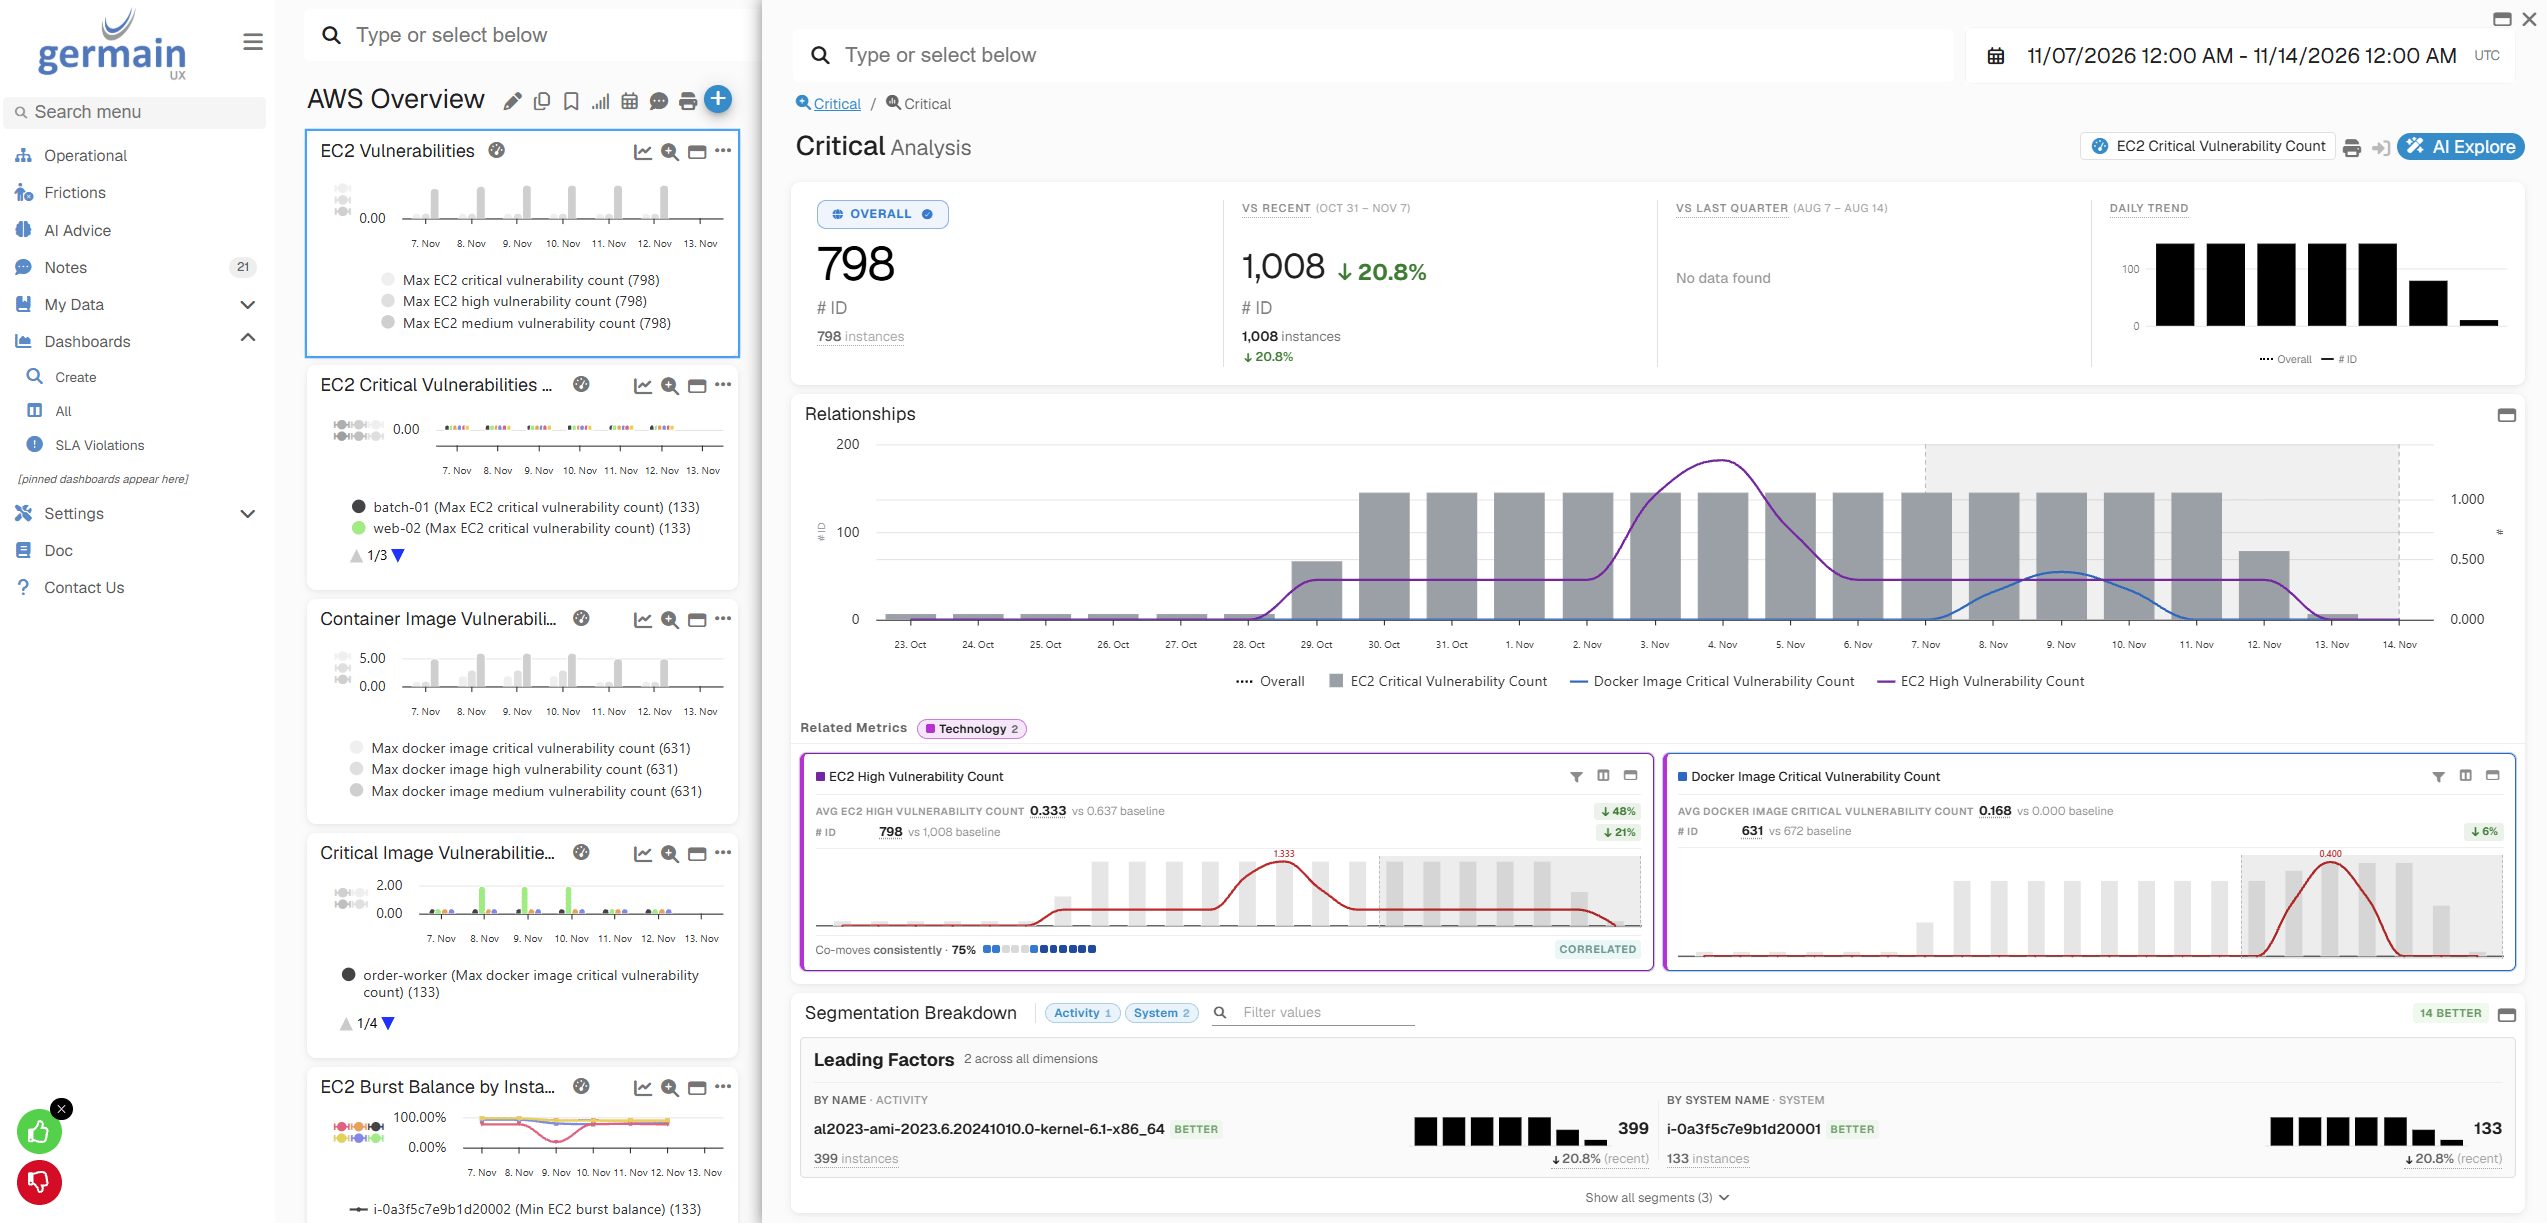
Aggregate Analysis of EC2 Critical Vulnerabilities - GermainUX
SLAs and Alerts
Every KPI ships with a default SLA, listed under KPIs. Send its violations as an alert by email, SMS, Slack or Teams. Outlier detection flags unusual spikes in bounces or complaints, and predictive SLAs forecast when RDS storage will cross its threshold.Automation
When an SLA is breached, an automated action can open a ticket in ServiceNow, call an HTTP endpoint or run a script.How It Works
AWS CLI on the EngineAWS APIsRulesKPIsSLAs and alerts
Each monitor is a Local Executor component that runs AWS CLI commands on the GermainUX Engine host, on the schedule you set when you deploy it. The AWS CLI uses the credentials and default region of the account the Engine runs as. A rule then turns the JSON output into KPI values.
Before You Start
- A GermainUX Engine is deployed. See GermainUX Engine.
- The AWS CLI v2 is installed on the Engine host and is on the
PATHof the Engine’s account. - The Engine’s account has AWS credentials and a default region. See Configure the AWS CLI.
- The Engine host can reach the AWS API endpoints over HTTPS.
- For vulnerabilities: Amazon Inspector scans EC2 and ECR in the account. See Getting Started with Amazon Inspector.
- For RDS: the Engine runs on Linux, because the AWS RDS Monitor uses
bashand GNUdate.
Deploy
1
Give the Engine read-only AWS access
Attach a policy with these read-only actions to the IAM role or user that the Engine’s AWS CLI profile uses. Keep only the statements for the monitors you deploy.When the Engine runs on EC2, use an instance role instead of access keys.
IAM Policy
2
Test the AWS CLI as the Engine's account
On the Engine host, as the account the Engine runs as, run the commands for the monitors you plan to deploy:Each command returns JSON. An
AccessDenied error means the policy is missing an action.3
Open the Local Executor Deployment wizard
In the left menu, go to Settings > Wizards. On the Local Executor Deployment card, click Add.
4
Choose the monitor
On the Monitoring step, fill in the fields, and then click Next.
5
Deploy it to the Engine
On the Deployment step, enter a Monitor Name, select the Monitoring Node and Engine, and set the schedule. The default,
0 0 * * * *, runs the monitor at the top of every hour, which matches the last-hour SES counts. Finish the wizard.6
Repeat for the other monitors
Run the wizard once for each monitor you want. GermainUX starts each one on its schedule.
Validate
1
Check that the monitors are deployed
In the left menu, go to Settings > Wizards. On the Local Executor Deployment card, click Manage, and check that your AWS monitors are listed.
2
Wait for the first run
With the default schedule, the monitors run at the top of the next hour.
3
Find the values in GermainUX
Open the KPIs for the monitors you deployed. EC2 Critical Vulnerability Count shows one value per instance, RDS Used Storage shows a percentage, and AWS SES Sent Mails shows the emails sent in the last hour. Compare them with the Amazon Inspector, RDS and SES consoles.
Troubleshooting
No AWS data appears
No AWS data appears
Run the commands from the test step on the Engine host, as the Engine’s account. If
aws isn’t found, add it to that account’s PATH. If a command fails with an access or region error, fix the credentials, the default region or the IAM policy. Then wait for the next scheduled run.The vulnerability KPIs stay empty
The vulnerability KPIs stay empty
Check that Amazon Inspector scanning is turned on for EC2 and ECR in the account and region that the AWS CLI uses. Inspector returns no aggregation for resources it doesn’t scan.
RDS values don't appear on a Windows Engine
RDS values don't appear on a Windows Engine
The AWS RDS Monitor runs its command through
bash with GNU date. Deploy it to an Engine on Linux.SES counts are zero, but email is being sent
SES counts are zero, but email is being sent
SES statistics are per region. Set the AWS CLI’s default region for the Engine’s account to the region you send email from.
The monitor times out
The monitor times out
Increase Read Timeout on the Monitoring step and redeploy. Large accounts with many findings take longer to return.
Security and Privacy
AWS monitoring data includes personal data:- Identity data: the email addresses on the SES suppression list, in the details of AWS SES Suppressed Addresses
- Resource names: EC2 instance
Nametags, AMI IDs and ECR repository names and tags, which can reveal internal system or customer names
KPIs
All KPIs use theGenericMetric data model. Each default SLA raises an alert after 5 violations in a row.
The pack also includes scheduled SLAs that check the past 24 hours for critical or high findings at 10:00 on weekdays: EC2 Critical Vulnerabilities SLA, EC2 High Vulnerability Count SLA and Docker Image Critical Vulnerabilities SLA. They’re turned off by default. Turn them on for a daily vulnerability check. See SLAs and KPIs.
Related Documentation
Amazon EC2
EC2 and EBS metrics from CloudWatch
SLAs
Thresholds and violations
Automation
More Automation Features
Get Help
The GermainUX team can help you monitor several AWS accounts or regions, or add other AWS services through the AWS CLI.Contact GermainUX Support
The GermainUX team helps you get up and running faster, empower your team, turn data into actionable insights, and optimize performance to deliver measurable business outcomes.
Can't Find What You Need?
Search all GermainUX docs with Ctrl + K, or use the feedback buttons at the bottom of this page to tell us what is missing.
The content of this document is proprietary to GERMAIN SOFTWARE.