GermainUX monitors the Hazelcast clusters your applications use for caching, sessions and shared data. For each member, you see how full its heap is, how many entries each map holds, and how much memory each map takes on that member. Three KPIs, default SLAs and a Hazelcast Overview dashboard come ready to use. Your team spots a map that grows without limit, or a member running short of heap, before it slows down or fails the applications that depend on it.
Heap per Member
Heap usage as a percentage of each member’s maximum heap, with an SLA at 75%.
Growth of Every Map
The number of entries in each of your maps, so a map without a time-to-live or a size limit stands out.
Memory per Map
The memory each map’s entries take on each member, to find which map is filling the heap.
Ready-Made Dashboard
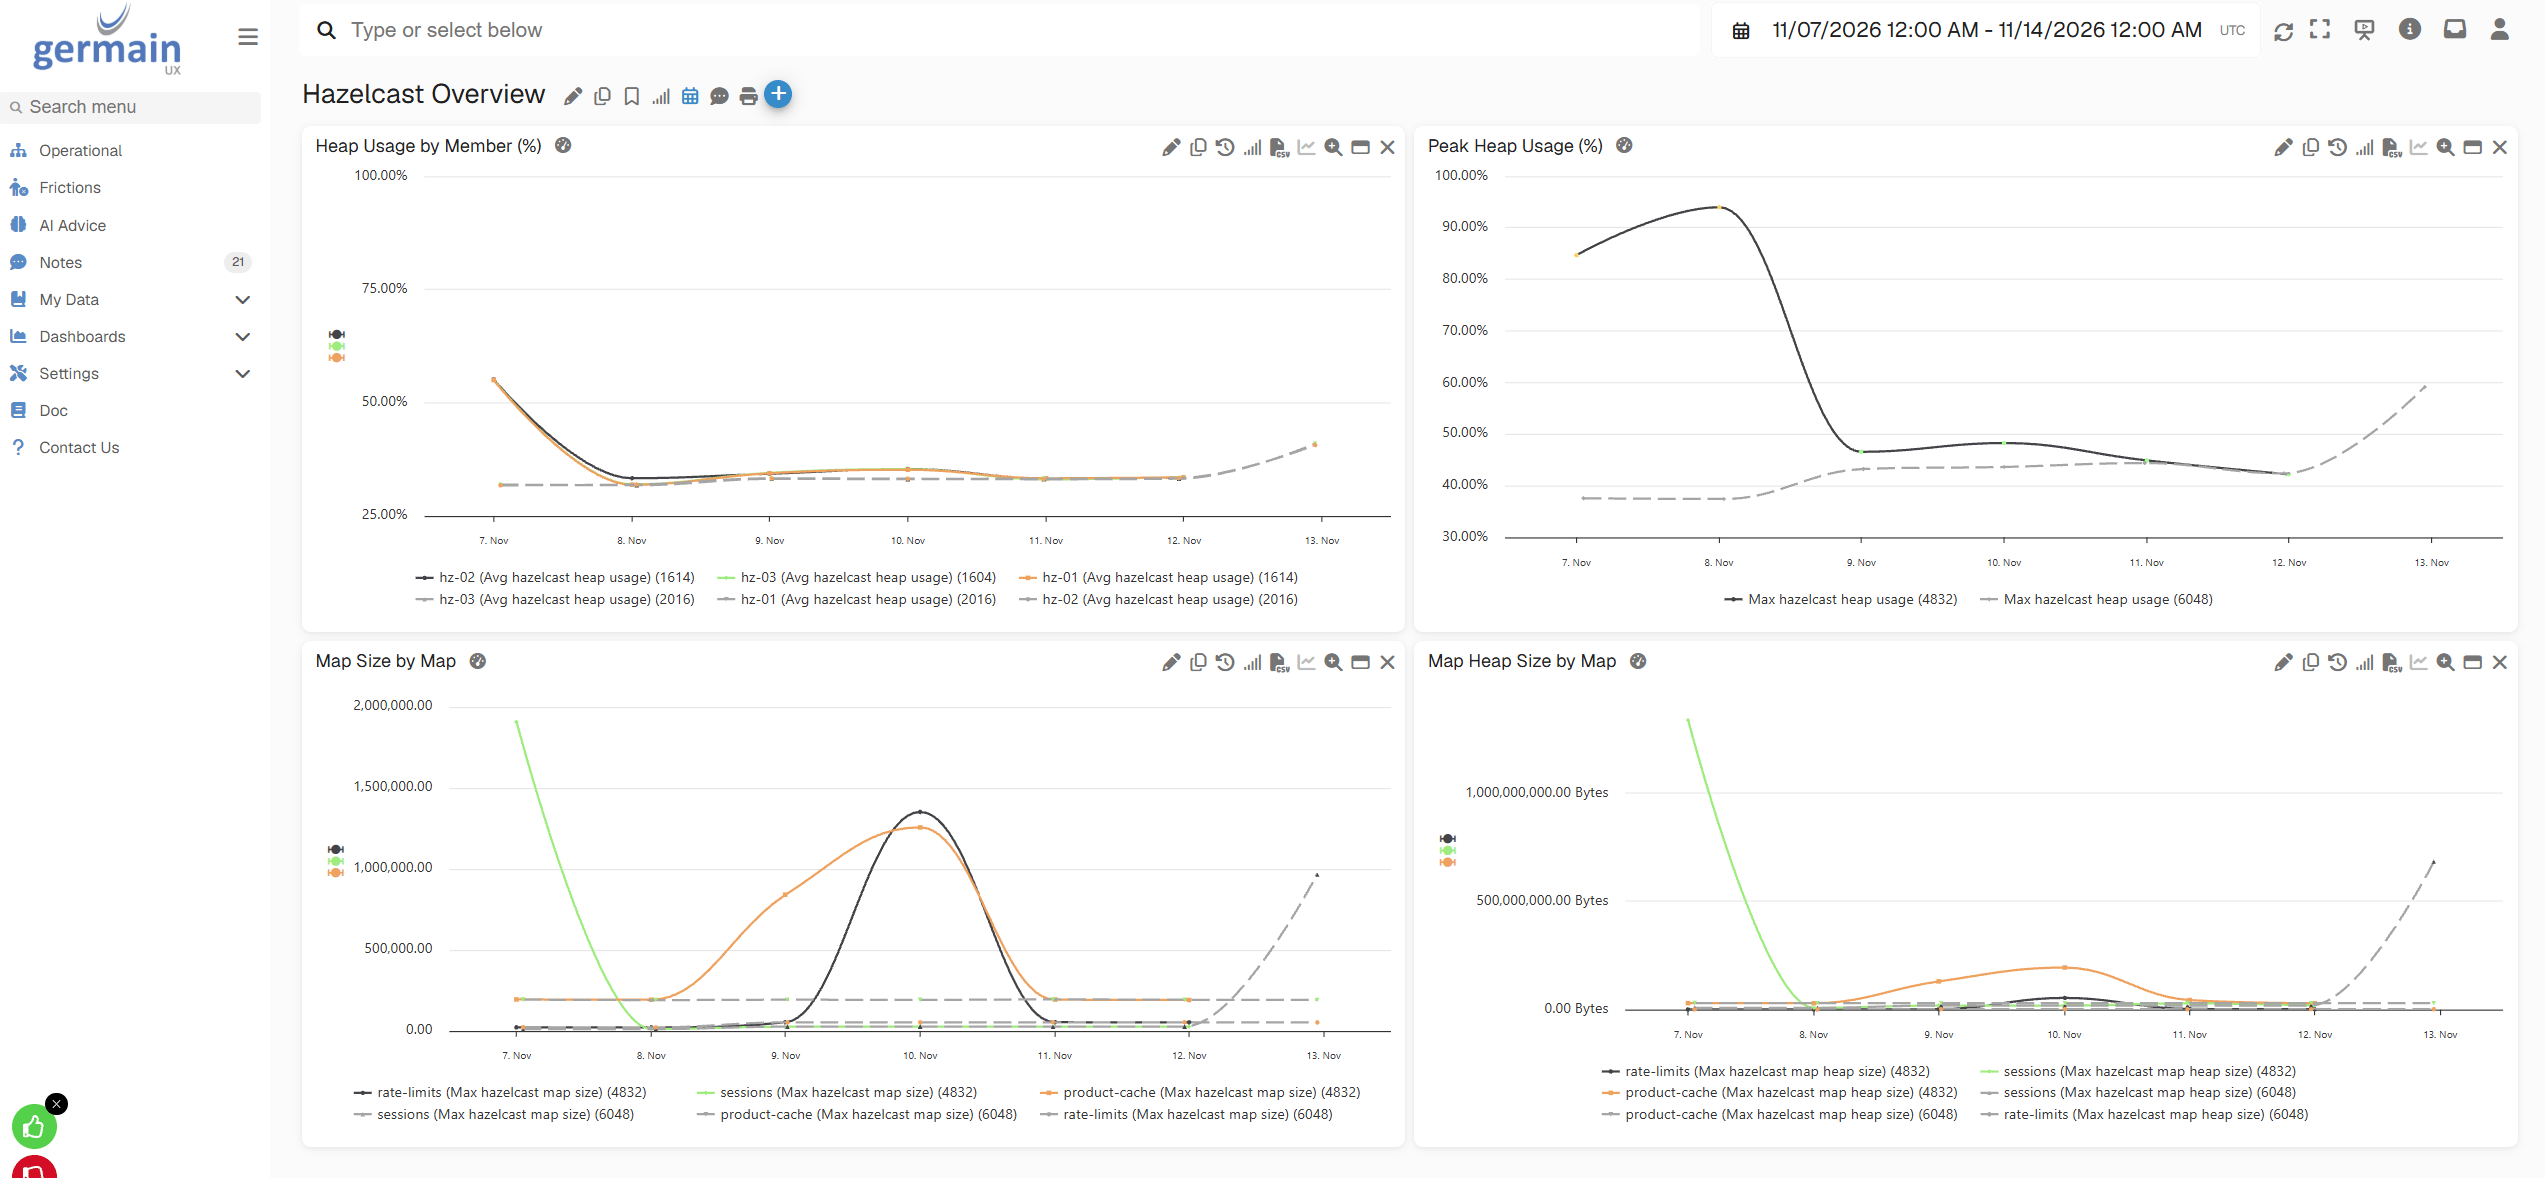
A Hazelcast Overview dashboard with heap usage, peak heap, map size and map memory charts.
Questions It Answers
Which Hazelcast member is closest to running out of heap?
Which map is growing fastest, and since when?
Which map takes the most memory on each member?
Did a release change how much data a map holds?
Is the data spread evenly across the members?
When did heap usage last stay above 75%?
What Is Monitored
Area
What GermainUX monitors
Heap
Used heap of each member as a percentage of its maximum heap, or of its committed heap when no maximum is set
Map size
The number of entries in each map. Hazelcast’s internal maps, whose names start with __, are skipped.
Map memory
The memory, in bytes, that each map’s entries take on each member
Availability
Up/down status and response time of member endpoints you can reach over HTTP, such as the health check endpoint, with synthetic HTTP checks
Host
CPU, memory, disk and network of the servers the members run on, and whether the member process is running. See Linux monitoring or Windows monitoring.
Ask AI Explore questions such as “Which Hazelcast maps grew the most this week?” Outlier detection flags a map or a member whose memory jumps outside its normal range.
Dashboards and Reports
In the left menu, select Dashboards > All, and then open the Hazelcast Overview dashboard. It has four charts: Heap Usage by Member (%), Peak Heap Usage (%), Map Size by Map and Map Heap Size by Map. Each chart compares the selected period with the previous one. Click a chart to open its KPI and pivot by member or map. You can build your own dashboards and reports on the same KPIs.
Hazelcast Overview Dashboard - GermainUX
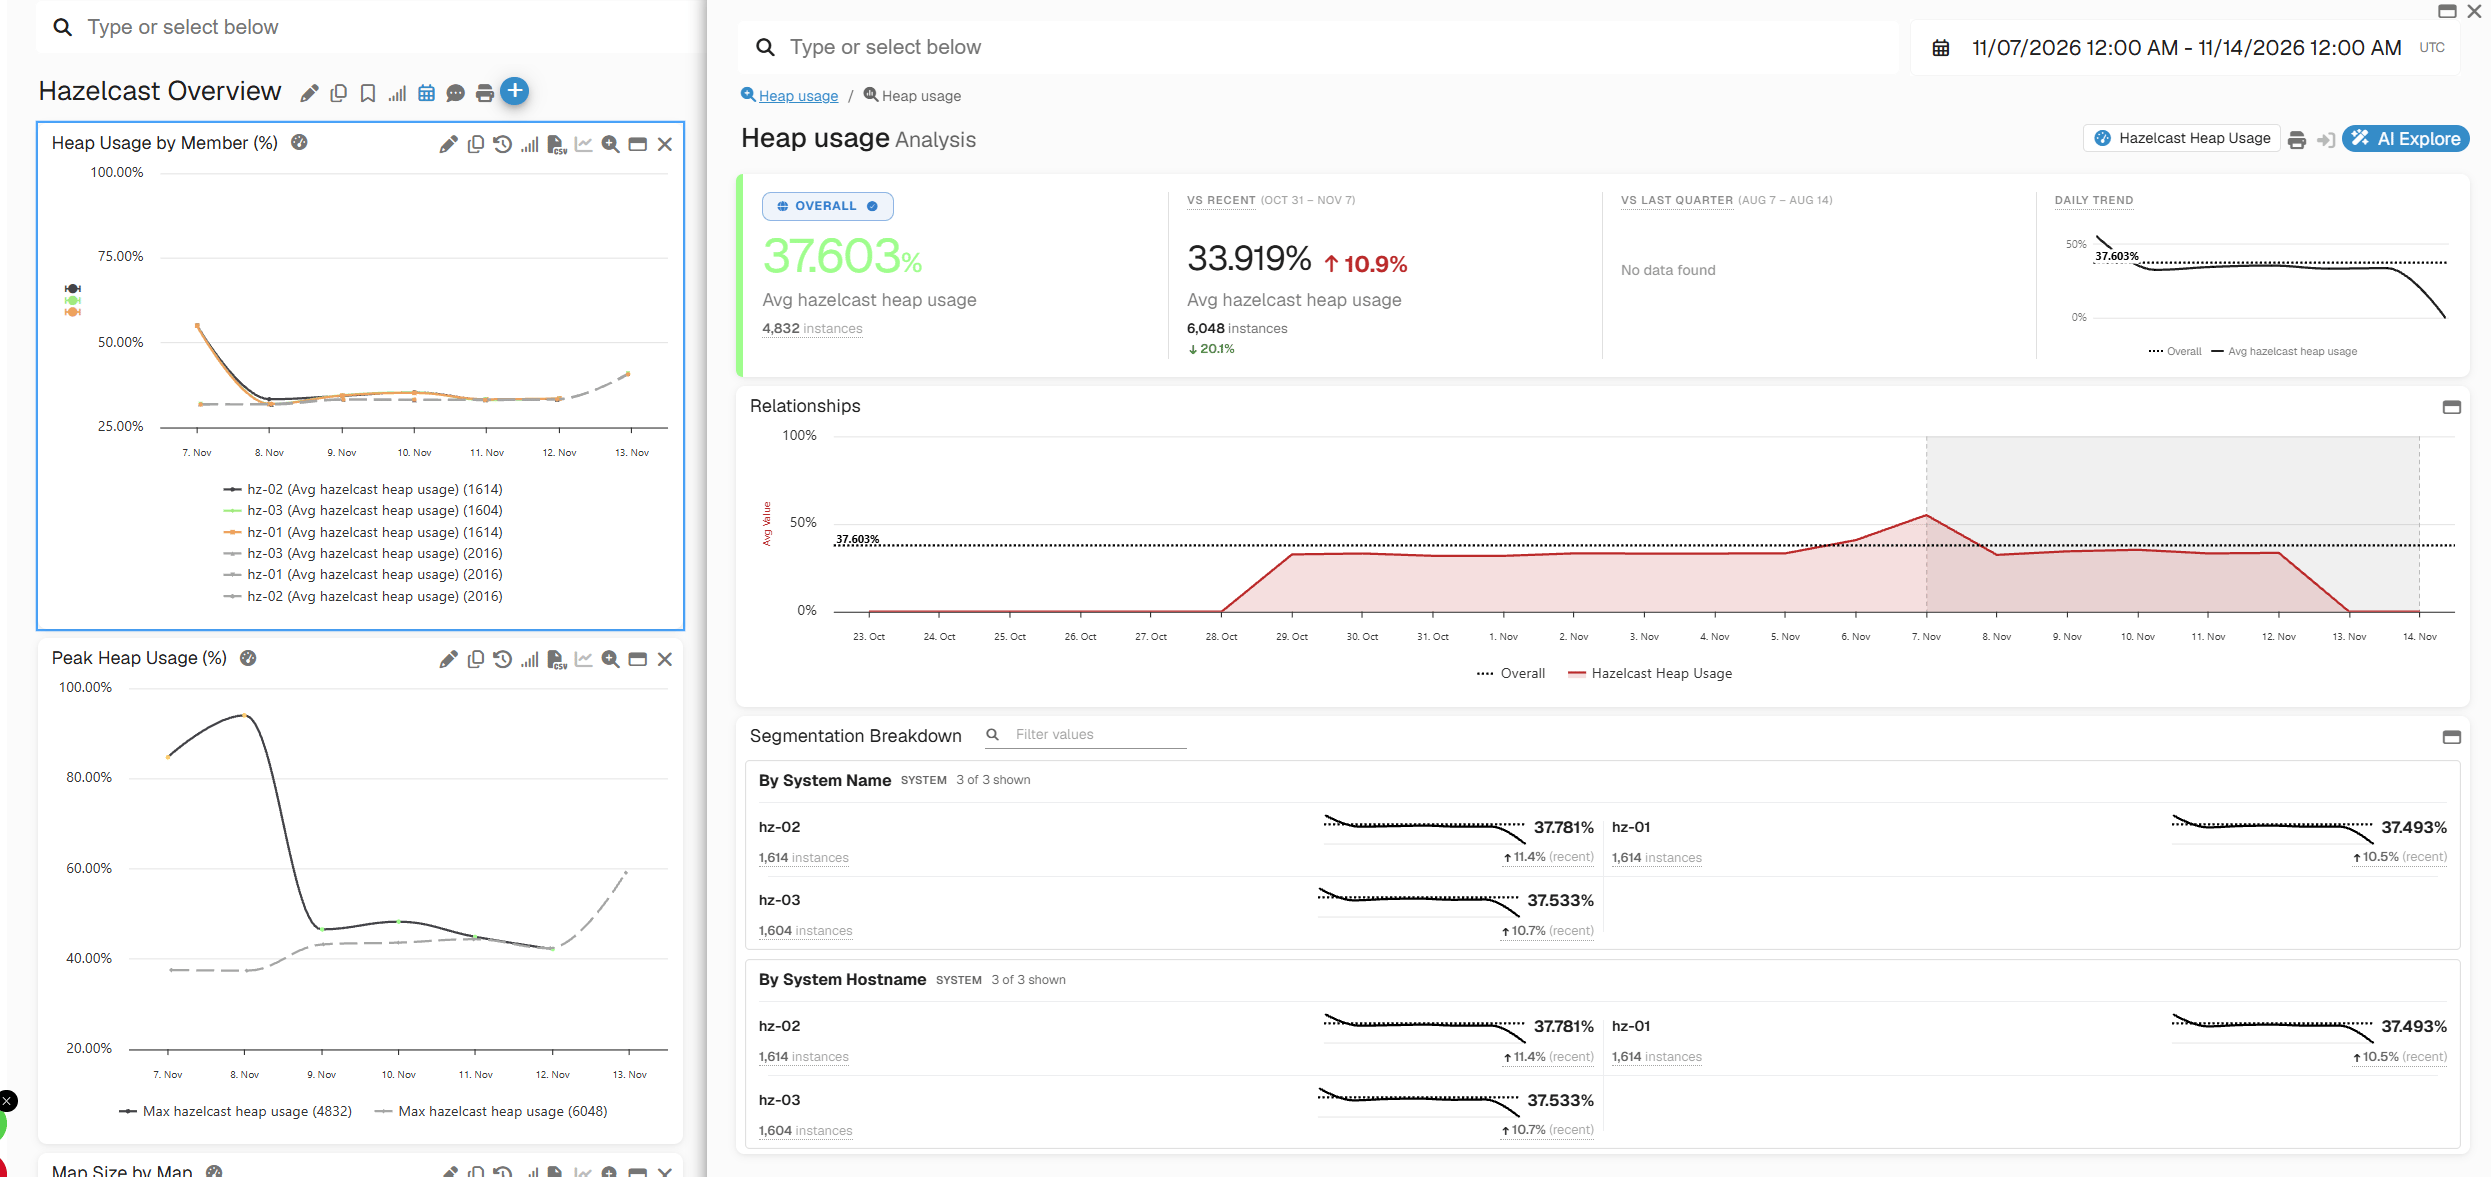
The analysis of a chart compares the period with the previous one and breaks the value down by member or map. For Heap Usage by Member (%), you see the average heap usage of each member and how much it changed.
Heap Usage Analysis by Member - GermainUX
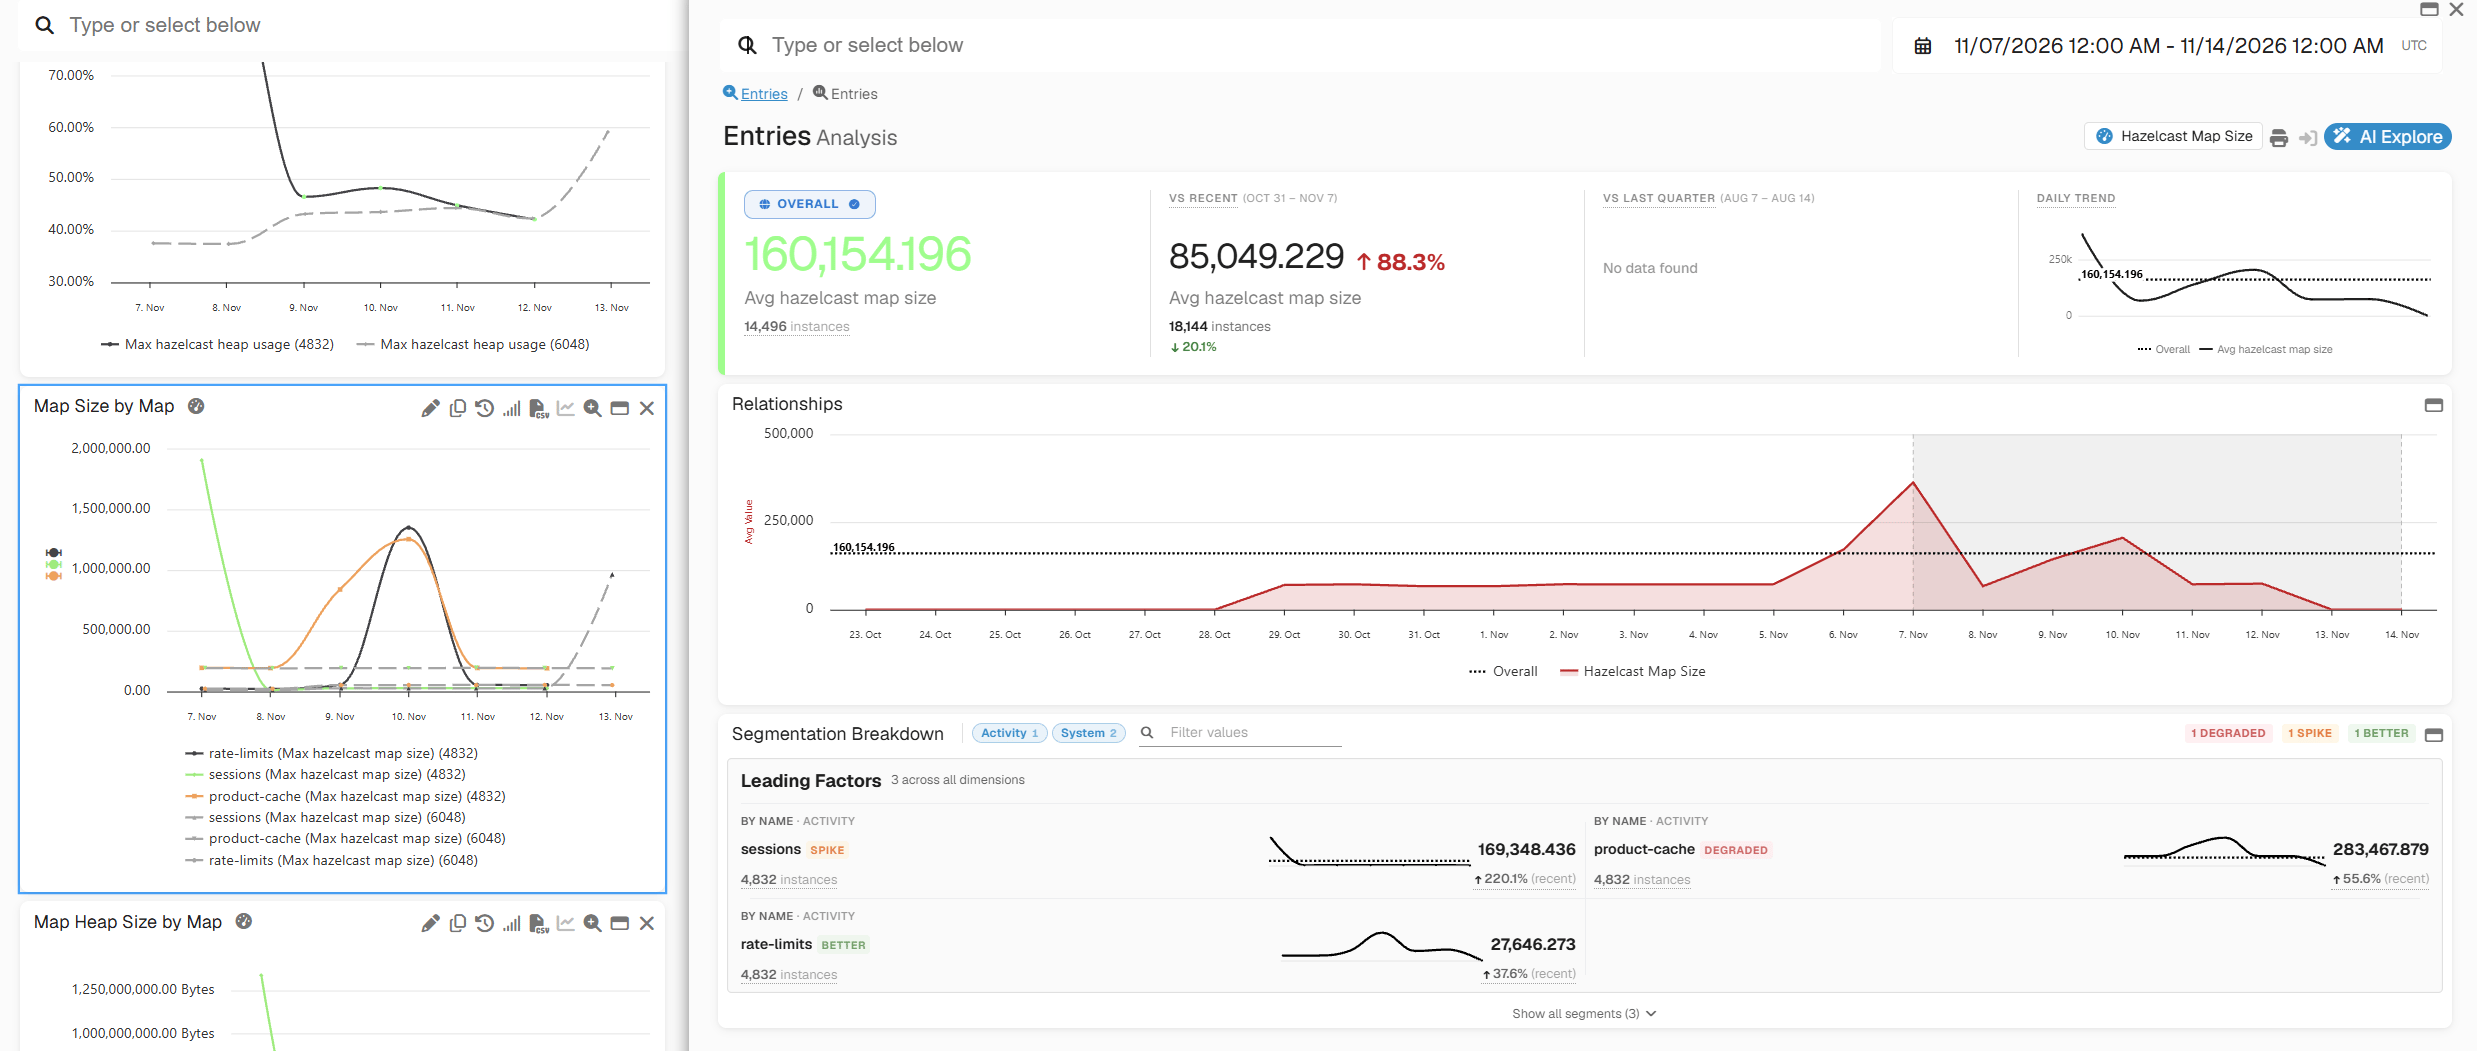
For Map Size by Map, the analysis lists the maps that changed the most, so a map that suddenly grows stands out.
Map Size Analysis by Map - GermainUX
SLAs and Alerts
Each KPI comes with a default SLA, listed under KPIs. Get an alert by email, SMS, Slack or Teams when a member’s heap or a map stays over its limit.
Automation
When an SLA is breached, an automated action can run a diagnostic script, call an HTTP endpoint or open an incident.
Runs on a GermainUX Engine and connects to one member over JMX on a schedule. It reads HeapMemoryUsage from java.lang:type=Memory, and size and localOwnedEntryMemoryCost from each com.hazelcast:type=IMap MBean.
Hazelcast rules
Turn each reading into a fact: heap usage as a percentage, and map size and map memory named after the map
Each member has its own JMX connection, so you deploy one monitor for each member. The member’s host becomes the system name, which is how the KPIs and SLAs tell the members apart.
Before You Start
A GermainUX Engine can reach the JMX port of every Hazelcast member.
You can change the configuration and JVM options of the members, and restart them.
You have a JMX user name and password for the members, if JMX authentication is on.
Firewalls allow the Engine to reach the JMX and RMI ports.
Deploy
1
Turn on JMX in Hazelcast
Set the hazelcast.jmx property on every member, in the member configuration:
Replace JMX_PORT with a free port, for example 9999, and MEMBER_HOST with the host name the Engine uses to reach the member. Turn on SSL when your security policy requires it.
3
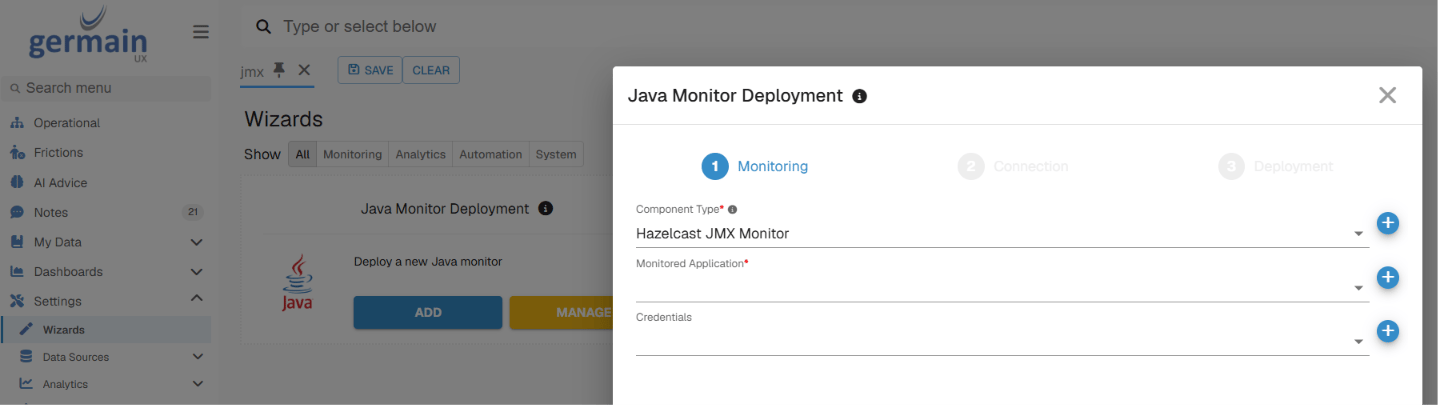
Open the Java Monitor Deployment wizard
In the left menu, go to Settings > Wizards. On the Java Monitor Deployment card, click Add.
4
Choose the Hazelcast monitor
On the Monitoring step, fill in the fields, and then click Next.
Field
Value
Component Type
Hazelcast JMX Monitor
Monitored Application
The application to file the data under, for example one named Hazelcast
Credentials
The JMX user name and password. Leave it empty when JMX authentication is off.
When the Engine runs on the same server as the member, you can enter an Application Pattern that matches the member’s Java process name instead, and GermainUX attaches to the local JVM.
6
Deploy it to the Engine
On the Deployment step, enter a Monitor Name, such as Hazelcast hz-01, select the Monitoring Node and Engine, and set the schedule. The default, 0 0 * * * *, runs once an hour. An SLA trips after 5 violations in a row, so use 0 */5 * * * * to read the member every 5 minutes. Finish the wizard.
7
Repeat for the other members
Run the wizard once for each member of the cluster.
Validate
1
Wait for the first run
The monitor reads the member at its next scheduled time, for example within 5 minutes with 0 */5 * * * *.
2
Open the Hazelcast dashboard
In the left menu, select Dashboards > All, and then open Hazelcast Overview. Heap Usage by Member (%) shows one line for each member you deployed.
3
Check the maps
Map Size by Map shows one line for each of your maps, with its entry count.
Troubleshooting
No data appears for a member
Check that the Engine can open a connection to the member’s JMX port, and that the port in the URI matches com.sun.management.jmxremote.port. When the member sits behind NAT or has several network interfaces, set java.rmi.server.hostname to the address the Engine uses, and set com.sun.management.jmxremote.rmi.port to the same port.
Heap usage appears, but no maps
The hazelcast.jmx property is off, so the member doesn’t publish its map MBeans. Set it to true and restart the member. Maps also appear only after the application has created them.
The connection fails with an authentication error
The credentials don’t match the JMX password file, or the user has no entry in the access file. Check both files on the member, and the Credentials selected in the wizard.
Map memory is missing for some maps
Hazelcast reports no memory cost for some map configurations. GermainUX skips readings without a memory value, so those maps show a size but no memory.
Security and Privacy
Hazelcast monitoring data includes:
System data: the host names of the members
Application data: the names of your maps
GermainUX reads sizes and memory figures only, not the entries stored in the maps.To mask, anonymize or exclude this data, see Data Privacy.
KPIs
KPI
What it holds
Default SLA
Hazelcast Heap Usage
Heap usage of each member, in percent
OK below 75, per member
Hazelcast Map Size
Number of entries in each map
OK below 1000000, per member and map
Hazelcast Map Heap Size
Memory taken by each map’s entries on a member, in bytes
OK below 104857600 (100 MB), per member and map
Each SLA is breached after 5 violations in a row. Change the thresholds to fit your cluster. See KPIs and SLAs.
Related Documentation
Java Monitoring
JVM metrics over JMX
Analytics
More Analytics Features
Automation
More Automation Features
Get Help
The GermainUX team can help you add other Hazelcast MBeans, such as queues, topics or partition data, to the monitor.
Contact GermainUX Support
The GermainUX team helps you get up and running faster, empower your team, turn data into actionable insights, and optimize performance to deliver measurable business outcomes.
Can't Find What You Need?
Search all GermainUX docs with Ctrl + K, or use the feedback buttons at the bottom of this page to tell us what is missing.
The content of this document is proprietary to GERMAIN SOFTWARE.
Was this page helpful?
{"docsConfig":{"theme":"mint","$schema":"https://mintlify.com/docs.json","name":"GermainUX Docs","description":"GermainUX is a real-time Operational Experience Intelligence platform that combines Monitoring + Analytics + AI + Automation to help organizations detect and resolve user, workflow, and technology issues faster, in order to 1)Improve CRM and ERP Adoption and Productivity 2)Increase eCommerce Conversion","colors":{"primary":"#2E7DF2","light":"#5B9CFF","dark":"#1A5FC8"},"logo":{"light":"https://mintcdn.com/germain-ux/ok7-BbqwVV0uk3t8/images/logo-light.png?fit=max\u0026auto=format\u0026n=ok7-BbqwVV0uk3t8\u0026q=85\u0026s=3cfe3238ac55802e43da3e4da5806f0d","dark":"https://mintcdn.com/germain-ux/ok7-BbqwVV0uk3t8/images/logo-dark.png?fit=max\u0026auto=format\u0026n=ok7-BbqwVV0uk3t8\u0026q=85\u0026s=1886121bf4312c96b6321ea733078b7f","href":"/"},"favicon":"https://mintcdn.com/germain-ux/Jw6D65yKWJ4U5yOS/images/favicon.png?fit=max\u0026auto=format\u0026n=Jw6D65yKWJ4U5yOS\u0026q=85\u0026s=bcc4dd08f0edb299e0b2af2f079f8526","appearance":{"default":"light"},"background":{"color":{"light":"#FFFFFF","dark":"#00112A"}},"navbar":{"links":[{"href":"https://germainux.atlassian.net/servicedesk/customer/portal/1","label":"Ticket"},{"href":"https://calendly.com/germainux","label":"Schedule"}],"primary":{"type":"button","label":"Contact GermainUX","href":"https://docs.germainux.com/getting-started/support"}},"footer":{"socials":{"website":"https://germainux.com"}},"seo":{"metatags":{"canonical":"https://docs.germainux.com","og:locale":"en_US","og:site_name":"GermainUX Docs","twitter:card":"summary_large_image"},"indexing":"navigable"},"styling":{"eyebrows":"section","latex":true},"integrations":{"gtm":{"tagId":"GTM-MRCBSV5R"}},"contextual":{"options":["view","chatgpt","claude"],"display":"header"},"navigation":{"pages":[]}},"deployment":{"deploymentMetadataValue":{"subdomain":"germain-ux","hasAudioNarration":false,"actualSubdomain":"germain-ux","customDomains":["docs.germainux.com"],"gitSource":{"type":"github","owner":"germainsoftware","repo":"germain-docs","deployBranch":"main","contentDirectory":"","isPrivate":true,"mountPath":"","label":"","_id":"6ae890c6c73aaa2ebb8f7a7f"},"feedback":{"contextualFeedback":{"allowEmail":true,"textInputOnly":false},"edits":false,"issues":false,"thumbs":true},"entitlements":{"AI_CHAT":{"status":"ENABLED"},"WEB_MCP":{"status":"ENABLED"},"NARRATION":{"status":"ENABLED"}},"buildId":"6af7aa96d270c5dd89838a77","clientVersion":"0.0.4138","searchFilterCounts":[{"language":"default","tag":"Documentation","count":498},{"language":"default","tag":"GermainUX Documentation","count":498},{"language":"default","tag":"Integrations","count":258},{"language":"default","tag":"Release Notes","count":81},{"language":"default","tag":"Archive","count":73},{"language":"default","tag":"Management","count":58},{"language":"default","tag":"Analytics","count":53},{"language":"default","tag":"Deploy GermainUX","count":53},{"language":"default","tag":"Automation","count":48},{"language":"default","tag":"Success Stories","count":34}],"searchSettings":{"fullPageSearch":true,"showContentSnippets":true}},"assistantConfig":{"enableAskAiButton":false,"enableStarterQuestions":false,"enableContextualStarterQuestions":false,"enableAskAiSearchBar":true},"basePath":"","hasChatPermissions":true,"hasWebMcpPermissions":true,"toggles":[],"googleFontsInlined":false},"customCss":[],"page":{"pagePath":"integrations/hazelcast-monitoring","slug":"/integrations/hazelcast-monitoring","pageMetadata":{"title":"Hazelcast Monitoring","sidebarTitle":"Hazelcast","description":"Watch heap pressure and map growth on every member of your Hazelcast cluster, and get alerted before a map runs a member out of memory.","icon":"plug","keywords":["Hazelcast","Hazelcast IMap","Hazelcast JMX","in-memory data grid"],"href":"/integrations/hazelcast-monitoring"},"description":{"compiledSource":"\"use strict\";\nconst {jsx: _jsx} = arguments[0];\nconst {useMDXComponents: _provideComponents} = arguments[0];\nfunction _createMdxContent(props) {\n const _components = {\n p: \"p\",\n ..._provideComponents(),\n ...props.components\n };\n return _jsx(_components.p, {\n children: \"Watch heap pressure and map growth on every member of your Hazelcast cluster, and get alerted before a map runs a member out of memory.\"\n });\n}\nfunction MDXContent(props = {}) {\n const {wrapper: MDXLayout} = {\n ..._provideComponents(),\n ...props.components\n };\n return MDXLayout ? _jsx(MDXLayout, {\n ...props,\n children: _jsx(_createMdxContent, {\n ...props\n })\n }) : _createMdxContent(props);\n}\nreturn {\n default: MDXContent\n};\n","frontmatter":{},"scope":{}},"pageType":"default","mdx":{"mdxSource":{"compiledSource":"\"use strict\";const{Fragment:_Fragment,jsx:_jsx,jsxs:_jsxs}=arguments[0];const{useMDXComponents:_provideComponents}=arguments[0];const GxFooter=()=>_jsx(`p`,{className:`gx-fine`,children:`The content of this document is proprietary to GERMAIN SOFTWARE.`});const GxStyle=()=>_jsx(`style`,{children:`\n.gx-meta { display:flex; flex-direction:column; gap:10px; margin:22px 0 6px; padding:16px 18px; border:1px solid rgba(15,23,42,.08); border-radius:16px; background:rgba(46,125,242,.035); font-size:13.5px; }\n.gx-meta-row { display:flex; flex-wrap:wrap; align-items:center; gap:6px; }\n.gx-meta-label { width:96px; flex:none; color:#64748b; }\n.dark .gx-meta-label { color:#94a3b8; }\n.gx-meta code { border-color:rgba(46,125,242,.25) !important; color:#1A5FC8 !important; background:rgba(46,125,242,.08) !important; }\n.dark .gx-meta { background:linear-gradient(135deg,rgba(46,125,242,.16),rgba(0,17,42,.4)); border-color:rgba(91,156,255,.22); }\n.dark .gx-meta code { color:#BFD6FF !important; background:rgba(91,156,255,.12) !important; border-color:rgba(91,156,255,.28) !important; }\n.gx-list ul { columns:2; column-gap:24px; list-style:none !important; padding-left:0 !important; margin:14px 0 0 !important; }\n.gx-list ul:has(> li:only-child) { columns:1; }\n.gx-list li { break-inside:avoid; position:relative; padding:4px 0 4px 22px !important; margin:0 !important; font-size:14.5px; }\n.gx-list li::marker { content:\"\"; }\n.gx-list li::before { content:\"\"; position:absolute; left:3px; top:13px; width:7px; height:7px; border-radius:50%; background:#2E7DF2; opacity:.75; }\n.dark .gx-list li::before { background:#5B9CFF; }\n.gx-flow { display:flex; flex-wrap:wrap; align-items:center; gap:10px 32px; margin:16px 0; }\n.gx-flow span { position:relative; display:inline-flex; align-items:center; padding:6px 12px; border-radius:8px; font-size:13.5px; font-weight:500; background:#fff; border:1px solid rgba(15,23,42,.12); color:#0f172a; box-shadow:0 1px 2px rgba(15,23,42,.05); }\n.gx-flow span:first-child, .gx-flow span:last-child { background:rgba(46,125,242,.08); border-color:rgba(46,125,242,.25); color:#1A5FC8; }\n.gx-flow span:not(:last-child)::after { content:\"\\\\2192\"; position:absolute; left:calc(100% + 9px); color:#94a3b8; font-weight:400; }\n.dark .gx-flow span { background:rgba(255,255,255,.03); border-color:rgba(255,255,255,.12); color:#e2e8f0; box-shadow:none; }\n.dark .gx-flow span:first-child, .dark .gx-flow span:last-child { background:rgba(91,156,255,.10); border-color:rgba(91,156,255,.28); color:#BFD6FF; }\n.dark .gx-flow span:not(:last-child)::after { color:#64748b; }\n#sidebar li[id] > a > div:first-child:has(> svg[aria-hidden]) { display: none; }\n#sidebar svg[style*=\"mask-image\"], #sidebar-content svg[style*=\"mask-image\"], #navigation-items svg[style*=\"mask-image\"], aside svg[style*=\"mask-image\"] { display: none !important; }\n#sidebar div:has(> svg[style*=\"mask-image\"]), #sidebar-content div:has(> svg[style*=\"mask-image\"]), #navigation-items div:has(> svg[style*=\"mask-image\"]), aside div:has(> svg[style*=\"mask-image\"]) { display: none !important; }\n.gx-fine { margin-top:56px; padding-top:20px; border-top:1px solid rgba(15,23,42,.08); font-size:13px; color:#64748b; }\n.dark .gx-fine { border-top-color:rgba(255,255,255,.08); color:#94a3b8; }\n.gx-fine p { margin:0 !important; font-size:13px !important; color:inherit !important; }\n.eyebrow { font-size:13px !important; font-weight:700 !important; letter-spacing:.12em !important; text-transform:uppercase; color:#2E7DF2 !important; display:inline-flex; align-items:center; gap:8px; padding:4px 12px; border-radius:999px; background:rgba(46,125,242,.10); border:1px solid rgba(46,125,242,.25); height:auto !important; margin-bottom:6px; }\n.dark .eyebrow { color:#8DB8FF !important; background:rgba(91,156,255,.12); border-color:rgba(91,156,255,.30); }\n#page-title { letter-spacing:-.02em; }\n.dark #page-title { background:linear-gradient(90deg,#FFFFFF 0%,#BFD6FF 100%); -webkit-background-clip:text; background-clip:text; -webkit-text-fill-color:transparent; }\n.mdx-content h2:not(.not-prose) { position:relative; padding-left:16px; }\n.mdx-content h2:not(.not-prose)::before { content:\"\"; position:absolute; left:0; top:.2em; bottom:.2em; width:4px; border-radius:4px; background:linear-gradient(180deg,#2E7DF2,#5B9CFF); }\n.dark table th { color:#BFD6FF; }\n.dark table td:first-child { color:#FFFFFF; font-weight:500; }\n@media (max-width: 820px) { .gx-list ul { columns:1; } }\n.gx-list-more:not(.is-open) > ul > li:nth-child(n+11) { display:none; }\n.gx-more-toggle { display:inline-flex; align-items:center; gap:6px; margin:8px 0 12px 22px; padding:0; border:0; background:none; cursor:pointer; font-size:14px; font-weight:600; color:#1A5FC8; }\n.gx-more-toggle:hover { text-decoration:underline; }\n.gx-more-toggle::after { content:\"\\\\25BE\"; display:inline-block; font-size:12px; transition:transform .15s; }\n.gx-list-more.is-open .gx-more-toggle::after { transform:rotate(180deg); }\n.dark .gx-more-toggle { color:#8DB8FF; }\n/* === Concept #1: hero header + numbered section tiles === */\n#content-area { counter-reset: gxsec; }\n#header { position:relative; overflow:hidden; padding:36px 30px 24px; border-radius:24px; border:1px solid rgba(91,156,255,.22); background:radial-gradient(800px 300px at 100% 0%, rgba(46,125,242,.32), transparent 65%), #0B2147; }\n#header::before { content:\"\"; position:absolute; inset:0; pointer-events:none; background-image:linear-gradient(rgba(255,255,255,.045) 1px,transparent 1px),linear-gradient(90deg,rgba(255,255,255,.045) 1px,transparent 1px); background-size:34px 34px; -webkit-mask-image:linear-gradient(100deg,transparent 15%,#000 75%); mask-image:linear-gradient(100deg,transparent 15%,#000 75%); }\n#header > * { position:relative; }\n#header #page-title { color:#fff !important; -webkit-text-fill-color:#fff !important; background:none !important; font-size:clamp(1.9rem,3.4vw,2.6rem) !important; line-height:1.06 !important; font-weight:800 !important; letter-spacing:-.035em !important; }\n#header .prose, #header .prose p, #header p { color:rgba(222,233,255,.82) !important; font-size:1.06rem; line-height:1.6; }\n#header .eyebrow { color:#BFD6FF !important; background:rgba(91,156,255,.14) !important; border-color:rgba(91,156,255,.32) !important; }\n#header button, #header [role=\"button\"] { color:#DCE8FF !important; border-color:rgba(191,214,255,.25) !important; background:rgba(255,255,255,.04) !important; }\n#content-area:has(#content > .gx-meta:first-child) #header { border-radius:24px 24px 0 0; border-bottom:0; padding-bottom:18px; }\n#content:has(> .gx-meta:first-child) { margin-top:0 !important; }\n#content > .gx-meta:first-child { margin:0 !important; padding:4px 30px 28px !important; border-radius:0 0 24px 24px !important; border:1px solid rgba(91,156,255,.22) !important; border-top:0 !important; background:#0B2147 !important; }\n#content > .gx-meta:first-child:has(+ .columns) { border-radius:0 !important; border-bottom:0 !important; padding-bottom:18px !important; }\n#content > .gx-meta:first-child + .columns { margin:0 0 8px !important; padding:4px 30px 30px !important; border:1px solid rgba(91,156,255,.22); border-top:0; border-radius:0 0 24px 24px; background:#0B2147; gap:12px !important; }\n#content > .gx-meta:first-child + .columns > * { background:rgba(255,255,255,.035) !important; border-color:rgba(91,156,255,.28) !important; border-radius:16px !important; }\n#content > .gx-meta:first-child + .columns h2, #content > .gx-meta:first-child + .columns [data-component-part=\"card-title\"] { color:#fff !important; font-size:15px !important; overflow-wrap:normal !important; word-break:normal !important; }\n#content > .gx-meta:first-child + .columns p, #content > .gx-meta:first-child + .columns [data-component-part=\"card-content\"] { color:rgba(214,226,250,.7) !important; }\n#content > .gx-meta:first-child + .columns svg { background-color:#5B9CFF !important; }\n#content > .gx-meta:first-child .gx-meta-label { color:rgba(191,214,255,.6) !important; }\n#content > .gx-meta:first-child code { font-family:inherit !important; font-weight:600 !important; font-size:12.5px !important; padding:5px 13px !important; border-radius:999px !important; color:#DCE8FF !important; background:rgba(46,125,242,.14) !important; border:1px solid rgba(91,156,255,.55) !important; }\n#content > .gx-meta:first-child a { text-decoration:none !important; border:0 !important; }\n#content > .gx-meta:first-child a:not(:has(code)) { color:#BFD6FF !important; font-weight:600; }\n#content > .gx-meta:first-child .gx-meta-row > span:not(.gx-meta-label) { color:#86EFAC !important; background:rgba(34,197,94,.14) !important; border-color:rgba(134,239,172,.35) !important; }\n.mdx-content > h2:not(.not-prose), #content > h2 { counter-increment:gxsec; display:flex !important; align-items:center; gap:14px; padding-left:0 !important; margin-top:2.6em !important; font-weight:750; letter-spacing:-.02em; }\n.mdx-content > h2:not(.not-prose)::before, #content > h2::before { content:counter(gxsec, decimal-leading-zero) !important; position:static !important; flex:none; width:40px; height:40px; border-radius:12px; display:inline-flex; align-items:center; justify-content:center; font-size:13px; font-weight:700; letter-spacing:0; color:#fff; background:linear-gradient(135deg,#2E7DF2,#5B9CFF) !important; box-shadow:0 6px 18px rgba(46,125,242,.35); }\n@media (max-width:820px) { #header, #content > .gx-meta:first-child, #content > .gx-meta:first-child + .columns { padding-left:20px !important; padding-right:20px !important; } }\n#content-area:has(#content > .columns:first-child) #header { border-radius:24px 24px 0 0; border-bottom:0; padding-bottom:18px; }\n#content:has(> .columns:first-child) { margin-top:0 !important; }\n#content > .columns:first-child { margin:0 0 8px !important; padding:4px 30px 30px !important; border:1px solid rgba(91,156,255,.22); border-top:0; border-radius:0 0 24px 24px; background:#0B2147; gap:12px !important; }\n#content > .columns:first-child > * { background:rgba(255,255,255,.035) !important; border-color:rgba(91,156,255,.28) !important; border-radius:16px !important; }\n#content > .columns:first-child h2, #content > .columns:first-child [data-component-part=\"card-title\"] { color:#fff !important; font-size:15px !important; overflow-wrap:normal !important; word-break:normal !important; }\n#content > .columns:first-child p, #content > .columns:first-child [data-component-part=\"card-content\"] { color:rgba(214,226,250,.7) !important; }\n#content > .columns:first-child svg { background-color:#5B9CFF !important; }\n/* === Shell: concept #1 (top bar, menus, page) === */\n#navbar, #navbar-transition, #navbar > div { background:#00112A !important; }\n#navbar { border-bottom:1px solid rgba(91,156,255,.18) !important; }\n#navbar a, #navbar button, #navbar .nav-tabs-item { color:rgba(220,232,255,.78) !important; }\n#navbar a:hover, #navbar button:hover, #navbar .nav-tabs-item[data-active=\"true\"] { color:#FFFFFF !important; }\n#navbar a[class*=\"bg-primary\"], #navbar a[class*=\"bg-primary\"] * { color:#FFFFFF !important; }\n#navbar a[href=\"/\"], #navbar a[href=\"/\"] * { color:#FFFFFF !important; }\n#search-bar-entry { background:rgba(255,255,255,.06) !important; border:1px solid rgba(255,255,255,.14) !important; box-shadow:none !important; }\n#search-bar-entry, #search-bar-entry * { color:rgba(220,232,255,.72) !important; }\nhtml:not(.dark) #navbar img[src*=\"logo-light\"] { display:none !important; }\nhtml:not(.dark) #navbar img[src*=\"logo-dark\"] { display:block !important; }\nhtml:not(.dark) #sidebar, html:not(.dark) #sidebar-content { background:#FFFFFF !important; }\nhtml:not(.dark) #sidebar { border-right:1px solid #E6ECF5 !important; }\n#navigation-items .sidebar-group-header { font-size:11.5px !important; letter-spacing:.08em; text-transform:uppercase; }\nhtml:not(.dark) #navigation-items .sidebar-group-header { color:#0B1B33 !important; }\n#navigation-items a { font-size:13.5px !important; border-radius:10px !important; }\nhtml:not(.dark) #navigation-items a { color:#4A5A75 !important; }\nhtml:not(.dark) #navigation-items a:hover { background:#F1F5FC !important; color:#0B1B33 !important; }\n#navigation-items li[data-active] > a, #navigation-items a[aria-current=\"page\"], #navigation-items a[class*=\"bg-primary\"] { background:#EAF2FF !important; color:#1A5FC8 !important; font-weight:600 !important; box-shadow:inset 3px 0 0 #2E7DF2; }\n.dark #navigation-items li[data-active] > a, .dark #navigation-items a[aria-current=\"page\"], .dark #navigation-items a[class*=\"bg-primary\"] { background:rgba(46,125,242,.16) !important; color:#BFD6FF !important; }\nhtml:not(.dark) #table-of-contents a { color:#5B6B85; }\nhtml:not(.dark) .mdx-content h2, html:not(.dark) .mdx-content h3 { color:#0B1B33; }\nhtml:not(.dark) .mdx-content p, html:not(.dark) .mdx-content li { color:#33415C; }\n`});function _createMdxContent(props){const _components={a:`a`,code:`code`,li:`li`,p:`p`,pre:`pre`,span:`span`,strong:`strong`,tbody:`tbody`,td:`td`,th:`th`,thead:`thead`,tr:`tr`,ul:`ul`,..._provideComponents(),...props.components},{Accordion,AccordionGroup,Badge,Card,CardGroup,CodeBlock,Frame,Heading,OptimizedImage,Step,Steps,Table,_MdxComponentBoundary}=_components;if(!Accordion)_missingMdxReference(`Accordion`,true);if(!AccordionGroup)_missingMdxReference(`AccordionGroup`,true);if(!Badge)_missingMdxReference(`Badge`,true);if(!Card)_missingMdxReference(`Card`,true);if(!CardGroup)_missingMdxReference(`CardGroup`,true);if(!CodeBlock)_missingMdxReference(`CodeBlock`,true);if(!Frame)_missingMdxReference(`Frame`,true);if(!Heading)_missingMdxReference(`Heading`,true);if(!OptimizedImage)_missingMdxReference(`OptimizedImage`,true);if(!Step)_missingMdxReference(`Step`,true);if(!Steps)_missingMdxReference(`Steps`,true);if(!Table)_missingMdxReference(`Table`,true);if(!_MdxComponentBoundary)_missingMdxReference(`_MdxComponentBoundary`,true);return _jsxs(_Fragment,{children:[_jsxs(`div`,{className:`gx-meta`,children:[_jsxs(`div`,{className:`gx-meta-row`,children:[_jsx(`span`,{className:`gx-meta-label`,children:`Components`}),_jsx(_components.a,{href:`/deploy/germain-ux-engine`,children:_jsx(`code`,{children:`Engine`})})]}),_jsxs(`div`,{className:`gx-meta-row`,children:[_jsx(`span`,{className:`gx-meta-label`,children:`Availability`}),_jsx(Badge,{color:`green`,children:`2024.1 or later`})]})]}),`\n`,_jsxs(CardGroup,{cols:4,children:[_jsx(Card,{title:`What Is Monitored`,icon:`binoculars`,href:`#what-is-monitored`,children:_jsx(_components.p,{children:`Heap, map size, map memory`})}),_jsx(Card,{title:`How It Works`,icon:`gears`,href:`#how-it-works`,children:_jsx(_components.p,{children:`JMX monitor per member`})}),_jsx(Card,{title:`Deploy`,icon:`rocket`,href:`#deploy`,children:_jsx(_components.p,{children:`Enable JMX, run the wizard`})}),_jsx(Card,{title:`KPIs`,icon:`gauge`,href:`#kpis`,children:_jsx(_components.p,{children:`Three KPIs with SLAs`})})]}),`\n`,_jsx(Heading,{level:`2`,id:`overview`,children:`Overview`}),`\n`,_jsxs(_components.p,{children:[`GermainUX monitors the Hazelcast clusters your applications use for caching, sessions and shared data. For each member, you see how full its heap is, how many entries each map holds, and how much memory each map takes on that member. Three KPIs, default SLAs and a `,_jsx(_components.strong,{children:`Hazelcast Overview`}),` dashboard come ready to use. Your team spots a map that grows without limit, or a member running short of heap, before it slows down or fails the applications that depend on it.`]}),`\n`,_jsxs(CardGroup,{cols:2,children:[_jsx(Card,{title:`Heap per Member`,icon:`memory`,children:_jsx(_components.p,{children:`Heap usage as a percentage of each member’s maximum heap, with an SLA at 75%.`})}),_jsx(Card,{title:`Growth of Every Map`,icon:`chart-line`,children:_jsx(_components.p,{children:`The number of entries in each of your maps, so a map without a time-to-live or a size limit stands out.`})}),_jsx(Card,{title:`Memory per Map`,icon:`database`,children:_jsx(_components.p,{children:`The memory each map’s entries take on each member, to find which map is filling the heap.`})}),_jsx(Card,{title:`Ready-Made Dashboard`,icon:`chart-column`,children:_jsxs(_components.p,{children:[`A `,_jsx(_components.strong,{children:`Hazelcast Overview`}),` dashboard with heap usage, peak heap, map size and map memory charts.`]})})]}),`\n`,_jsx(Heading,{level:`3`,id:`questions-it-answers`,children:`Questions It Answers`}),`\n`,_jsx(`div`,{className:`gx-list`,children:_jsxs(_components.ul,{children:[`\n`,_jsx(_components.li,{children:`Which Hazelcast member is closest to running out of heap?`}),`\n`,_jsx(_components.li,{children:`Which map is growing fastest, and since when?`}),`\n`,_jsx(_components.li,{children:`Which map takes the most memory on each member?`}),`\n`,_jsx(_components.li,{children:`Did a release change how much data a map holds?`}),`\n`,_jsx(_components.li,{children:`Is the data spread evenly across the members?`}),`\n`,_jsx(_components.li,{children:`When did heap usage last stay above 75%?`}),`\n`]})}),`\n`,_jsx(Heading,{level:`2`,id:`what-is-monitored`,children:`What Is Monitored`}),`\n`,_jsxs(Table,{children:[_jsx(_components.thead,{children:_jsxs(_components.tr,{children:[_jsx(_components.th,{children:`Area`}),_jsx(_components.th,{children:`What GermainUX monitors`})]})}),_jsxs(_components.tbody,{children:[_jsxs(_components.tr,{children:[_jsx(_components.td,{children:_jsx(_components.strong,{children:`Heap`})}),_jsx(_components.td,{children:`Used heap of each member as a percentage of its maximum heap, or of its committed heap when no maximum is set`})]}),_jsxs(_components.tr,{children:[_jsx(_components.td,{children:_jsx(_components.strong,{children:`Map size`})}),_jsxs(_components.td,{children:[`The number of entries in each map. Hazelcast’s internal maps, whose names start with `,_jsx(_components.code,{children:`__`}),`, are skipped.`]})]}),_jsxs(_components.tr,{children:[_jsx(_components.td,{children:_jsx(_components.strong,{children:`Map memory`})}),_jsx(_components.td,{children:`The memory, in bytes, that each map’s entries take on each member`})]}),_jsxs(_components.tr,{children:[_jsx(_components.td,{children:_jsx(_components.strong,{children:`Availability`})}),_jsxs(_components.td,{children:[`Up/down status and response time of member endpoints you can reach over HTTP, such as the health check endpoint, with `,_jsx(_components.a,{href:`/automation/synthetic-http-execution`,children:`synthetic HTTP checks`})]})]}),_jsxs(_components.tr,{children:[_jsx(_components.td,{children:_jsx(_components.strong,{children:`Host`})}),_jsxs(_components.td,{children:[`CPU, memory, disk and network of the servers the members run on, and whether the member process is running. See `,_jsx(_components.a,{href:`/integrations/linux-redhat-suse-monitoring`,children:`Linux monitoring`}),` or `,_jsx(_components.a,{href:`/integrations/windows-monitoring`,children:`Windows monitoring`}),`.`]})]}),_jsxs(_components.tr,{children:[_jsx(_components.td,{children:_jsx(_components.strong,{children:`Logs`})}),_jsxs(_components.td,{children:[`Errors and warnings from the member logs, with `,_jsx(_components.a,{href:`/integrations/file-log-monitoring`,children:`File and Log Monitoring`})]})]})]})]}),`\n`,_jsx(Heading,{level:`2`,id:`analytics-alerts-and-automation`,children:`Analytics, Alerts and Automation`}),`\n`,_jsx(Heading,{level:`3`,id:`ai-analysis`,children:`AI Analysis`}),`\n`,_jsxs(_components.p,{children:[`Ask `,_jsx(_components.a,{href:`/analytics/ai-driven-insights`,children:`AI Explore`}),` questions such as “Which Hazelcast maps grew the most this week?” `,_jsx(_components.a,{href:`/analytics/outlier-detection`,children:`Outlier detection`}),` flags a map or a member whose memory jumps outside its normal range.`]}),`\n`,_jsx(Heading,{level:`3`,id:`dashboards-and-reports`,children:`Dashboards and Reports`}),`\n`,_jsxs(_components.p,{children:[`In the left menu, select `,_jsx(_components.strong,{children:`Dashboards > All`}),`, and then open the `,_jsx(_components.strong,{children:`Hazelcast Overview`}),` dashboard. It has four charts: `,_jsx(_components.strong,{children:`Heap Usage by Member (%)`}),`, `,_jsx(_components.strong,{children:`Peak Heap Usage (%)`}),`, `,_jsx(_components.strong,{children:`Map Size by Map`}),` and `,_jsx(_components.strong,{children:`Map Heap Size by Map`}),`. Each chart compares the selected period with the previous one. Click a chart to open its KPI and pivot by member or map. You can build your own `,_jsx(_components.a,{href:`/dashboards/dashboard-and-report`,children:`dashboards and reports`}),` on the same KPIs.`]}),`\n`,_jsx(Frame,{caption:`Hazelcast Overview Dashboard - GermainUX`,children:_jsx(OptimizedImage,{loading:`lazy`,src:`https://mintcdn.com/germain-ux/eoDC7Ue6Rn5SPFuW/images/main/hazelcast-monitoring/hazelcast-dashboard.png?fit=max\u0026auto=format\u0026n=eoDC7Ue6Rn5SPFuW\u0026q=85\u0026s=0b8a92e31dbf48a48e74f2e4a18f5158`,alt:`Hazelcast Overview dashboard with heap usage by member, peak heap usage, map size by map and map heap size by map charts`,\"data-og-width\":`2545`,width:`2545`,\"data-og-height\":`1178`,height:`1178`,\"data-path\":`images/main/hazelcast-monitoring/hazelcast-dashboard.png`,\"data-optimize\":`true`,\"data-opv\":`3`,srcset:`https://mintcdn.com/germain-ux/eoDC7Ue6Rn5SPFuW/images/main/hazelcast-monitoring/hazelcast-dashboard.png?w=280\u0026fit=max\u0026auto=format\u0026n=eoDC7Ue6Rn5SPFuW\u0026q=85\u0026s=da6cafb1dbf43d8a666709c0f8fda09d 280w, https://mintcdn.com/germain-ux/eoDC7Ue6Rn5SPFuW/images/main/hazelcast-monitoring/hazelcast-dashboard.png?w=560\u0026fit=max\u0026auto=format\u0026n=eoDC7Ue6Rn5SPFuW\u0026q=85\u0026s=b5296185dfcbf23f8cb9b2e9c1a25fa4 560w, https://mintcdn.com/germain-ux/eoDC7Ue6Rn5SPFuW/images/main/hazelcast-monitoring/hazelcast-dashboard.png?w=840\u0026fit=max\u0026auto=format\u0026n=eoDC7Ue6Rn5SPFuW\u0026q=85\u0026s=ec3e17a9ef6d46203b61480774ff66c1 840w, https://mintcdn.com/germain-ux/eoDC7Ue6Rn5SPFuW/images/main/hazelcast-monitoring/hazelcast-dashboard.png?w=1100\u0026fit=max\u0026auto=format\u0026n=eoDC7Ue6Rn5SPFuW\u0026q=85\u0026s=d37b5109838a236b6d082fa5f3995c48 1100w, https://mintcdn.com/germain-ux/eoDC7Ue6Rn5SPFuW/images/main/hazelcast-monitoring/hazelcast-dashboard.png?w=1650\u0026fit=max\u0026auto=format\u0026n=eoDC7Ue6Rn5SPFuW\u0026q=85\u0026s=d71a8fdf4a5fb6d6351758277e014e8c 1650w, https://mintcdn.com/germain-ux/eoDC7Ue6Rn5SPFuW/images/main/hazelcast-monitoring/hazelcast-dashboard.png?w=2500\u0026fit=max\u0026auto=format\u0026n=eoDC7Ue6Rn5SPFuW\u0026q=85\u0026s=1a1a50c4f8d2afd4ccce4799eac59d3e 2500w`})}),`\n`,_jsxs(_components.p,{children:[`The analysis of a chart compares the period with the previous one and breaks the value down by member or map. For `,_jsx(_components.strong,{children:`Heap Usage by Member (%)`}),`, you see the average heap usage of each member and how much it changed.`]}),`\n`,_jsx(Frame,{caption:`Heap Usage Analysis by Member - GermainUX`,children:_jsx(OptimizedImage,{loading:`lazy`,src:`https://mintcdn.com/germain-ux/eoDC7Ue6Rn5SPFuW/images/main/hazelcast-monitoring/hazelcast-heap-usage-analysis.png?fit=max\u0026auto=format\u0026n=eoDC7Ue6Rn5SPFuW\u0026q=85\u0026s=f400c7c56fc7c13bf7794c76ff67f361`,alt:`Heap usage analysis with the average heap usage, the change against the previous period, and a breakdown by member hz-01, hz-02 and hz-03`,\"data-og-width\":`2491`,width:`2491`,\"data-og-height\":`1177`,height:`1177`,\"data-path\":`images/main/hazelcast-monitoring/hazelcast-heap-usage-analysis.png`,\"data-optimize\":`true`,\"data-opv\":`3`,srcset:`https://mintcdn.com/germain-ux/eoDC7Ue6Rn5SPFuW/images/main/hazelcast-monitoring/hazelcast-heap-usage-analysis.png?w=280\u0026fit=max\u0026auto=format\u0026n=eoDC7Ue6Rn5SPFuW\u0026q=85\u0026s=5662e85e0d6d347e207c03bd6c4a42af 280w, https://mintcdn.com/germain-ux/eoDC7Ue6Rn5SPFuW/images/main/hazelcast-monitoring/hazelcast-heap-usage-analysis.png?w=560\u0026fit=max\u0026auto=format\u0026n=eoDC7Ue6Rn5SPFuW\u0026q=85\u0026s=b88f2492645b98236910a1dbd99b965e 560w, https://mintcdn.com/germain-ux/eoDC7Ue6Rn5SPFuW/images/main/hazelcast-monitoring/hazelcast-heap-usage-analysis.png?w=840\u0026fit=max\u0026auto=format\u0026n=eoDC7Ue6Rn5SPFuW\u0026q=85\u0026s=c9dbe3244f2b49b39777dffbc52f6e74 840w, https://mintcdn.com/germain-ux/eoDC7Ue6Rn5SPFuW/images/main/hazelcast-monitoring/hazelcast-heap-usage-analysis.png?w=1100\u0026fit=max\u0026auto=format\u0026n=eoDC7Ue6Rn5SPFuW\u0026q=85\u0026s=c2c462454af68949670fff832de549ac 1100w, https://mintcdn.com/germain-ux/eoDC7Ue6Rn5SPFuW/images/main/hazelcast-monitoring/hazelcast-heap-usage-analysis.png?w=1650\u0026fit=max\u0026auto=format\u0026n=eoDC7Ue6Rn5SPFuW\u0026q=85\u0026s=63c2949271638b71262a30d530aae8d1 1650w, https://mintcdn.com/germain-ux/eoDC7Ue6Rn5SPFuW/images/main/hazelcast-monitoring/hazelcast-heap-usage-analysis.png?w=2500\u0026fit=max\u0026auto=format\u0026n=eoDC7Ue6Rn5SPFuW\u0026q=85\u0026s=9aac081fc5824e2cf94669c6b675bf43 2500w`})}),`\n`,_jsxs(_components.p,{children:[`For `,_jsx(_components.strong,{children:`Map Size by Map`}),`, the analysis lists the maps that changed the most, so a map that suddenly grows stands out.`]}),`\n`,_jsx(Frame,{caption:`Map Size Analysis by Map - GermainUX`,children:_jsx(OptimizedImage,{loading:`lazy`,src:`https://mintcdn.com/germain-ux/eoDC7Ue6Rn5SPFuW/images/main/hazelcast-monitoring/hazelcast-map-size-analysis.png?fit=max\u0026auto=format\u0026n=eoDC7Ue6Rn5SPFuW\u0026q=85\u0026s=8080816431e3f28b639f69057f3c7f97`,alt:`Map size analysis with the leading factors: the sessions map marked as a spike, product-cache as degraded and rate-limits as better`,\"data-og-width\":`2477`,width:`2477`,\"data-og-height\":`1051`,height:`1051`,\"data-path\":`images/main/hazelcast-monitoring/hazelcast-map-size-analysis.png`,\"data-optimize\":`true`,\"data-opv\":`3`,srcset:`https://mintcdn.com/germain-ux/eoDC7Ue6Rn5SPFuW/images/main/hazelcast-monitoring/hazelcast-map-size-analysis.png?w=280\u0026fit=max\u0026auto=format\u0026n=eoDC7Ue6Rn5SPFuW\u0026q=85\u0026s=edf6dec872ec0951266d8da8594652d3 280w, https://mintcdn.com/germain-ux/eoDC7Ue6Rn5SPFuW/images/main/hazelcast-monitoring/hazelcast-map-size-analysis.png?w=560\u0026fit=max\u0026auto=format\u0026n=eoDC7Ue6Rn5SPFuW\u0026q=85\u0026s=60408b02863294c373807924ab4dce1c 560w, https://mintcdn.com/germain-ux/eoDC7Ue6Rn5SPFuW/images/main/hazelcast-monitoring/hazelcast-map-size-analysis.png?w=840\u0026fit=max\u0026auto=format\u0026n=eoDC7Ue6Rn5SPFuW\u0026q=85\u0026s=b82fd18ddf785497e0d4d47db3022632 840w, https://mintcdn.com/germain-ux/eoDC7Ue6Rn5SPFuW/images/main/hazelcast-monitoring/hazelcast-map-size-analysis.png?w=1100\u0026fit=max\u0026auto=format\u0026n=eoDC7Ue6Rn5SPFuW\u0026q=85\u0026s=1d1747c9ec2290e4247d0a58846f7ce5 1100w, https://mintcdn.com/germain-ux/eoDC7Ue6Rn5SPFuW/images/main/hazelcast-monitoring/hazelcast-map-size-analysis.png?w=1650\u0026fit=max\u0026auto=format\u0026n=eoDC7Ue6Rn5SPFuW\u0026q=85\u0026s=a0af4c0221d39f0dd761770670695fd6 1650w, https://mintcdn.com/germain-ux/eoDC7Ue6Rn5SPFuW/images/main/hazelcast-monitoring/hazelcast-map-size-analysis.png?w=2500\u0026fit=max\u0026auto=format\u0026n=eoDC7Ue6Rn5SPFuW\u0026q=85\u0026s=692fe4e009cf5a171ad01330aff67a35 2500w`})}),`\n`,_jsx(Heading,{level:`3`,id:`slas-and-alerts`,children:`SLAs and Alerts`}),`\n`,_jsxs(_components.p,{children:[`Each KPI comes with a default `,_jsx(_components.a,{href:`/analytics/slas`,children:`SLA`}),`, listed under `,_jsx(_components.a,{href:`#kpis`,children:`KPIs`}),`. Get an `,_jsx(_components.a,{href:`/automation/notifications`,children:`alert`}),` by email, SMS, Slack or Teams when a member’s heap or a map stays over its limit.`]}),`\n`,_jsx(Heading,{level:`3`,id:`automation`,children:`Automation`}),`\n`,_jsxs(_components.p,{children:[`When an SLA is breached, an `,_jsx(_components.a,{href:`/automation/automated-actions`,children:`automated action`}),` can run a diagnostic script, call an HTTP endpoint or open an incident.`]}),`\n`,_jsx(Heading,{level:`2`,id:`how-it-works`,children:`How It Works`}),`\n`,_jsxs(`div`,{className:`gx-flow`,children:[_jsx(`span`,{children:`Hazelcast member`}),_jsx(`span`,{children:`JMX`}),_jsx(`span`,{children:`Hazelcast JMX Monitor`}),_jsx(`span`,{children:`KPIs`}),_jsx(`span`,{children:`Alerts`})]}),`\n`,_jsxs(Table,{children:[_jsx(_components.thead,{children:_jsxs(_components.tr,{children:[_jsx(_components.th,{children:`Component`}),_jsx(_components.th,{children:`What it does`})]})}),_jsxs(_components.tbody,{children:[_jsxs(_components.tr,{children:[_jsx(_components.td,{children:_jsx(_components.strong,{children:`Hazelcast JMX Monitor`})}),_jsxs(_components.td,{children:[`Runs on a GermainUX Engine and connects to one member over JMX on a schedule. It reads `,_jsx(_components.code,{children:`HeapMemoryUsage`}),` from `,_jsx(_components.code,{children:`java.lang:type=Memory`}),`, and `,_jsx(_components.code,{children:`size`}),` and `,_jsx(_components.code,{children:`localOwnedEntryMemoryCost`}),` from each `,_jsx(_components.code,{children:`com.hazelcast:type=IMap`}),` MBean.`]})]}),_jsxs(_components.tr,{children:[_jsx(_components.td,{children:_jsx(_components.strong,{children:`Hazelcast rules`})}),_jsx(_components.td,{children:`Turn each reading into a fact: heap usage as a percentage, and map size and map memory named after the map`})]})]})]}),`\n`,_jsx(_components.p,{children:`Each member has its own JMX connection, so you deploy one monitor for each member. The member’s host becomes the system name, which is how the KPIs and SLAs tell the members apart.`}),`\n`,_jsx(Heading,{level:`2`,id:`before-you-start`,children:`Before You Start`}),`\n`,_jsx(`div`,{className:`gx-list`,children:_jsxs(_components.ul,{children:[`\n`,_jsxs(_components.li,{children:[`A `,_jsx(_components.a,{href:`/deploy/germain-ux-engine`,children:`GermainUX Engine`}),` can reach the JMX port of every Hazelcast member.`]}),`\n`,_jsx(_components.li,{children:`You can change the configuration and JVM options of the members, and restart them.`}),`\n`,_jsx(_components.li,{children:`You have a JMX user name and password for the members, if JMX authentication is on.`}),`\n`,_jsx(_components.li,{children:`Firewalls allow the Engine to reach the JMX and RMI ports.`}),`\n`]})}),`\n`,_jsx(Heading,{level:`2`,id:`deploy`,children:`Deploy`}),`\n`,_jsxs(Steps,{children:[_jsxs(Step,{title:`Turn on JMX in Hazelcast`,children:[_jsxs(_components.p,{children:[`Set the `,_jsx(_components.code,{children:`hazelcast.jmx`}),` property on every member, in the member configuration:`]}),_jsx(CodeBlock,{filename:`hazelcast.xml`,numberOfLines:`5`,language:`xml`,children:_jsx(_components.pre,{className:`shiki shiki-themes github-light-default dark-plus`,style:{backgroundColor:`#ffffff`,\"--shiki-dark-bg\":`#0B0C0E`,color:`#1f2328`,\"--shiki-dark\":`#D4D4D4`},language:`xml`,children:_jsxs(_components.code,{language:`xml`,numberOfLines:`5`,children:[_jsxs(_components.span,{className:`line`,children:[_jsx(_components.span,{style:{color:`#1F2328`,\"--shiki-dark\":`#808080`},children:`\u003c`}),_jsx(_components.span,{style:{color:`#116329`,\"--shiki-dark\":`#569CD6`},children:`hazelcast`}),_jsx(_components.span,{style:{color:`#1F2328`,\"--shiki-dark\":`#808080`},children:`>`})]}),`\n`,_jsxs(_components.span,{className:`line`,children:[_jsx(_components.span,{style:{color:`#1F2328`,\"--shiki-dark\":`#808080`},children:` \u003c`}),_jsx(_components.span,{style:{color:`#116329`,\"--shiki-dark\":`#569CD6`},children:`properties`}),_jsx(_components.span,{style:{color:`#1F2328`,\"--shiki-dark\":`#808080`},children:`>`})]}),`\n`,_jsxs(_components.span,{className:`line`,children:[_jsx(_components.span,{style:{color:`#1F2328`,\"--shiki-dark\":`#808080`},children:` \u003c`}),_jsx(_components.span,{style:{color:`#116329`,\"--shiki-dark\":`#569CD6`},children:`property`}),_jsx(_components.span,{style:{color:`#0550AE`,\"--shiki-dark\":`#9CDCFE`},children:` name`}),_jsx(_components.span,{style:{color:`#1F2328`,\"--shiki-dark\":`#D4D4D4`},children:`=`}),_jsx(_components.span,{style:{color:`#0A3069`,\"--shiki-dark\":`#CE9178`},children:`\"hazelcast.jmx\"`}),_jsx(_components.span,{style:{color:`#1F2328`,\"--shiki-dark\":`#808080`},children:`>`}),_jsx(_components.span,{style:{color:`#1F2328`,\"--shiki-dark\":`#D4D4D4`},children:`true`}),_jsx(_components.span,{style:{color:`#1F2328`,\"--shiki-dark\":`#808080`},children:`\u003c/`}),_jsx(_components.span,{style:{color:`#116329`,\"--shiki-dark\":`#569CD6`},children:`property`}),_jsx(_components.span,{style:{color:`#1F2328`,\"--shiki-dark\":`#808080`},children:`>`})]}),`\n`,_jsxs(_components.span,{className:`line`,children:[_jsx(_components.span,{style:{color:`#1F2328`,\"--shiki-dark\":`#808080`},children:` \u003c/`}),_jsx(_components.span,{style:{color:`#116329`,\"--shiki-dark\":`#569CD6`},children:`properties`}),_jsx(_components.span,{style:{color:`#1F2328`,\"--shiki-dark\":`#808080`},children:`>`})]}),`\n`,_jsxs(_components.span,{className:`line`,children:[_jsx(_components.span,{style:{color:`#1F2328`,\"--shiki-dark\":`#808080`},children:`\u003c/`}),_jsx(_components.span,{style:{color:`#116329`,\"--shiki-dark\":`#569CD6`},children:`hazelcast`}),_jsx(_components.span,{style:{color:`#1F2328`,\"--shiki-dark\":`#808080`},children:`>`})]}),`\n`]})})}),_jsxs(_components.p,{children:[`You can also start the member with `,_jsx(_components.code,{children:`-Dhazelcast.jmx=true`}),`. See the `,_jsx(_components.a,{href:`https://docs.hazelcast.com/hazelcast/latest/maintain-cluster/monitoring`,children:`Hazelcast monitoring documentation`}),` for details.`]})]}),_jsxs(Step,{title:`Open the JVM to remote JMX`,children:[_jsx(_components.p,{children:`Add the standard Java remote JMX options to each member’s JVM, and then restart the member:`}),_jsx(CodeBlock,{filename:``,numberOfLines:`7`,language:`shellscript`,children:_jsx(_components.pre,{className:`shiki shiki-themes github-light-default dark-plus`,style:{backgroundColor:`#ffffff`,\"--shiki-dark-bg\":`#0B0C0E`,color:`#1f2328`,\"--shiki-dark\":`#D4D4D4`},language:`shellscript`,children:_jsxs(_components.code,{language:`shellscript`,numberOfLines:`7`,children:[_jsxs(_components.span,{className:`line`,children:[_jsx(_components.span,{style:{color:`#953800`,\"--shiki-dark\":`#DCDCAA`},children:`-Dcom.sun.management.jmxremote.port`}),_jsx(_components.span,{style:{color:`#0A3069`,\"--shiki-dark\":`#CE9178`},children:`=JMX_PORT`})]}),`\n`,_jsxs(_components.span,{className:`line`,children:[_jsx(_components.span,{style:{color:`#953800`,\"--shiki-dark\":`#DCDCAA`},children:`-Dcom.sun.management.jmxremote.rmi.port`}),_jsx(_components.span,{style:{color:`#0A3069`,\"--shiki-dark\":`#CE9178`},children:`=JMX_PORT`})]}),`\n`,_jsxs(_components.span,{className:`line`,children:[_jsx(_components.span,{style:{color:`#953800`,\"--shiki-dark\":`#DCDCAA`},children:`-Dcom.sun.management.jmxremote.authenticate`}),_jsx(_components.span,{style:{color:`#0A3069`,\"--shiki-dark\":`#CE9178`},children:`=`}),_jsx(_components.span,{style:{color:`#0550AE`,\"--shiki-dark\":`#DCDCAA`},children:`true`})]}),`\n`,_jsxs(_components.span,{className:`line`,children:[_jsx(_components.span,{style:{color:`#953800`,\"--shiki-dark\":`#DCDCAA`},children:`-Dcom.sun.management.jmxremote.password.file`}),_jsx(_components.span,{style:{color:`#0A3069`,\"--shiki-dark\":`#CE9178`},children:`=/opt/hazelcast/jmxremote.password`})]}),`\n`,_jsxs(_components.span,{className:`line`,children:[_jsx(_components.span,{style:{color:`#953800`,\"--shiki-dark\":`#DCDCAA`},children:`-Dcom.sun.management.jmxremote.access.file`}),_jsx(_components.span,{style:{color:`#0A3069`,\"--shiki-dark\":`#CE9178`},children:`=/opt/hazelcast/jmxremote.access`})]}),`\n`,_jsxs(_components.span,{className:`line`,children:[_jsx(_components.span,{style:{color:`#953800`,\"--shiki-dark\":`#DCDCAA`},children:`-Dcom.sun.management.jmxremote.ssl`}),_jsx(_components.span,{style:{color:`#0A3069`,\"--shiki-dark\":`#CE9178`},children:`=`}),_jsx(_components.span,{style:{color:`#0550AE`,\"--shiki-dark\":`#DCDCAA`},children:`false`})]}),`\n`,_jsxs(_components.span,{className:`line`,children:[_jsx(_components.span,{style:{color:`#953800`,\"--shiki-dark\":`#DCDCAA`},children:`-Djava.rmi.server.hostname`}),_jsx(_components.span,{style:{color:`#0A3069`,\"--shiki-dark\":`#CE9178`},children:`=MEMBER_HOST`})]}),`\n`]})})}),_jsxs(_components.p,{children:[`Replace `,_jsx(_components.code,{children:`JMX_PORT`}),` with a free port, for example `,_jsx(_components.code,{children:`9999`}),`, and `,_jsx(_components.code,{children:`MEMBER_HOST`}),` with the host name the Engine uses to reach the member. Turn on SSL when your security policy requires it.`]})]}),_jsx(Step,{title:`Open the Java Monitor Deployment wizard`,children:_jsxs(_components.p,{children:[`In the left menu, go to `,_jsx(_components.strong,{children:`Settings > Wizards`}),`. On the `,_jsx(_components.strong,{children:`Java Monitor Deployment`}),` card, click `,_jsx(_components.strong,{children:`Add`}),`.`]})}),_jsxs(Step,{title:`Choose the Hazelcast monitor`,children:[_jsxs(_components.p,{children:[`On the `,_jsx(_components.strong,{children:`Monitoring`}),` step, fill in the fields, and then click `,_jsx(_components.strong,{children:`Next`}),`.`]}),_jsxs(Table,{children:[_jsx(_components.thead,{children:_jsxs(_components.tr,{children:[_jsx(_components.th,{children:`Field`}),_jsx(_components.th,{children:`Value`})]})}),_jsxs(_components.tbody,{children:[_jsxs(_components.tr,{children:[_jsx(_components.td,{children:_jsx(_components.strong,{children:`Component Type`})}),_jsx(_components.td,{children:_jsx(_components.strong,{children:`Hazelcast JMX Monitor`})})]}),_jsxs(_components.tr,{children:[_jsx(_components.td,{children:_jsx(_components.strong,{children:`Monitored Application`})}),_jsxs(_components.td,{children:[`The application to file the data under, for example one named `,_jsx(_components.code,{children:`Hazelcast`})]})]}),_jsxs(_components.tr,{children:[_jsx(_components.td,{children:_jsx(_components.strong,{children:`Credentials`})}),_jsx(_components.td,{children:`The JMX user name and password. Leave it empty when JMX authentication is off.`})]})]})]}),_jsx(Frame,{caption:`Java Monitor Deployment Wizard, Monitoring Step - GermainUX`,children:_jsx(OptimizedImage,{loading:`lazy`,src:`https://mintcdn.com/germain-ux/eoDC7Ue6Rn5SPFuW/images/main/hazelcast-monitoring/jmx-monitor-deployment-monitoring-step.png?fit=max\u0026auto=format\u0026n=eoDC7Ue6Rn5SPFuW\u0026q=85\u0026s=e1e0cca8b9970f325b17b6d4df1794c5`,alt:`Java Monitor Deployment wizard on the Monitoring step, with Hazelcast JMX Monitor selected as the Component Type`,\"data-og-width\":`1438`,width:`1438`,\"data-og-height\":`405`,height:`405`,\"data-path\":`images/main/hazelcast-monitoring/jmx-monitor-deployment-monitoring-step.png`,\"data-optimize\":`true`,\"data-opv\":`3`,srcset:`https://mintcdn.com/germain-ux/eoDC7Ue6Rn5SPFuW/images/main/hazelcast-monitoring/jmx-monitor-deployment-monitoring-step.png?w=280\u0026fit=max\u0026auto=format\u0026n=eoDC7Ue6Rn5SPFuW\u0026q=85\u0026s=e4ee88aee16dde59ce65206ae3774cfb 280w, https://mintcdn.com/germain-ux/eoDC7Ue6Rn5SPFuW/images/main/hazelcast-monitoring/jmx-monitor-deployment-monitoring-step.png?w=560\u0026fit=max\u0026auto=format\u0026n=eoDC7Ue6Rn5SPFuW\u0026q=85\u0026s=fe1f00256ca9931c86997a47f5d544f6 560w, https://mintcdn.com/germain-ux/eoDC7Ue6Rn5SPFuW/images/main/hazelcast-monitoring/jmx-monitor-deployment-monitoring-step.png?w=840\u0026fit=max\u0026auto=format\u0026n=eoDC7Ue6Rn5SPFuW\u0026q=85\u0026s=a1f74d398f46b2efefe33d5e5a7b0355 840w, https://mintcdn.com/germain-ux/eoDC7Ue6Rn5SPFuW/images/main/hazelcast-monitoring/jmx-monitor-deployment-monitoring-step.png?w=1100\u0026fit=max\u0026auto=format\u0026n=eoDC7Ue6Rn5SPFuW\u0026q=85\u0026s=45104774469d810224b049af91dac8a9 1100w, https://mintcdn.com/germain-ux/eoDC7Ue6Rn5SPFuW/images/main/hazelcast-monitoring/jmx-monitor-deployment-monitoring-step.png?w=1650\u0026fit=max\u0026auto=format\u0026n=eoDC7Ue6Rn5SPFuW\u0026q=85\u0026s=005fbd3e559ed7fed8c4c9640f30be23 1650w, https://mintcdn.com/germain-ux/eoDC7Ue6Rn5SPFuW/images/main/hazelcast-monitoring/jmx-monitor-deployment-monitoring-step.png?w=2500\u0026fit=max\u0026auto=format\u0026n=eoDC7Ue6Rn5SPFuW\u0026q=85\u0026s=04a3db14c3971d65649fa8d0df47fadb 2500w`})})]}),_jsxs(Step,{title:`Connect to the member`,children:[_jsxs(_components.p,{children:[`On the `,_jsx(_components.strong,{children:`Connection`}),` step, select or create the `,_jsx(_components.strong,{children:`URI`}),` of the member’s JMX endpoint, and then click `,_jsx(_components.strong,{children:`Next`}),`:`]}),_jsx(CodeBlock,{filename:``,numberOfLines:`2`,language:`text`,children:_jsx(_components.pre,{className:`shiki shiki-themes github-light-default dark-plus`,style:{backgroundColor:`#ffffff`,\"--shiki-dark-bg\":`#0B0C0E`,color:`#1f2328`,\"--shiki-dark\":`#D4D4D4`},language:`text`,children:_jsxs(_components.code,{language:`text`,numberOfLines:`2`,children:[_jsx(_components.span,{className:`line`,children:_jsx(_components.span,{children:`service:jmx:rmi:///jndi/rmi://MEMBER_HOST:JMX_PORT/jmxrmi`})}),`\n`,_jsx(_components.span,{className:`line`,children:_jsx(_components.span,{})})]})})}),_jsxs(_components.p,{children:[`When the Engine runs on the same server as the member, you can enter an `,_jsx(_components.strong,{children:`Application Pattern`}),` that matches the member’s Java process name instead, and GermainUX attaches to the local JVM.`]})]}),_jsx(Step,{title:`Deploy it to the Engine`,children:_jsxs(_components.p,{children:[`On the `,_jsx(_components.strong,{children:`Deployment`}),` step, enter a `,_jsx(_components.strong,{children:`Monitor Name`}),`, such as `,_jsx(_components.code,{children:`Hazelcast hz-01`}),`, select the `,_jsx(_components.strong,{children:`Monitoring Node`}),` and Engine, and set the schedule. The default, `,_jsx(_components.code,{children:`0 0 * * * *`}),`, runs once an hour. An SLA trips after 5 violations in a row, so use `,_jsx(_components.code,{children:`0 */5 * * * *`}),` to read the member every 5 minutes. Finish the wizard.`]})}),_jsx(Step,{title:`Repeat for the other members`,children:_jsx(_components.p,{children:`Run the wizard once for each member of the cluster.`})})]}),`\n`,_jsx(Heading,{level:`2`,id:`validate`,children:`Validate`}),`\n`,_jsxs(Steps,{children:[_jsx(Step,{title:`Wait for the first run`,children:_jsxs(_components.p,{children:[`The monitor reads the member at its next scheduled time, for example within 5 minutes with `,_jsx(_components.code,{children:`0 */5 * * * *`}),`.`]})}),_jsx(Step,{title:`Open the Hazelcast dashboard`,children:_jsxs(_components.p,{children:[`In the left menu, select `,_jsx(_components.strong,{children:`Dashboards > All`}),`, and then open `,_jsx(_components.strong,{children:`Hazelcast Overview`}),`. `,_jsx(_components.strong,{children:`Heap Usage by Member (%)`}),` shows one line for each member you deployed.`]})}),_jsx(Step,{title:`Check the maps`,children:_jsxs(_components.p,{children:[_jsx(_components.strong,{children:`Map Size by Map`}),` shows one line for each of your maps, with its entry count.`]})})]}),`\n`,_jsx(Heading,{level:`2`,id:`troubleshooting`,children:`Troubleshooting`}),`\n`,_jsxs(AccordionGroup,{children:[_jsx(Accordion,{title:`No data appears for a member`,id:`no-data-appears-for-a-member`,children:_jsxs(_components.p,{children:[`Check that the Engine can open a connection to the member’s JMX port, and that the port in the URI matches `,_jsx(_components.code,{children:`com.sun.management.jmxremote.port`}),`. When the member sits behind NAT or has several network interfaces, set `,_jsx(_components.code,{children:`java.rmi.server.hostname`}),` to the address the Engine uses, and set `,_jsx(_components.code,{children:`com.sun.management.jmxremote.rmi.port`}),` to the same port.`]})}),_jsx(Accordion,{title:`Heap usage appears, but no maps`,id:`heap-usage-appears-but-no-maps`,children:_jsxs(_components.p,{children:[`The `,_jsx(_components.code,{children:`hazelcast.jmx`}),` property is off, so the member doesn’t publish its map MBeans. Set it to `,_jsx(_components.code,{children:`true`}),` and restart the member. Maps also appear only after the application has created them.`]})}),_jsx(Accordion,{title:`The connection fails with an authentication error`,id:`the-connection-fails-with-an-authentication-error`,children:_jsxs(_components.p,{children:[`The credentials don’t match the JMX password file, or the user has no entry in the access file. Check both files on the member, and the `,_jsx(_components.strong,{children:`Credentials`}),` selected in the wizard.`]})}),_jsx(Accordion,{title:`Map memory is missing for some maps`,id:`map-memory-is-missing-for-some-maps`,children:_jsx(_components.p,{children:`Hazelcast reports no memory cost for some map configurations. GermainUX skips readings without a memory value, so those maps show a size but no memory.`})})]}),`\n`,_jsx(Heading,{level:`2`,id:`security-and-privacy`,children:`Security and Privacy`}),`\n`,_jsx(_components.p,{children:`Hazelcast monitoring data includes:`}),`\n`,_jsx(`div`,{className:`gx-list`,children:_jsxs(_components.ul,{children:[`\n`,_jsxs(_components.li,{children:[_jsx(_components.strong,{children:`System data`}),`: the host names of the members`]}),`\n`,_jsxs(_components.li,{children:[_jsx(_components.strong,{children:`Application data`}),`: the names of your maps`]}),`\n`]})}),`\n`,_jsx(_components.p,{children:`GermainUX reads sizes and memory figures only, not the entries stored in the maps.`}),`\n`,_jsxs(_components.p,{children:[`To mask, anonymize or exclude this data, see `,_jsx(_components.a,{href:`/management/compliance-privacy-and-security/data-privacy`,children:`Data Privacy`}),`.`]}),`\n`,_jsx(Heading,{level:`2`,id:`kpis`,children:`KPIs`}),`\n`,_jsxs(Table,{children:[_jsx(_components.thead,{children:_jsxs(_components.tr,{children:[_jsx(_components.th,{children:`KPI`}),_jsx(_components.th,{children:`What it holds`}),_jsx(_components.th,{children:`Default SLA`})]})}),_jsxs(_components.tbody,{children:[_jsxs(_components.tr,{children:[_jsx(_components.td,{children:_jsx(_components.strong,{children:`Hazelcast Heap Usage`})}),_jsx(_components.td,{children:`Heap usage of each member, in percent`}),_jsxs(_components.td,{children:[`OK below `,_jsx(_components.code,{children:`75`}),`, per member`]})]}),_jsxs(_components.tr,{children:[_jsx(_components.td,{children:_jsx(_components.strong,{children:`Hazelcast Map Size`})}),_jsx(_components.td,{children:`Number of entries in each map`}),_jsxs(_components.td,{children:[`OK below `,_jsx(_components.code,{children:`1000000`}),`, per member and map`]})]}),_jsxs(_components.tr,{children:[_jsx(_components.td,{children:_jsx(_components.strong,{children:`Hazelcast Map Heap Size`})}),_jsx(_components.td,{children:`Memory taken by each map’s entries on a member, in bytes`}),_jsxs(_components.td,{children:[`OK below `,_jsx(_components.code,{children:`104857600`}),` (100 MB), per member and map`]})]})]})]}),`\n`,_jsxs(_components.p,{children:[`Each SLA is breached after 5 violations in a row. Change the thresholds to fit your cluster. See `,_jsx(_components.a,{href:`/analytics/kpis`,children:`KPIs`}),` and `,_jsx(_components.a,{href:`/analytics/slas`,children:`SLAs`}),`.`]}),`\n`,_jsx(Heading,{level:`2`,id:`related-documentation`,children:`Related Documentation`}),`\n`,_jsxs(CardGroup,{cols:3,children:[_jsx(Card,{title:`Java Monitoring`,icon:`java`,href:`/integrations/java-monitoring`,children:_jsx(_components.p,{children:`JVM metrics over JMX`})}),_jsx(Card,{title:`Analytics`,icon:`chart-simple`,href:`/analytics`,children:_jsx(_components.p,{children:`More Analytics Features`})}),_jsx(Card,{title:`Automation`,icon:`robot`,href:`/automation`,children:_jsx(_components.p,{children:`More Automation Features`})})]}),`\n`,_jsx(Heading,{level:`2`,id:`get-help`,children:`Get Help`}),`\n`,_jsx(_components.p,{children:`The GermainUX team can help you add other Hazelcast MBeans, such as queues, topics or partition data, to the monitor.`}),`\n`,_jsxs(CardGroup,{cols:2,children:[_jsx(Card,{title:`Contact GermainUX Support`,icon:`headset`,href:`/getting-started/support`,children:_jsx(_components.p,{children:`The GermainUX team helps you get up and running faster, empower your team, turn data into actionable insights, and optimize performance to deliver measurable business outcomes.`})}),_jsx(Card,{title:`Can't Find What You Need?`,icon:`magnifying-glass`,children:_jsxs(_components.p,{children:[`Search all GermainUX docs with `,_jsx(_components.strong,{children:`Ctrl + K`}),`, or use the feedback buttons at the bottom of this page to tell us what is missing.`]})})]}),`\n`,_jsx(_MdxComponentBoundary,{name:`GxFooter`,children:_jsx(GxFooter,{})}),`\n`,_jsx(_MdxComponentBoundary,{name:`GxStyle`,children:_jsx(GxStyle,{})})]})}function MDXContent(props={}){const{wrapper:MDXLayout}={..._provideComponents(),...props.components};return MDXLayout?_jsx(MDXLayout,{...props,children:_jsx(_createMdxContent,{...props})}):_createMdxContent(props)}return{GxFooter,GxStyle,default:MDXContent};function _missingMdxReference(id,component){throw new Error(`Expected `+(component?`component`:`object`)+\" `\"+id+\"` to be defined: you likely forgot to import, pass, or provide it.\")}","frontmatter":{},"scope":{"config":{},"pageMetadata":{"title":"Hazelcast Monitoring","sidebarTitle":"Hazelcast","description":"Watch heap pressure and map growth on every member of your Hazelcast cluster, and get alerted before a map runs a member out of memory.","icon":"plug","keywords":["Hazelcast","Hazelcast IMap","Hazelcast JMX","in-memory data grid"],"href":"/integrations/hazelcast-monitoring"}}},"mdxSourceWithNoJs":null,"noJsSplices":[[136,153,"Style=()=>null;const GxFooter=()=>_jsx(`"],[255,12837,""],[48271,48291,"Style,GxFooter,defau"]]},"mdxExtracts":{"tableOfContents":[{"title":"Overview","slug":"overview","depth":2,"children":[{"title":"Questions It Answers","slug":"questions-it-answers","depth":3,"children":[]}]},{"title":"What Is Monitored","slug":"what-is-monitored","depth":2,"children":[]},{"title":"Analytics, Alerts and Automation","slug":"analytics-alerts-and-automation","depth":2,"children":[{"title":"AI Analysis","slug":"ai-analysis","depth":3,"children":[]},{"title":"Dashboards and Reports","slug":"dashboards-and-reports","depth":3,"children":[]},{"title":"SLAs and Alerts","slug":"slas-and-alerts","depth":3,"children":[]},{"title":"Automation","slug":"automation","depth":3,"children":[]}]},{"title":"How It Works","slug":"how-it-works","depth":2,"children":[]},{"title":"Before You Start","slug":"before-you-start","depth":2,"children":[]},{"title":"Deploy","slug":"deploy","depth":2,"children":[]},{"title":"Validate","slug":"validate","depth":2,"children":[]},{"title":"Troubleshooting","slug":"troubleshooting","depth":2,"children":[]},{"title":"Security and Privacy","slug":"security-and-privacy","depth":2,"children":[]},{"title":"KPIs","slug":"kpis","depth":2,"children":[]},{"title":"Related Documentation","slug":"related-documentation","depth":2,"children":[]},{"title":"Get Help","slug":"get-help","depth":2,"children":[]}],"codeExamples":{}},"jsLinks":[],"subdomain":"germain-ux","siteName":"GermainUX Docs","title":"Hazelcast Monitoring - GermainUX Docs","navMaps":{"firstHrefInVersion":{},"firstHrefInLanguage":{}},"lastModified":"2026-11-13T13:01:46.372Z","originalFileLocation":"integrations/hazelcast-monitoring.mdx"},"headHtml":"\u003cscript data-mint-head>(function(){var d=document.documentElement,p=null;if(!p){try{p=localStorage.getItem(\"isDarkMode\")}catch(e){}if(p==='true')p='dark';else if(p==='false')p='light';if(p!=='light'\u0026\u0026p!=='dark'\u0026\u0026p!=='system')p=\"light\"}var r=p==='system'?(matchMedia(\"(prefers-color-scheme: dark)\").matches?'dark':'light'):p;d.classList.remove(r==='dark'?'light':'dark');d.classList.add(r);d.setAttribute(\"data-theme-preference\",p)})();\u003c/script>\u003cmeta data-mint-head name=\"description\" content=\"Watch heap pressure and map growth on every member of your Hazelcast cluster, and get alerted before a map runs a member out of memory.\">\u003cmeta data-mint-head name=\"application-name\" content=\"GermainUX Docs\">\u003cmeta data-mint-head name=\"generator\" content=\"Mintlify\">\u003clink data-mint-head rel=\"icon\" type=\"image/png\" sizes=\"192x192\" href=\"/mintlify-assets/_mintlify/favicons/germain-ux/_Kw8Od9IpYFcCZNX/_generated/favicon/android-chrome-192x192.png\" media=\"(prefers-color-scheme: light)\">\u003clink data-mint-head rel=\"apple-touch-icon\" type=\"image/png\" sizes=\"180x180\" href=\"/mintlify-assets/_mintlify/favicons/germain-ux/_Kw8Od9IpYFcCZNX/_generated/favicon/apple-touch-icon.png\">\u003clink data-mint-head rel=\"icon\" type=\"image/png\" sizes=\"16x16\" href=\"/mintlify-assets/_mintlify/favicons/germain-ux/_Kw8Od9IpYFcCZNX/_generated/favicon/favicon-16x16.png\" media=\"(prefers-color-scheme: light)\">\u003clink data-mint-head rel=\"icon\" type=\"image/png\" sizes=\"32x32\" href=\"/mintlify-assets/_mintlify/favicons/germain-ux/_Kw8Od9IpYFcCZNX/_generated/favicon/favicon-32x32.png\" media=\"(prefers-color-scheme: light)\">\u003clink data-mint-head rel=\"shortcut icon\" type=\"image/x-icon\" href=\"/mintlify-assets/_mintlify/favicons/germain-ux/_Kw8Od9IpYFcCZNX/_generated/favicon/favicon.ico\" media=\"(prefers-color-scheme: light)\">\u003clink data-mint-head rel=\"icon\" type=\"image/png\" sizes=\"192x192\" href=\"/mintlify-assets/_mintlify/favicons/germain-ux/_Kw8Od9IpYFcCZNX/_generated/favicon-dark/android-chrome-192x192.png\" media=\"(prefers-color-scheme: dark)\">\u003clink data-mint-head rel=\"icon\" type=\"image/png\" sizes=\"16x16\" href=\"/mintlify-assets/_mintlify/favicons/germain-ux/_Kw8Od9IpYFcCZNX/_generated/favicon-dark/favicon-16x16.png\" media=\"(prefers-color-scheme: dark)\">\u003clink data-mint-head rel=\"icon\" type=\"image/png\" sizes=\"32x32\" href=\"/mintlify-assets/_mintlify/favicons/germain-ux/_Kw8Od9IpYFcCZNX/_generated/favicon-dark/favicon-32x32.png\" media=\"(prefers-color-scheme: dark)\">\u003clink data-mint-head rel=\"shortcut icon\" type=\"image/x-icon\" href=\"/mintlify-assets/_mintlify/favicons/germain-ux/_Kw8Od9IpYFcCZNX/_generated/favicon-dark/favicon.ico\" media=\"(prefers-color-scheme: dark)\">\u003cmeta data-mint-head property=\"og:title\" content=\"Hazelcast Monitoring - GermainUX Docs\">\u003cmeta data-mint-head property=\"og:description\" content=\"Watch heap pressure and map growth on every member of your Hazelcast cluster, and get alerted before a map runs a member out of memory.\">\u003cmeta data-mint-head property=\"og:site_name\" content=\"GermainUX Docs\">\u003cmeta data-mint-head property=\"og:url\" content=\"https://docs.germainux.com/integrations/hazelcast-monitoring\">\u003cmeta data-mint-head property=\"og:type\" content=\"website\">\u003cmeta data-mint-head property=\"og:image\" content=\"https://germain-ux.mintlify.site/_mintlify/api/og/v2?division=Integrations\u0026amp;title=Hazelcast+Monitoring\u0026amp;description=Watch+heap+pressure+and+map+growth+on+every+member+of+your+Hazelcast+cluster%2C+and+get+alerted+before+a+map+runs+a+member+out+of+memory.\u0026amp;theme=f29cc06a49affea3bfdf77b7\u0026amp;signature=44f2e4096ef4332f48d0ea7fe5a98daae6081a3fd98c9c378d39c0818eba7f35\">\u003cmeta data-mint-head property=\"og:image:width\" content=\"1200\">\u003cmeta data-mint-head property=\"og:image:height\" content=\"630\">\u003cmeta data-mint-head name=\"twitter:card\" content=\"summary_large_image\">\u003cmeta data-mint-head name=\"twitter:title\" content=\"Hazelcast Monitoring - GermainUX Docs\">\u003cmeta data-mint-head name=\"twitter:description\" content=\"Watch heap pressure and map growth on every member of your Hazelcast cluster, and get alerted before a map runs a member out of memory.\">\u003cmeta data-mint-head name=\"twitter:image\" content=\"https://germain-ux.mintlify.site/_mintlify/api/og/v2?division=Integrations\u0026amp;title=Hazelcast+Monitoring\u0026amp;description=Watch+heap+pressure+and+map+growth+on+every+member+of+your+Hazelcast+cluster%2C+and+get+alerted+before+a+map+runs+a+member+out+of+memory.\u0026amp;theme=f29cc06a49affea3bfdf77b7\u0026amp;signature=44f2e4096ef4332f48d0ea7fe5a98daae6081a3fd98c9c378d39c0818eba7f35\">\u003cmeta data-mint-head name=\"twitter:image:width\" content=\"1200\">\u003cmeta data-mint-head name=\"twitter:image:height\" content=\"630\">\u003cmeta data-mint-head name=\"msapplication-config\" content=\"/mintlify-assets/_mintlify/favicons/germain-ux/_Kw8Od9IpYFcCZNX/_generated/favicon/browserconfig.xml\">\u003cmeta data-mint-head name=\"apple-mobile-web-app-title\" content=\"GermainUX Docs\">\u003cmeta data-mint-head name=\"msapplication-TileColor\" content=\"#2E7DF2\">\u003cmeta data-mint-head name=\"og:locale\" content=\"en_US\">\u003clink data-mint-head rel=\"canonical\" href=\"https://docs.germainux.com/integrations/hazelcast-monitoring\">\u003clink data-mint-head rel=\"alternate\" type=\"application/xml\" href=\"/sitemap.xml\">\u003clink data-mint-head rel=\"alternate\" type=\"text/markdown\" href=\"/integrations/hazelcast-monitoring.md\">\u003cscript data-mint-head type=\"application/ld+json\">{\"@context\":\"https://schema.org\",\"@graph\":[{\"@type\":\"Organization\",\"@id\":\"https://docs.germainux.com/#organization\",\"name\":\"GermainUX Docs\",\"url\":\"https://docs.germainux.com\",\"logo\":{\"@type\":\"ImageObject\",\"url\":\"https://mintcdn.com/germain-ux/ok7-BbqwVV0uk3t8/images/logo-light.png?fit=max\u0026auto=format\u0026n=ok7-BbqwVV0uk3t8\u0026q=85\u0026s=3cfe3238ac55802e43da3e4da5806f0d\"}},{\"@type\":\"WebSite\",\"@id\":\"https://docs.germainux.com#website\",\"name\":\"GermainUX Docs\",\"url\":\"https://docs.germainux.com\",\"publisher\":{\"@id\":\"https://docs.germainux.com/#organization\"}},{\"@type\":\"WebPage\",\"@id\":\"https://docs.germainux.com/integrations/hazelcast-monitoring#webpage\",\"url\":\"https://docs.germainux.com/integrations/hazelcast-monitoring\",\"name\":\"Hazelcast Monitoring\",\"description\":\"Watch heap pressure and map growth on every member of your Hazelcast cluster, and get alerted before a map runs a member out of memory.\",\"dateModified\":\"2026-11-13T13:01:46.372Z\",\"isPartOf\":{\"@id\":\"https://docs.germainux.com#website\"},\"breadcrumb\":{\"@id\":\"https://docs.germainux.com/integrations/hazelcast-monitoring#breadcrumb\"}},{\"@type\":\"BreadcrumbList\",\"@id\":\"https://docs.germainux.com/integrations/hazelcast-monitoring#breadcrumb\",\"itemListElement\":[{\"@type\":\"ListItem\",\"position\":1,\"name\":\"GermainUX Documentation\",\"item\":\"https://docs.germainux.com\"},{\"@type\":\"ListItem\",\"position\":2,\"name\":\"Integrations\",\"item\":\"https://docs.germainux.com/integrations/monitoring\"},{\"@type\":\"ListItem\",\"position\":3,\"name\":\"Hazelcast Monitoring\",\"item\":\"https://docs.germainux.com/integrations/hazelcast-monitoring\"}]},{\"@type\":[\"Article\",\"TechArticle\"],\"@id\":\"https://docs.germainux.com/integrations/hazelcast-monitoring#article\",\"headline\":\"Hazelcast Monitoring\",\"name\":\"Hazelcast Monitoring\",\"description\":\"Watch heap pressure and map growth on every member of your Hazelcast cluster, and get alerted before a map runs a member out of memory.\",\"url\":\"https://docs.germainux.com/integrations/hazelcast-monitoring\",\"mainEntityOfPage\":{\"@id\":\"https://docs.germainux.com/integrations/hazelcast-monitoring#webpage\"},\"dateModified\":\"2026-11-13T13:01:46.372Z\",\"keywords\":\"Hazelcast, Hazelcast IMap, Hazelcast JMX, in-memory data grid\",\"publisher\":{\"@id\":\"https://docs.germainux.com/#organization\"},\"isPartOf\":{\"@id\":\"https://docs.germainux.com#website\"}}]}\u003c/script>\u003cscript data-mint-head type=\"application/ld+json\">{\"@context\":\"https://schema.org\",\"@type\":\"WebSite\",\"name\":\"GermainUX Docs\",\"publisher\":{\"@type\":\"Organization\",\"name\":\"GermainUX Docs\"},\"provider\":{\"@type\":\"Organization\",\"name\":\"Mintlify\",\"url\":\"https://mintlify.com\"}}\u003c/script>","agentPointerHref":"/integrations/hazelcast-monitoring.md","siteName":"GermainUX Docs","nav":{"global":null,"tabs":[{"tab":"Documentation","groups":[{"group":"GermainUX Documentation","pages":[{"title":"GermainUX Documentation","sidebarTitle":"Overview","icon":"book-open","href":""},{"group":"Getting Started","pages":[{"title":"GermainUX Overview","sidebarTitle":"At a Glance","icon":"flag","href":"/getting-started/germain-ux-getting-started"},{"title":"Overview \u0026 Key Benefits","sidebarTitle":"Overview \u0026 Key Benefits","icon":"lightbulb","href":"/getting-started/key-benefits-features"},{"title":"How GermainUX Works","sidebarTitle":"How GermainUX Works","icon":"diagram-project","href":"/getting-started/strategy-architecture"},{"title":"GermainUX Components","sidebarTitle":"Components","icon":"lightbulb","href":"/getting-started/components"},{"title":"Concepts \u0026 Terminologies","sidebarTitle":"Concepts \u0026 Terminologies","href":"/getting-started/concepts-terminologies"},{"title":"Sizing and Deployment Impact Analysis","sidebarTitle":"Sizing and Deployment Impact Analysis","href":"/getting-started/impact-analysis"},{"title":"Support and Contact","sidebarTitle":"Support and Contact","icon":"headset","href":"/getting-started/support"}]},{"group":"Deploy GermainUX","icon":"rocket","pages":[{"title":"Deploy GermainUX","sidebarTitle":"Overview","icon":"rocket","href":"/deploy/install-on-premise-or-cloud"},{"group":"GermainUX Agent","pages":[{"title":"GermainUX Agent","sidebarTitle":"Overview","icon":"lightbulb","href":"/deploy/germainux-agent/index"},{"title":"Setup \u0026 Configuration","sidebarTitle":"Setup \u0026 Configuration","icon":"rocket","href":"/deploy/germainux-agent/setup-configuration"},{"title":"Agent Installation","sidebarTitle":"Agent Installation","icon":"rocket","href":"/deploy/germainux-agent/agent-installation"},{"title":"Agent Settings(Registry)","sidebarTitle":"Agent Settings(Registry)","href":"/deploy/germainux-agent/agent-settings-registry"},{"title":"Monitoring Config Reference","sidebarTitle":"Monitoring Config Reference","icon":"lightbulb","href":"/deploy/germainux-agent/monitoring-config-reference"}]},{"title":"GermainUX Enterprise On Cloud","sidebarTitle":"GermainUX-Enterprise - On Cloud","icon":"lightbulb","href":"/deploy/deployment-on-our-cloud"},{"group":"GermainUX Enterprise On Premise","pages":[{"title":"GermainUX Enterprise On Premise","sidebarTitle":"Overview","icon":"lightbulb","href":"/deploy/deployment-on-premise/index"},{"group":"Requirements","pages":[{"title":"Requirements","sidebarTitle":"Overview","icon":"book","href":"/deploy/deployment-on-premise/requirements"},{"title":"Hardware Requirements","sidebarTitle":"Hardware Requirements","icon":"book","href":"/deploy/deployment-on-premise/hardware-requirements"},{"title":"Network Requirements","sidebarTitle":"Network Requirements","href":"/deploy/deployment-on-premise/network-requirements"},{"title":"Software Requirements","sidebarTitle":"Software Requirements","href":"/deploy/deployment-on-premise/software-requirements"},{"group":"Storage Requirements","pages":[{"title":"Storage Requirements","sidebarTitle":"Overview","icon":"book","href":"/deploy/deployment-on-premise/storage-requirements"},{"title":"Datastore Recommendation and Benchmark","sidebarTitle":"Datastore Recommendation and Benchmark","icon":"lightbulb","href":"/deploy/deployment-on-premise/datastore-which-to-choose"}]}]},{"title":"Package and License","sidebarTitle":"Package and License","icon":"lightbulb","href":"/deploy/deployment-on-premise/prerequisites"},{"group":"Installation","pages":[{"title":"Installation","sidebarTitle":"Overview","icon":"rocket","href":"/deploy/deployment-on-premise/installation"},{"title":"Quick Start Setup","sidebarTitle":"Quick Start Setup","icon":"rocket","href":"/deploy/deployment-on-premise/quick-start-setup"},{"group":"GermainUX Datastore","pages":[{"title":"GermainUX Datastore","sidebarTitle":"Overview","icon":"lightbulb","href":"/deploy/deployment-on-premise/germain-ux-datastore"},{"group":"Elasticsearch On Premise (Preferred)","pages":[{"title":"Elasticsearch On Premise (Preferred)","sidebarTitle":"Overview","icon":"lightbulb","href":"/deploy/deployment-on-premise/elasticsearch-database-preferred"},{"title":"Secure Elasticsearch and Kibana","sidebarTitle":"Secure Elasticsearch and Kibana","icon":"lightbulb","href":"/deploy/deployment-on-premise/securing-elastic-search-and-kibana"}]},{"title":"Elasticsearch On Cloud","sidebarTitle":"Elasticsearch - On Cloud","icon":"lightbulb","href":"/deploy/deployment-on-premise/elasticsearch-saas"},{"title":"MySQL Database Setup","sidebarTitle":"MySQL Database Setup","icon":"rocket","href":"/deploy/deployment-on-premise/mysql-database"},{"group":"Oracle Database Setup","pages":[{"title":"Oracle Database Setup","sidebarTitle":"Overview","icon":"rocket","href":"/deploy/deployment-on-premise/oracle-database"},{"title":"Oracle Database Troubleshooting","sidebarTitle":"Troubleshooting","icon":"wrench","href":"/deploy/deployment-on-premise/oracle-database-troubleshooting"}]},{"title":"PostgreSQL Database Setup","sidebarTitle":"PostgreSQL Database Setup","icon":"rocket","href":"/deploy/deployment-on-premise/postgresql-database"},{"title":"Other Databases","sidebarTitle":"Other Databases","icon":"lightbulb","href":"/deploy/deployment-on-premise/other-databases"}]},{"group":"GermainUX Enterprise (on Tomcat)","pages":[{"title":"GermainUX Enterprise (on Tomcat)","sidebarTitle":"Overview","icon":"lightbulb","href":"/deploy/deployment-on-premise/germain-ux-enterprise-on-tomcat"},{"group":"Apache ActiveMQ Setup","pages":[{"title":"Apache ActiveMQ Setup","sidebarTitle":"Overview","icon":"rocket","href":"/deploy/deployment-on-premise/apache-activemq-setup"},{"title":"Apache ActiveMQ Troubleshooting","sidebarTitle":"Apache ActiveMQ Troubleshooting","icon":"wrench","href":"/deploy/deployment-on-premise/apache-activemq-troubleshooting"}]},{"title":"Apache Kafka Setup","sidebarTitle":"Apache Kafka Setup","icon":"rocket","href":"/deploy/deployment-on-premise/apache-kafka-setup"},{"title":"Hazelcast Setup","sidebarTitle":"Hazelcast Setup","href":"/deploy/deployment-on-premise/hazelcast-setup"},{"title":"ZooKeeper Setup","sidebarTitle":"ZooKeeper Setup","href":"/deploy/deployment-on-premise/zookeeper-setup"},{"title":"GermainUX Services","sidebarTitle":"GermainUX Services","icon":"lightbulb","href":"/deploy/deployment-on-premise/germain-ux-services"},{"title":"GermainUX Init Configuration","sidebarTitle":"GermainUX Init Configuration","icon":"lightbulb","href":"/deploy/deployment-on-premise/germain-ux-init-configuration"},{"title":"GermainUX Enterprise Troubleshooting","sidebarTitle":"Troubleshooting","icon":"wrench","href":"/deploy/deployment-on-premise/germain-enterprise-troubleshooting"}]},{"title":"Kubernetes Setup","sidebarTitle":"Kubernetes Setup","icon":"rocket","href":"/deploy/deployment-on-premise/kubernetes-setup"},{"title":"OpenShift Setup","sidebarTitle":"OpenShift Setup","href":"/deploy/deployment-on-premise/openshift-setup"},{"title":"Validate Customizations","sidebarTitle":"Validate Customizations","icon":"lightbulb","href":"/deploy/deployment-on-premise/customizations"},{"title":"Sentinel: GermainUX Self-Monitoring","sidebarTitle":"Sentinel: GermainUX Self-Monitoring","icon":"lightbulb","href":"/deploy/deployment-on-premise/sentinel"}]}]},{"group":"GermainUX Engine","pages":[{"title":"GermainUX Engine","sidebarTitle":"Overview","icon":"lightbulb","href":"/deploy/germain-ux-engine/index"},{"group":"Engine Deployment","pages":[{"title":"Engine Deployment","sidebarTitle":"Overview","icon":"rocket","href":"/deploy/germain-ux-engine/engine-deployment"},{"title":"Deploy at Scale","sidebarTitle":"Deploy at Scale","icon":"rocket","href":"/deploy/germain-ux-engine/deploy-at-scale-using-profiles"}]},{"group":"Engine Configuration","pages":[{"title":"Engine Configuration","sidebarTitle":"Overview","icon":"lightbulb","href":"/deploy/germain-ux-engine/engine-configuration"},{"title":"Engine Memory Configuration","sidebarTitle":"Engine Memory Configuration","icon":"lightbulb","href":"/deploy/germain-ux-engine/engine-memory-configuration"},{"title":"Engine Proxy Configuration","sidebarTitle":"Engine Proxy Configuration","icon":"lightbulb","href":"/deploy/germain-ux-engine/engine-proxy-configuration"}]}]},{"title":"GermainUX Mobile App","sidebarTitle":"GermainUX-Mobile App","icon":"lightbulb","href":"/deploy/germain-ux-mobile-app"},{"title":"GermainUX Code Profiler","sidebarTitle":"GermainUX-Code Profiler","icon":"lightbulb","href":"/deploy/germain-ux-code-profiler"},{"title":"GermainUX JS Profiler","sidebarTitle":"GermainUX-JS Profiler","icon":"lightbulb","href":"/deploy/germain-ux-js-profiler"},{"title":"GermainUX RPA Bot Recorder","sidebarTitle":"GermainUX-RPA Bot Recorder","icon":"lightbulb","href":"/deploy/germain-ux-rpa-bot-recorder"},{"title":"GermainUX RUM Extension","sidebarTitle":"GermainUX-RUM Extension","icon":"lightbulb","href":"/deploy/germain-ux-rum-extension"},{"group":"GermainUX RUM JS","pages":[{"title":"GermainUX RUM JS","sidebarTitle":"Overview","icon":"lightbulb","href":"/deploy/germain-ux-rum-js/index"},{"title":"Deploy RUM JS (Google Tag Manager)","sidebarTitle":"Deploy RUM JS (Google Tag Manager)","icon":"rocket","href":"/deploy/germain-ux-rum-js/deploy-rum-js-google-tag-manager"}]},{"title":"GermainUX RUM Windows","sidebarTitle":"GermainUX-RUM Windows","icon":"lightbulb","href":"/deploy/germainux-rum-windows"}]},{"group":"Analytics","icon":"chart-simple","pages":[{"title":"Analytics","sidebarTitle":"Overview","icon":"chart-simple","href":"/analytics/index"},{"title":"Adoption Insights","sidebarTitle":"Adoption Insights","icon":"lightbulb","href":"/analytics/adoption-insights"},{"group":"AI Insights \u0026 Recommendations","pages":[{"title":"AI Insights \u0026 Recommendations","sidebarTitle":"Overview","icon":"lightbulb","href":"/analytics/ai-driven-insights/index"},{"title":"Configure AI Services \u0026 Prompts","sidebarTitle":"Configure AI Services \u0026 Prompts","icon":"list-check","href":"/analytics/ai-driven-insights/configure-ai-services-prompts"}]},{"title":"Averages vs Percentiles","sidebarTitle":"Averages vs Percentiles","icon":"lightbulb","href":"/analytics/averages-vs-percentiles"},{"title":"Impact at Scale for Any Issue","sidebarTitle":"Impact at Scale for Any Issue","icon":"lightbulb","href":"/analytics/business-impact-at-scale-for-any-issue"},{"title":"Behavior Analysis","sidebarTitle":"Behavior Analysis","icon":"lightbulb","href":"/analytics/behavior-analysis"},{"group":"Business Process and Workflow Mining","pages":[{"title":"Business Process and Workflow Mining","sidebarTitle":"Overview","icon":"lightbulb","href":"/analytics/business-process-workflow-monitoring/index"},{"title":"Configure a Business Process or Workflow","sidebarTitle":"Configure a Business Process or Workflow","icon":"list-check","href":"/analytics/business-process-workflow-monitoring/configure-a-business-process"}]},{"group":"Campaign","pages":[{"title":"Campaign","sidebarTitle":"Overview","icon":"lightbulb","href":"/analytics/marketing-campaign-monitoring/index"},{"title":"Configure Campaign Monitoring","sidebarTitle":"Configure Campaign Monitoring","icon":"list-check","href":"/analytics/marketing-campaign-monitoring/configure-campaign-monitoring"}]},{"group":"Categorization","pages":[{"title":"Categorization","sidebarTitle":"Overview","icon":"lightbulb","href":"/analytics/data-categorization/index"},{"title":"Configure Categorization","sidebarTitle":"Configure Categorization","icon":"list-check","href":"/analytics/data-categorization/configure-categorization"}]},{"title":"Code Profiling","sidebarTitle":"Code Profiling","icon":"lightbulb","href":"/analytics/code-profiling"},{"title":"Chat Analysis","sidebarTitle":"Chat Analysis","icon":"lightbulb","href":"/analytics/conversation-analysis"},{"title":"Conversion Insights","sidebarTitle":"Conversion Insights","icon":"lightbulb","href":"/analytics/conversion-analysis"},{"title":"Document Audit","sidebarTitle":"Document Audit","icon":"lightbulb","href":"/analytics/document-audit"},{"title":"Drop-Offs","sidebarTitle":"Drop-Offs","icon":"lightbulb","href":"/analytics/drop-offs"},{"group":"Error Analysis","pages":[{"title":"Error Analysis","sidebarTitle":"Overview","icon":"lightbulb","href":"/analytics/errors-analysis-ai-powered/index"},{"title":"Configure User Error Monitoring","sidebarTitle":"Configure User Error Monitoring","icon":"list-check","href":"/analytics/errors-analysis-ai-powered/configure-user-error-monitoring"}]},{"title":"Heatmaps","sidebarTitle":"Heatmaps","icon":"lightbulb","href":"/analytics/heatmaps"},{"title":"Insights (Automate Your Own)","sidebarTitle":"Insights (Automate Your Own)","icon":"lightbulb","href":"/analytics/custom-insights"},{"title":"Insights (Automated \u0026 Preconfigured)","sidebarTitle":"Insights (Automated \u0026 Preconfigured)","icon":"lightbulb","href":"/analytics/insights-to-boost-ux"},{"title":"Journey","sidebarTitle":"Journey","icon":"lightbulb","href":"/analytics/customer-journey"},{"group":"KPIs, Pivots \u0026 Measures","pages":[{"title":"AI KPIs, Pivots, Measures","sidebarTitle":"AI KPIs, Pivots, Measures","icon":"brain","href":"/analytics/kpis/ai-kpis-pivots-measures"},{"title":"KPIs, Pivots \u0026 Measures","sidebarTitle":"Overview","icon":"gauge","href":"/analytics/kpis/index"},{"title":"Business Process/Workflow KPIs, Pivots \u0026 Measures","sidebarTitle":"Business Process/Workflow KPIs, Pivots \u0026 Measures","icon":"gauge","href":"/analytics/kpis/kpis-business-process"},{"title":"Marketing KPIs, Pivots \u0026 Measures","sidebarTitle":"Marketing KPIs, Pivots \u0026 Measures","icon":"gauge","href":"/analytics/kpis/marketing-kpis-pivots-measures"},{"title":"Technologies KPIs, Pivots \u0026 Measures","sidebarTitle":"Technologies KPIs, Pivots \u0026 Measures","href":"/analytics/kpis/kpis-technologies-availability-performance-mobile"},{"title":"User Experience KPIs, Pivots \u0026 Measures","sidebarTitle":"User Experience KPIs, Pivots \u0026 Measures","href":"/analytics/kpis/kpis-user-monitoring-and-replay"},{"title":"Web Analytics KPIs, Pivots \u0026 Measures","sidebarTitle":"Web Analytics KPIs, Pivots \u0026 Measures","icon":"gauge","href":"/analytics/kpis/kpis-web-analytics"},{"title":"Display Name for KPIs, Pivots \u0026 Measures","sidebarTitle":"Display Name for KPIs, Pivots \u0026 Measures","icon":"gauge","href":"/analytics/kpis/display-name-for-kpi-field"},{"title":"KPI Relationships","sidebarTitle":"KPI Relationships","icon":"gauge","href":"/analytics/kpis/kpi-relationships"}]},{"title":"Outlier and Anomaly Detection","sidebarTitle":"Outlier and Anomaly Detection","icon":"lightbulb","href":"/analytics/outlier-detection"},{"title":"Preconfigured Analytics by Technology","sidebarTitle":"Preconfigured Analytics by Technology","href":"/analytics/plugins-that-use-these-analytics-features"},{"group":"Rules: Advanced Automated Analytics","pages":[{"title":"Rules: Advanced Automated Analytics","sidebarTitle":"Overview","icon":"lightbulb","href":"/analytics/rules-advanced-automated-analytics/index"},{"title":"Configure a Rule for Advanced Analytics","sidebarTitle":"Configure a Rule for Advanced Analytics","icon":"list-check","href":"/analytics/rules-advanced-automated-analytics/configure-a-rule-for-advanced-analytics"}]},{"title":"Sentiment Analysis","sidebarTitle":"Sentiment Analysis","icon":"lightbulb","href":"/analytics/sentiment-analysis-ai-driven"},{"group":"SLAs","pages":[{"title":"SLAs","sidebarTitle":"Overview","icon":"lightbulb","href":"/analytics/slas/index"},{"title":"Configure SLA","sidebarTitle":"Configure SLA","icon":"list-check","href":"/analytics/slas/configure-sla"}]},{"title":"SQL Query","sidebarTitle":"SQL Query","icon":"lightbulb","href":"/analytics/query-monitoring"},{"title":"Story Beat","sidebarTitle":"Story Beat","icon":"lightbulb","href":"/analytics/story-beat"},{"title":"Transaction Insights","sidebarTitle":"Transaction Insights","href":"/analytics/transaction-insights"},{"title":"User Role Lookup","sidebarTitle":"User Role Lookup","href":"/analytics/user-role-lookup"},{"group":"User Session Monitoring, Replay \u0026 6 Heatmaps","pages":[{"title":"User Session Monitoring, Replay \u0026 6 Heatmaps","sidebarTitle":"Overview","icon":"lightbulb","href":"/analytics/user-monitoring-and-replay/index"},{"title":"Deploy User Monitoring and Session Replay","sidebarTitle":"Deploy User Monitoring and Session Replay","icon":"rocket","href":"/analytics/user-monitoring-and-replay/user-monitoring-and-replay-deployment"},{"title":"Configure User Monitoring and Session Replay","sidebarTitle":"Configure User Monitoring and Session Replay","icon":"list-check","href":"/analytics/user-monitoring-and-replay/user-monitoring-and-replay-configuration"},{"group":"Session Replay Player","pages":[{"title":"Session Replay Player","sidebarTitle":"Overview","icon":"lightbulb","href":"/analytics/user-monitoring-and-replay/session-replay-player"},{"title":"Configure Session Replay Player","sidebarTitle":"Configure Session Replay Player","icon":"list-check","href":"/analytics/user-monitoring-and-replay/configure-session-replay-player"}]},{"title":"KPIs for User Monitoring and Session Replay","sidebarTitle":"KPIs for User Monitoring and Session Replay","icon":"gauge","href":"/analytics/user-monitoring-and-replay/user-monitoring-and-replay-kpis"},{"title":"APIs for User Monitoring and Session Replay","sidebarTitle":"APIs for User Monitoring and Session Replay","icon":"code","href":"/analytics/user-monitoring-and-replay/user-monitoring-and-replay-apis"}]},{"title":"Work Time Insights","sidebarTitle":"Work Time Insights","icon":"lightbulb","href":"/analytics/work-time-insights"},{"title":"Root-Cause Analysis","sidebarTitle":"Root-Cause Analysis","href":"/analytics/root-cause-analysis"}]},{"group":"Automation","icon":"robot","pages":[{"title":"Automation","sidebarTitle":"Overview","icon":"robot","href":"/automation/index"},{"group":"Automated Actions","pages":[{"title":"Automated Actions","sidebarTitle":"Overview","icon":"lightbulb","href":"/automation/automated-actions/index"},{"title":"Configure AI Services \u0026 Prompts (Automated Actions)","sidebarTitle":"Configure AI Services \u0026 Prompts (Automated Actions)","icon":"list-check","href":"/automation/automated-actions/configure-ai-services-prompts-automated-actions"},{"title":"Scheduling of an Action","sidebarTitle":"Scheduling of an Action","icon":"lightbulb","href":"/automation/automated-actions/component-scheduling"}]},{"group":"Correlation or Tracing","pages":[{"title":"Correlation or Tracing","sidebarTitle":"Overview","icon":"lightbulb","href":"/analytics/correlation-and-tracing/index"},{"title":"Exact-Match Correlation","sidebarTitle":"Exact-Match Correlation","icon":"lightbulb","href":"/analytics/correlation-and-tracing/exact-match-correlation"},{"title":"Id-Based Correlation","sidebarTitle":"Id-Based Correlation","icon":"lightbulb","href":"/analytics/correlation-and-tracing/id-based-correlation"},{"title":"Stream Correlation","sidebarTitle":"Stream Correlation","icon":"lightbulb","href":"/analytics/correlation-and-tracing/stream-correlation"}]},{"title":"File Archiving","sidebarTitle":"File Archiving","icon":"lightbulb","href":"/automation/file-archiving"},{"title":"File Deletion/Purge","sidebarTitle":"File Deletion/Purge","icon":"lightbulb","href":"/automation/automatic-delete-purge-of-files"},{"title":"File Download","sidebarTitle":"File Download","icon":"lightbulb","href":"/automation/file-download"},{"group":"HTTP and HTTPS Execution","pages":[{"title":"HTTP and HTTPS Execution","sidebarTitle":"Overview","icon":"lightbulb","href":"/automation/synthetic-http-execution/index"},{"title":".Har File (Import/Export)","sidebarTitle":".Har File (Import/Export)","icon":"lightbulb","href":"/automation/synthetic-http-execution/har-file-import-export"},{"title":"Configure Execution of Http Request","sidebarTitle":"Configure Execution of Http Request","icon":"list-check","href":"/automation/synthetic-http-execution/configure-execution-of-http-request"}]},{"title":"Log File Analysis","sidebarTitle":"Log File Analysis","icon":"file-lines","href":"/automation/log-file-analysis"},{"title":"Log Level Auto-Setting","sidebarTitle":"Log Level Auto-Setting","icon":"lightbulb","href":"/automation/log-level-auto-setting"},{"title":"Monitoring","sidebarTitle":"Monitoring","icon":"lightbulb","href":"/automation/monitoring"},{"title":"Moogsoft","sidebarTitle":"Moogsoft","icon":"lightbulb","href":"/automation/moogsoft"},{"group":"Notifications","pages":[{"title":"Notifications","sidebarTitle":"Overview","icon":"lightbulb","href":"/automation/notifications/index"},{"group":"Alert (email and sms)","pages":[{"title":"Alert (Email and Sms)","sidebarTitle":"Overview","icon":"lightbulb","href":"/automation/notifications/alert-email-and-sms"},{"title":"Create an Alert","sidebarTitle":"Create an Alert","icon":"list-check","href":"/automation/notifications/create-an-alert"}]},{"title":"Quiet Times","sidebarTitle":"Quiet Times","icon":"lightbulb","href":"/automation/notifications/quiet-times"},{"title":"Microsoft Teams Notification","sidebarTitle":"Microsoft Teams","icon":"lightbulb","href":"/automation/notifications/microsoft-teams-notification"},{"group":"Reports (Automatic, Scheduled)","pages":[{"title":"Reports (Automatic, Scheduled)","sidebarTitle":"Overview","icon":"lightbulb","href":"/automation/notifications/reporting-automatic"},{"title":"Create a Report","sidebarTitle":"Create a Report","icon":"list-check","href":"/automation/notifications/create-a-automatic-report"}]},{"title":"Slack","sidebarTitle":"Slack","icon":"lightbulb","href":"/automation/notifications/slack"},{"title":"Watch \u0026 Be Notified","sidebarTitle":"Watch \u0026 Be Notified","icon":"lightbulb","href":"/automation/notifications/watch"}]},{"title":"Plugins (That Use These Automation Features)","sidebarTitle":"Plugins (That Use These Automation Features)","href":"/automation/plugins-that-use-these-automation-features"},{"title":"Program Execution (RPA Bots)","sidebarTitle":"Program Execution (RPA Bots)","icon":"lightbulb","href":"/automation/local-program-execution"},{"group":"Rules: Advanced Automation","pages":[{"title":"Rules: Advanced Automation","sidebarTitle":"Overview","icon":"lightbulb","href":"/automation/rules/index"},{"title":"Create a Rule for Advanced Automation","sidebarTitle":"Create a Rule for Advanced Automation","icon":"list-check","href":"/automation/rules/create-a-rule-for-advanced-automation"}]},{"group":"Script Execution","pages":[{"title":"Script Execution","sidebarTitle":"Overview","icon":"lightbulb","href":"/automation/script/index"},{"title":"Configure Script Execution","sidebarTitle":"Configure Script Execution","icon":"list-check","href":"/automation/script/configure-script-execution"}]},{"title":"ServiceNow","sidebarTitle":"ServiceNow","icon":"lightbulb","href":"/automation/servicenow"},{"title":"SQL Execution","sidebarTitle":"SQL Execution","icon":"lightbulb","href":"/automation/sql-execution"},{"title":"SSH Execution","sidebarTitle":"SSH Execution","icon":"lightbulb","href":"/automation/ssh-execution"},{"group":"Synthetic/User Click Scenario","pages":[{"title":"Synthetic/User Click Scenario","sidebarTitle":"Overview","icon":"lightbulb","href":"/automation/user-click-synthetic-user-scenario/index"},{"title":"Record a Synthetic Scenario","sidebarTitle":"Record a Synthetic Scenario","icon":"list-check","href":"/automation/user-click-synthetic-user-scenario/record-a-synthetic-scenario"},{"title":"Configure a Synthetic Scenario","sidebarTitle":"Configure a Synthetic Scenario","icon":"list-check","href":"/automation/user-click-synthetic-user-scenario/configure-a-synthetic-scenario"},{"title":"Deploy Synthetic Scenario","sidebarTitle":"Deploy Synthetic Scenario","icon":"rocket","href":"/automation/user-click-synthetic-user-scenario/deploy-synthetic-scenario"},{"title":"Troubleshoot Synthetic Scenario","sidebarTitle":"Troubleshoot Synthetic Scenario","href":"/automation/user-click-synthetic-user-scenario/troubleshoot-synthetic-scenario"},{"title":"Monitor a Synthetic Scenario","sidebarTitle":"Monitor a Synthetic Scenario","icon":"list-check","href":"/automation/user-click-synthetic-user-scenario/monitor-a-synthetic-scenario"}]},{"group":"User Feedback","pages":[{"title":"User Feedback","sidebarTitle":"Overview","icon":"lightbulb","href":"/automation/user-feedback/index"},{"title":"Configure User Feedback","sidebarTitle":"Configure User Feedback","icon":"list-check","href":"/automation/user-feedback/configure-user-feedback"}]},{"title":"Web Driver Auto-Update","sidebarTitle":"Web Driver Auto-Update","icon":"lightbulb","href":"/automation/browser-auto-update"},{"title":"Website Audit and SEO","sidebarTitle":"Website Audit and SEO","icon":"lightbulb","href":"/automation/website-audit-seo"},{"title":"Website Crawler","sidebarTitle":"Website Crawler","icon":"lightbulb","href":"/automation/crawler"},{"title":"WMI Execution","sidebarTitle":"WMI Execution","icon":"lightbulb","href":"/automation/wmi-execution"}]},{"group":"Integrations","icon":"plug","pages":[{"title":"Integrations","sidebarTitle":"Overview","icon":"plug","href":"/integrations/monitoring"},{"group":".NET Operational Experience Intelligence","pages":[{"title":".NET Operational Experience Intelligence","sidebarTitle":"Overview","icon":"plug","href":"/integrations/net-monitoring/index"},{"title":"Deploy and Configure Monitoring for .NET","sidebarTitle":"Deploy and Configure Monitoring for .NET","icon":"rocket","href":"/integrations/net-monitoring/deploy-and-configure-monitoring-for-net"},{"title":"KPIs for .NET Monitoring, Automation \u0026 Session Replay","sidebarTitle":"KPIs for .NET Monitoring, Automation \u0026 Session Replay","icon":"gauge","href":"/integrations/net-monitoring/kpis-for-net-monitoring-automation-session-replay"}]},{"title":"ActiveMQ Observability","sidebarTitle":"ActiveMQ Observability","icon":"plug","href":"/integrations/apache-activemq-monitoring"},{"title":"AIX Observability","sidebarTitle":"AIX Observability","icon":"plug","href":"/integrations/aix-monitoring"},{"group":"Amazon EC2 Observability","pages":[{"title":"Amazon EC2 Observability","sidebarTitle":"Overview","icon":"plug","href":"/integrations/amazon-ec2-observability/index"},{"title":"Configure Monitoring for Amazon EC2","sidebarTitle":"Configure Monitoring for Amazon EC2","icon":"list-check","href":"/integrations/amazon-ec2-observability/amazon-ec2-monitoring-configuration"}]},{"title":"Amazon Web Services Monitoring","sidebarTitle":"AWS Inspector, RDS and SES","icon":"plug","href":"/integrations/aws-monitoring"},{"group":"Android Application Observability","pages":[{"title":"Android Application Observability","sidebarTitle":"Overview","icon":"plug","href":"/integrations/android-application-observability/index"},{"title":"Deploy Monitoring for Android App","sidebarTitle":"Deploy Monitoring for Android App","icon":"rocket","href":"/integrations/android-application-observability/android-app-monitoring-deployment"},{"group":"Configure Monitoring for Android App","pages":[{"title":"Configure Monitoring for Android App","sidebarTitle":"Overview","icon":"list-check","href":"/integrations/android-application-observability/android-app-monitoring-configuration"},{"title":"Error and Exception Monitoring for Android App","sidebarTitle":"Error and Exception Monitoring for Android App","icon":"lightbulb","href":"/integrations/android-application-observability/android-app-error-and-exception-monitoring"},{"title":"Event Monitoring for Android App","sidebarTitle":"Event Monitoring for Android App","icon":"lightbulb","href":"/integrations/android-application-observability/android-app-event-monitoring"},{"title":"Session Monitoring for Android App","sidebarTitle":"Session Monitoring for Android App","icon":"lightbulb","href":"/integrations/android-application-observability/android-app-session-monitoring"},{"title":"Transaction Monitoring for Android App","sidebarTitle":"Transaction Monitoring for Android App","icon":"lightbulb","href":"/integrations/android-application-observability/android-app-transaction-monitoring"},{"title":"Fragment and View Monitoring for Android App","sidebarTitle":"Fragment and View Monitoring for Android App","icon":"lightbulb","href":"/integrations/android-application-observability/android-app-fragment-and-view-monitoring"}]},{"title":"KPIs for Android App Monitoring","sidebarTitle":"KPIs for Android App Monitoring","icon":"gauge","href":"/integrations/android-application-observability/android-app-monitoring-kpis"}]},{"title":"Android Device Observability","sidebarTitle":"Android Device Observability","icon":"plug","href":"/integrations/android-mobile-device-monitoring"},{"group":"Angular Operational Experience Intelligence","pages":[{"title":"Angular Operational Experience Intelligence","sidebarTitle":"Overview","icon":"plug","href":"/integrations/angular-monitoring/index"},{"title":"Deploy Monitoring for Angular","sidebarTitle":"Deploy Monitoring for Angular","icon":"rocket","href":"/integrations/angular-monitoring/deploy-monitoring-for-angular"}]},{"group":"BigCommerce Operational Experience Intelligence","pages":[{"title":"BigCommerce Operational Experience Intelligence","sidebarTitle":"Overview","icon":"plug","href":"/integrations/bigcommerce-monitoring/index"},{"title":"Deploy Monitoring for BigCommerce","sidebarTitle":"Deploy Monitoring for BigCommerce","icon":"rocket","href":"/integrations/bigcommerce-monitoring/deploy-monitoring-for-bigcommerce"}]},{"group":"BigPanda Incident Intelligence","pages":[{"title":"BigPanda Incident Intelligence","sidebarTitle":"Overview","icon":"plug","href":"/integrations/bigpanda-incident-intelligence/index"},{"title":"Deploy Incident Intelligence for BigPanda","sidebarTitle":"Deploy Incident Intelligence for BigPanda","icon":"rocket","href":"/integrations/bigpanda-incident-intelligence/deploy-incident-intelligence-for-bigpanda"}]},{"group":"Browser Observability","pages":[{"title":"Browser Observability","sidebarTitle":"Overview","icon":"plug","href":"/integrations/browser-monitoring/index"},{"title":"Deploy Monitoring for Browsers","sidebarTitle":"Deploy Monitoring for Browsers","href":"/integrations/browser-monitoring/deployment-for-browser-monitoring"},{"group":"Configure Monitoring for Browsers","pages":[{"title":"Configure Monitoring for Browsers","sidebarTitle":"Overview","icon":"list-check","href":"/integrations/browser-monitoring/configuration-for-browser-monitoring"},{"title":"Battery Level Monitoring","sidebarTitle":"Battery Level Monitoring","icon":"lightbulb","href":"/integrations/browser-monitoring/battery-level-monitoring"},{"title":"Browser Crash Monitoring","sidebarTitle":"Browser Crash Monitoring","icon":"lightbulb","href":"/integrations/browser-monitoring/browser-crash-monitoring"},{"title":"Browser Deprecated Features and Policy Violations Monitoring","sidebarTitle":"Browser Deprecated Features and Policy Violations Monitoring","icon":"lightbulb","href":"/integrations/browser-monitoring/deprecated-features-and-policy-violations-monitoring"},{"title":"Chat/CTI Monitoring","sidebarTitle":"Chat/CTI Monitoring","icon":"lightbulb","href":"/integrations/browser-monitoring/chat-cti-monitoring"},{"title":"Core Web Vitals","sidebarTitle":"Core Web Vitals","icon":"lightbulb","href":"/integrations/browser-monitoring/core-web-vitals"},{"title":"Dead, Error and Rage Click Monitoring","sidebarTitle":"Dead, Error and Rage Click Monitoring","icon":"lightbulb","href":"/integrations/browser-monitoring/dead-error-and-rage-click-monitoring"},{"title":"Element and Mark Performance Monitoring","sidebarTitle":"Element and Mark Performance Monitoring","icon":"lightbulb","href":"/integrations/browser-monitoring/element-and-mark-performance-monitoring"},{"title":"JavaScript and Page Memory Monitoring","sidebarTitle":"JavaScript and Page Memory Monitoring","icon":"lightbulb","href":"/integrations/browser-monitoring/javascript-and-page-memory-monitoring"},{"title":"JavaScript Console and Error Monitoring","sidebarTitle":"JavaScript Console and Error Monitoring","icon":"lightbulb","href":"/integrations/browser-monitoring/javascript-console-and-error-monitoring"},{"title":"JavaScript Long Task or Browser Freeze Detection Configuration","sidebarTitle":"JavaScript Long Task or Browser Freeze Detection Configuration","icon":"lightbulb","href":"/integrations/browser-monitoring/javascript-long-task-monitoring"},{"title":"Metadata Extractors","sidebarTitle":"Metadata Extractors","icon":"lightbulb","href":"/integrations/browser-monitoring/metadata-extractors"},{"title":"Network Requests Monitoring","sidebarTitle":"Network Requests Monitoring","icon":"lightbulb","href":"/integrations/browser-monitoring/network-requests-monitoring"},{"title":"Popup Dialog Monitoring","sidebarTitle":"Popup Dialog Monitoring","icon":"lightbulb","href":"/integrations/browser-monitoring/popup-dialog-monitoring"},{"title":"Server Timing Monitoring","sidebarTitle":"Server Timing Monitoring","icon":"lightbulb","href":"/integrations/browser-monitoring/server-timing-monitoring"},{"title":"Unhandled Promise Rejection Monitoring","sidebarTitle":"Unhandled Promise Rejection Monitoring","icon":"lightbulb","href":"/integrations/browser-monitoring/unhandled-promise-rejection-monitoring"},{"title":"Video Monitoring (Vimeo, ...)","sidebarTitle":"Video Monitoring (Vimeo, ...)","icon":"lightbulb","href":"/integrations/browser-monitoring/video-monitoring-vimeo"},{"title":"WebMCP Monitoring","sidebarTitle":"WebMCP Monitoring","icon":"lightbulb","href":"/integrations/browser-monitoring/webmcp-monitoring"},{"title":"WebSocket Monitoring","sidebarTitle":"WebSocket Monitoring","icon":"lightbulb","href":"/integrations/browser-monitoring/websocket-monitoring"}]},{"title":"KPIs for Browser Monitoring","sidebarTitle":"KPIs for Browser Monitoring","icon":"gauge","href":"/integrations/browser-monitoring/kpis-for-browser-monitoring"},{"title":"APIs for Browser Monitoring","sidebarTitle":"APIs for Browser Monitoring","icon":"code","href":"/integrations/browser-monitoring/apis-for-browser-monitoring"}]},{"title":"Channel Talk Observability","sidebarTitle":"Channel Talk Observability","icon":"plug","href":"/integrations/channel-talk-monitoring"},{"title":"Chatbot Observability","sidebarTitle":"Chatbot Observability","icon":"plug","href":"/integrations/chat-monitoring"},{"title":"Citrix Observability","sidebarTitle":"Citrix Observability","icon":"plug","href":"/integrations/citrix-user-monitoring"},{"title":"DB2 UDB Observability","sidebarTitle":"DB2 UDB Observability","icon":"plug","href":"/integrations/db2-udb-monitoring"},{"group":"Docker Observability","pages":[{"title":"Docker Observability","sidebarTitle":"Overview","icon":"plug","href":"/integrations/docker-monitoring/index"},{"title":"Deploy Monitoring for Docker","sidebarTitle":"Deploy Monitoring for Docker","icon":"rocket","href":"/integrations/docker-monitoring/deploy-monitoring-for-docker"}]},{"group":"Drupal Operational Experience Intelligence","pages":[{"title":"Drupal Operational Experience Intelligence","sidebarTitle":"Overview","icon":"plug","href":"/integrations/drupal-monitoring/index"},{"title":"Deploy Monitoring for Drupal","sidebarTitle":"Deploy Monitoring for Drupal","icon":"rocket","href":"/integrations/drupal-monitoring/deploy-monitoring-for-drupal"}]},{"title":"Files / Logs Observability","sidebarTitle":"Files / Logs Observability","icon":"plug","href":"/integrations/file-log-monitoring"},{"title":"Genesys Cloud Observability","sidebarTitle":"Genesys Cloud Observability","icon":"plug","href":"/integrations/genesys-cloud-desktop"},{"title":"Genesys CTI Observability","sidebarTitle":"Genesys CTI Observability","icon":"plug","href":"/integrations/genesys-monitoring"},{"group":"Go Observability","pages":[{"title":"Go Observability","sidebarTitle":"Overview","icon":"plug","href":"/integrations/golang-monitoring/index"},{"title":"Deploy Monitoring for GoLang","sidebarTitle":"Deploy Monitoring for GoLang","icon":"rocket","href":"/integrations/golang-monitoring/deploy-code-profiling-usage-monitoring-for-golang"},{"title":"Configure Monitoring for GoLang","sidebarTitle":"Configure Monitoring for GoLang","description":"Verify that GermainUX receives Go profiling data, then customize Go analytics, alerts and automated actions, dashboards, and reports.","icon":"table-columns","href":"/integrations/golang-monitoring/configure-analytics-automation-dashboard-and-report-for-golang"}]},{"title":"Hazelcast Monitoring","sidebarTitle":"Hazelcast","icon":"plug","href":"/integrations/hazelcast-monitoring"},{"group":"HTML/JQuery Operational Experience Intelligence","pages":[{"title":"HTML/JQuery Operational Experience Intelligence","sidebarTitle":"Overview","description":"GermainUX monitors HTML and jQuery applications across the user experience, business workflows, browser, JavaScript, network, and supporting backend services.","icon":"plug","href":"/integrations/html-jquery-monitoring/index"},{"title":"Deploy Monitoring for HTML/JQuery","sidebarTitle":"Deploy Monitoring for HTML/JQuery","icon":"rocket","href":"/integrations/html-jquery-monitoring/deploy-monitoring-for-html-jquery"}]},{"title":"HPUX Observability","sidebarTitle":"HPUX Observability","icon":"plug","href":"/integrations/hpux-monitoring"},{"title":"IIS / Internet Information Services Observability","sidebarTitle":"IIS / Internet Information Services Observability","icon":"plug","href":"/integrations/iis-log-parsing-monitoring"},{"title":"IMAP Observability","sidebarTitle":"IMAP Observability","icon":"plug","href":"/integrations/imap-monitoring"},{"group":"Java Operational Experience Intelligence","pages":[{"title":"Java Operational Experience Intelligence","sidebarTitle":"Overview","icon":"plug","href":"/integrations/java-monitoring/index"},{"title":"Deploy Monitoring for Java","sidebarTitle":"Deploy Monitoring for Java","icon":"rocket","href":"/integrations/java-monitoring/deploy-monitoring-automation-for-java-with-germainux"},{"title":"Configure Monitoring for Java","sidebarTitle":"Configure Monitoring for Java","icon":"list-check","href":"/integrations/java-monitoring/configuring-monitoring-and-automation-for-java-with-germainux"}]},{"group":"JavaScript Observability","pages":[{"title":"JavaScript Observability","sidebarTitle":"Overview","icon":"plug","href":"/integrations/javascript-profiling/index"},{"title":"Deploy Monitoring for JavaScript","sidebarTitle":"Deploy Monitoring for JavaScript","icon":"rocket","href":"/integrations/javascript-profiling/deploy-monitoring-for-javascript"},{"title":"Configure Monitoring for JavaScript","sidebarTitle":"Configure Monitoring for JavaScript","icon":"list-check","href":"/integrations/javascript-profiling/configure-monitoring-for-javascript"}]},{"title":"Kafka Observability","sidebarTitle":"Kafka Observability","icon":"plug","href":"/integrations/apache-kafka-monitoring"},{"group":"Kubernetes Observability","pages":[{"title":"Kubernetes Observability","sidebarTitle":"Overview","icon":"plug","href":"/integrations/kubernetes-monitoring/index"},{"title":"Deploy Monitoring for Kubernetes","sidebarTitle":"Deploy Monitoring for Kubernetes","icon":"rocket","href":"/integrations/kubernetes-monitoring/deploy-monitoring-for-kubernetes"},{"title":"Kubernetes KPIs","sidebarTitle":"Kubernetes KPIs","icon":"gauge","href":"/integrations/kubernetes-monitoring/kubernetes-kpis"}]},{"group":"Linux (RedHat, SUSE) Observability","pages":[{"title":"Linux (RedHat, SUSE) Observability","sidebarTitle":"Overview","icon":"plug","href":"/integrations/linux-redhat-suse-monitoring/index"},{"title":"Deploy Monitoring for Linux","sidebarTitle":"Deploy Monitoring for Linux","icon":"rocket","href":"/integrations/linux-redhat-suse-monitoring/deploy-monitoring-for-linux"}]},{"group":"Magento Operational Experience Intelligence","pages":[{"title":"Magento Operational Experience Intelligence","sidebarTitle":"Overview","icon":"plug","href":"/integrations/magento-monitoring/index"},{"title":"Deploy Monitoring for Magento","sidebarTitle":"Deploy Monitoring for Magento","icon":"rocket","href":"/integrations/magento-monitoring/deploy-monitoring-for-magento"},{"title":"Configure Error Monitoring for Magento","sidebarTitle":"Configure Error Monitoring for Magento","icon":"list-check","href":"/integrations/magento-monitoring/deploy-critical-user-error-monitoring-for-magento"}]},{"group":"Marko Operational Experience Intelligence","pages":[{"title":"Marko Operational Experience Intelligence","sidebarTitle":"Overview","icon":"plug","href":"/integrations/markojs-monitoring/index"},{"title":"Deploy Monitoring for MarkoJS","sidebarTitle":"Deploy Monitoring for MarkoJS","icon":"rocket","href":"/integrations/markojs-monitoring/deploy-monitoring-for-marko"},{"title":"Configure Monitoring for MarkoJS","sidebarTitle":"Configure Monitoring for MarkoJS","icon":"list-check","href":"/integrations/markojs-monitoring/configure-monitoring-for-markojs"}]},{"title":"GermainUX MCP Server","sidebarTitle":"MCP Server","icon":"plug","href":"/integrations/mcp-server"},{"group":"Microsoft Dynamics 365 Operational Experience Intelligence","pages":[{"title":"Microsoft Dynamics 365 Operational Experience Intelligence","sidebarTitle":"Overview","icon":"plug","href":"/integrations/microsoft-dynamics-365-monitoring/index"},{"title":"Deploy Monitoring for Microsoft Dynamics 365","sidebarTitle":"Deploy Monitoring for Microsoft Dynamics 365","icon":"rocket","href":"/integrations/microsoft-dynamics-365-monitoring/deploy-monitoring-for-microsoft-dynamics-365"}]},{"group":"Microsoft Power BI Operational Experience Intelligence","pages":[{"title":"Microsoft Power BI Operational Experience Intelligence","sidebarTitle":"Overview","icon":"plug","href":"/integrations/microsoft-power-bi-monitoring/index"},{"title":"Deploy Monitoring for Microsoft Power BI","sidebarTitle":"Deploy Monitoring for Microsoft Power BI","icon":"rocket","href":"/integrations/microsoft-power-bi-monitoring/deploy-monitoring-for-microsoft-power-bi"},{"title":"Configure Monitoring for Microsoft Power BI","sidebarTitle":"Configure Monitoring for Microsoft Power BI","icon":"list-check","href":"/integrations/microsoft-power-bi-monitoring/configure-monitoring-for-microsoft-power-bi"}]},{"group":"Microsoft SQL Server Observability","pages":[{"title":"Microsoft SQL Server Observability","sidebarTitle":"Overview","icon":"plug","href":"/integrations/sql-server-monitoring/index"},{"title":"Deploy Monitoring for Microsoft SQL Server","sidebarTitle":"Deploy Monitoring for Microsoft SQL Server","icon":"rocket","href":"/integrations/sql-server-monitoring/deploy-monitoring-for-microsoft-sql-server"},{"title":"Configure Monitoring for Microsoft SQL Server","sidebarTitle":"Configure Monitoring for Microsoft SQL Server","icon":"gauge","href":"/integrations/sql-server-monitoring/configure-monitoring-for-microsoft-sql-server"}]},{"title":"Microsoft Teams","icon":"lightbulb","href":"/integrations/microsoft-teams-notifications"},{"group":"Mobile Operational Experience Intelligence","pages":[{"title":"Mobile Operational Experience Intelligence","sidebarTitle":"Overview","icon":"plug","href":"/integrations/mobile-monitoring/index"},{"title":"Deploy Monitoring for Mobile Applications and Devices","sidebarTitle":"Deploy Monitoring for Mobile Applications and Devices","icon":"rocket","href":"/integrations/mobile-monitoring/deploying-germainux-monitoring-for-mobile-applications-and-devices"},{"title":"Configure Monitoring for Mobile Applications","sidebarTitle":"Configure Monitoring for Mobile Applications","icon":"list-check","href":"/integrations/mobile-monitoring/configuring-monitoring-for-mobile-applications-with-germainux"}]},{"title":"Moogsoft Incident Intelligence","icon":"lightbulb","href":"/integrations/moogsoft-incident-intelligence"},{"group":"MuleSoft Observability","pages":[{"title":"MuleSoft Observability","sidebarTitle":"Overview","icon":"plug","href":"/integrations/mulesoft-monitoring/index"},{"title":"Deploy Monitoring for MuleSoft","sidebarTitle":"Deploy Monitoring for MuleSoft","icon":"rocket","href":"/integrations/mulesoft-monitoring/deploying-germainux-monitoring-for-mulesoft-a-step-by-step-guide"},{"title":"Configure Monitoring for MuleSoft","sidebarTitle":"Configure Monitoring for MuleSoft","icon":"gauge","href":"/integrations/mulesoft-monitoring/configure-monitoring-for-mulesoft"},{"title":"Anypoint Platform Monitoring for MuleSoft","sidebarTitle":"Anypoint Platform Monitoring","icon":"cloud","href":"/integrations/mulesoft-monitoring/mulesoft-anypoint-platform-monitoring"},{"title":"Runtime Monitoring for MuleSoft","sidebarTitle":"Runtime Monitoring","icon":"server","href":"/integrations/mulesoft-monitoring/mulesoft-runtime-monitoring"}]},{"group":"MySQL Observability","pages":[{"title":"MySQL Observability","sidebarTitle":"Overview","icon":"plug","href":"/integrations/mysql-monitoring/index"},{"title":"Deploy Monitoring for MySQL","sidebarTitle":"Deploy Monitoring for MySQL","icon":"rocket","href":"/integrations/mysql-monitoring/deploy-monitoring-for-mysql-with-germainux"},{"title":"Configure Monitoring for MySQL","sidebarTitle":"Configure Monitoring for MySQL","icon":"gauge","href":"/integrations/mysql-monitoring/configure-monitoring-for-mysql"}]},{"group":"Network Observability","pages":[{"title":"Network Observability","sidebarTitle":"Overview","icon":"plug","href":"/integrations/network-monitoring/index"},{"title":"Deploy Monitoring for Networks","sidebarTitle":"Deploy Monitoring for Networks","icon":"rocket","href":"/integrations/network-monitoring/deploy-monitoring-for-network"},{"title":"Configure Monitoring for Networks","sidebarTitle":"Configure Monitoring for Networks","icon":"list-check","href":"/integrations/network-monitoring/configure-monitoring-for-network"}]},{"title":"Nginx Web Server Monitoring","sidebarTitle":"Nginx","icon":"plug","href":"/integrations/nginx-monitoring"},{"group":"Node.js Observability","pages":[{"title":"Node.js Observability","sidebarTitle":"Overview","icon":"plug","href":"/integrations/node-js-monitoring/index"},{"title":"Deploy Monitoring for Node.js","sidebarTitle":"Deploy Monitoring for Node.js","icon":"rocket","href":"/integrations/node-js-monitoring/node-js-monitoring-deployment"},{"group":"Configure Monitoring for Node.js","pages":[{"title":"Configure Monitoring for Node.js","sidebarTitle":"Overview","icon":"list-check","href":"/integrations/node-js-monitoring/node-js-monitoring-configuration"},{"title":"Node.js Error and Exception Monitoring","sidebarTitle":"Node.js Error and Exception Monitoring","icon":"lightbulb","href":"/integrations/node-js-monitoring/node-js-error-and-exception-monitoring"},{"title":"Node.js Network Monitoring","sidebarTitle":"Node.js Network Monitoring","href":"/integrations/node-js-monitoring/node-js-network-monitoring"}]}]},{"group":"OBIEE Observability","pages":[{"title":"OBIEE Observability","sidebarTitle":"Overview","icon":"plug","href":"/integrations/obiee-monitoring/index"},{"title":"Deploy Monitoring for OBIEE","sidebarTitle":"Deploy Monitoring for OBIEE","icon":"rocket","href":"/integrations/obiee-monitoring/deploy-monitoring-for-obiee"},{"title":"Configure Monitoring for OBIEE","sidebarTitle":"Configure Monitoring for OBIEE","icon":"list-check","href":"/integrations/obiee-monitoring/configuring-monitoring-automation-for-obiee"}]},{"group":"Olark Operational Experience Intelligence","pages":[{"title":"Olark Operational Experience Intelligence","sidebarTitle":"Overview","icon":"plug","href":"/integrations/olark-monitoring/index"},{"title":"Deploy Monitoring for Olark","sidebarTitle":"Deploy Monitoring for Olark","icon":"rocket","href":"/integrations/olark-monitoring/deploying-germainux-monitoring-for-olark"},{"title":"Configure Monitoring for Olark","sidebarTitle":"Configure Monitoring for Olark","icon":"list-check","href":"/integrations/olark-monitoring/configure-monitoring-for-olark"}]},{"group":"Oracle Analytics Cloud Observability","pages":[{"title":"Oracle Analytics Cloud Observability","sidebarTitle":"Overview","icon":"plug","href":"/integrations/oracle-analytics-cloud-observability/index"},{"title":"Deploy Monitoring for Oracle Analytics Cloud","sidebarTitle":"Deploy Monitoring for Oracle Analytics Cloud","icon":"rocket","href":"/integrations/oracle-analytics-cloud-observability/deploy-monitoring-for-oracle-analytics-cloud"},{"title":"Configure Monitoring for Oracle Analytics Cloud","sidebarTitle":"Configure Monitoring for Oracle Analytics Cloud","icon":"list-check","href":"/integrations/oracle-analytics-cloud-observability/configure-monitoring-for-oracle-analytics-cloud"}]},{"group":"Oracle DB Observability","pages":[{"title":"Oracle DB Observability","sidebarTitle":"Overview","icon":"plug","href":"/integrations/oracle-db-observability/index"},{"title":"Configure Monitoring for Oracle Database","sidebarTitle":"Configure Monitoring for Oracle Database","icon":"list-check","href":"/integrations/oracle-db-observability/configure-monitoring-for-oracle-database"},{"title":"Deploy Monitoring for Oracle Database","sidebarTitle":"Deploy Monitoring for Oracle Database","icon":"rocket","href":"/integrations/oracle-db-observability/deploy-monitoring-for-oracle-database"}]},{"group":"Oracle Siebel CRM Operational Experience Intelligence","pages":[{"title":"Oracle Siebel CRM Operational Experience Intelligence","sidebarTitle":"Overview","icon":"plug","href":"/integrations/oracle-siebel-crm/index"},{"group":"Deploy Monitoring for Oracle Siebel CRM","pages":[{"title":"Deploy Monitoring for Oracle Siebel CRM","sidebarTitle":"Overview","icon":"rocket","href":"/integrations/oracle-siebel-crm/oracle-siebel-crm-monitoring-deployment"},{"title":"Engine Deployment for Oracle Siebel CRM","sidebarTitle":"Engine Deployment for Oracle Siebel CRM","icon":"rocket","href":"/integrations/oracle-siebel-crm/engine-deployment-for-oracle-siebel-crm"},{"title":"JS Profiler Deployment for Oracle Siebel CRM","sidebarTitle":"JS Profiler Deployment for Oracle Siebel CRM","icon":"rocket","href":"/integrations/oracle-siebel-crm/js-profiler-deployment-for-oracle-siebel-crm"},{"title":"RPA Bot Recorder Deployment for Oracle Siebel CRM","sidebarTitle":"RPA Bot Recorder Deployment for Oracle Siebel CRM","icon":"rocket","href":"/integrations/oracle-siebel-crm/rpa-bot-recorder-deployment-for-oracle-siebel-crm"},{"title":"RUM JS Deployment for Oracle Siebel CRM","sidebarTitle":"RUM JS Deployment for Oracle Siebel CRM","icon":"rocket","href":"/integrations/oracle-siebel-crm/deploy-rum-js-siebel-openui"}]},{"group":"Configure Monitoring for Oracle Siebel CRM","pages":[{"title":"Configure Monitoring for Oracle Siebel CRM","sidebarTitle":"Overview","icon":"list-check","href":"/integrations/oracle-siebel-crm/oracle-siebel-crm-monitoring-configuration"},{"title":"Application Monitoring for Oracle Siebel CRM (Configure)","sidebarTitle":"Application Monitoring for Oracle Siebel CRM (Configure)","icon":"list-check","href":"/integrations/oracle-siebel-crm/siebel-application-monitoring-configuration"},{"title":"Business Process Monitoring for Oracle Siebel CRM (Configure)","sidebarTitle":"Business Process Monitoring for Oracle Siebel CRM (Configure)","icon":"list-check","href":"/integrations/oracle-siebel-crm/siebel-business-process-monitoring-configuration"},{"title":"Crash Monitoring for Oracle Siebel CRM (Configure)","sidebarTitle":"Crash Monitoring for Oracle Siebel CRM (Configure)","icon":"list-check","href":"/integrations/oracle-siebel-crm/siebel-crash-monitoring-configuration"},{"title":"Error Monitoring for Oracle Siebel CRM (Configure)","sidebarTitle":"Error Monitoring for Oracle Siebel CRM (Configure)","icon":"list-check","href":"/integrations/oracle-siebel-crm/siebel-error-monitoring-configuration"},{"title":"eScript \u0026 Browser Real-Time Debugger for Oracle Siebel CRM (Configure)","sidebarTitle":"eScript \u0026 Browser Real-Time Debugger for Oracle Siebel CRM (Configure)","icon":"list-check","href":"/integrations/oracle-siebel-crm/siebel-escript-real-time-debugger-configuration"},{"title":"Outlier Detection for Oracle Siebel CRM (Configuration)","sidebarTitle":"Outlier Detection for Oracle Siebel CRM (Configuration)","icon":"list-check","href":"/integrations/oracle-siebel-crm/outlier-detection-for-oracle-siebel-crm-configuration"},{"title":"RPA Bots for Proactive Issue Detection and Resolution (Configure)","sidebarTitle":"RPA Bots for Proactive Issue Detection and Resolution (Configure)","icon":"list-check","href":"/integrations/oracle-siebel-crm/rpa-bots-for-proactive-issue-detection-and-resolution"},{"title":"Synthetic User Scenario for Oracle Siebel CRM (Recording)","sidebarTitle":"Synthetic User Scenario for Oracle Siebel CRM (Recording)","icon":"list-check","href":"/integrations/oracle-siebel-crm/synthetic-user-scenario-recording"},{"title":"User Feedback for Oracle Siebel CRM (Configure)","sidebarTitle":"User Feedback for Oracle Siebel CRM (Configure)","icon":"list-check","href":"/integrations/oracle-siebel-crm/siebel-user-feedback-configuration"},{"title":"User Monitoring and Session Replay for Oracle Siebel CRM (Configure)","sidebarTitle":"User Monitoring and Session Replay for Oracle Siebel CRM (Configure)","icon":"list-check","href":"/integrations/oracle-siebel-crm/siebel-user-monitoring-and-replay-configuration"}]},{"title":"KPIs for Oracle Siebel CRM Monitoring","sidebarTitle":"KPIs","icon":"gauge","href":"/integrations/oracle-siebel-crm/oracle-siebel-crm-monitoring-kpis"}]},{"group":"PHP Observability","pages":[{"title":"PHP Observability","sidebarTitle":"Overview","icon":"plug","href":"/integrations/php-monitoring/index"},{"title":"Deploy Monitoring for PHP","sidebarTitle":"Deploy Monitoring for PHP","icon":"rocket","href":"/integrations/php-monitoring/deploy-monitoring-for-php"},{"title":"Configure Monitoring for PHP","sidebarTitle":"Configure Monitoring for PHP","icon":"list-check","href":"/integrations/php-monitoring/configure-monitoring-for-php"}]},{"title":"Plugins (Integrate to Other Technologies)","sidebarTitle":"Plugins (Integrate to Other Technologies)","icon":"lightbulb","href":"/integrations/other-plugins"},{"group":"POP3 Mailbox Observability","pages":[{"title":"POP3 Mailbox Observability","sidebarTitle":"Overview","icon":"plug","href":"/integrations/pop3-mailbox-monitoring/index"},{"title":"Configure Monitoring for POP3 Mailbox","sidebarTitle":"Configure Monitoring for POP3 Mailbox","icon":"list-check","href":"/integrations/pop3-mailbox-monitoring/configure-pop3-mailbox"},{"title":"Deploy Monitoring for POP3 Mailbox","sidebarTitle":"Deploy Monitoring for POP3 Mailbox","icon":"rocket","href":"/integrations/pop3-mailbox-monitoring/deploy-monitoring-for-pop3-mailbox"}]},{"group":"ReactJS Operational Experience Intelligence","pages":[{"title":"ReactJS Operational Experience Intelligence","sidebarTitle":"Overview","icon":"plug","href":"/integrations/react-js-monitoring/index"},{"title":"Deploy Monitoring for ReactJS","sidebarTitle":"Deploy Monitoring for ReactJS","icon":"rocket","href":"/integrations/react-js-monitoring/deploy-monitoring-for-reactjs"},{"title":"Configure Monitoring for ReactJS","sidebarTitle":"Configure Monitoring for ReactJS","icon":"list-check","href":"/integrations/react-js-monitoring/configuring-germainux-monitoring-for-reactjs-applications"}]},{"group":"RingCentral Operational Experience Intelligence","pages":[{"title":"RingCentral Operational Experience Intelligence","sidebarTitle":"Overview","icon":"plug","href":"/integrations/ringcentral-monitoring/index"},{"title":"Deploy Monitoring for RingCentral","sidebarTitle":"Deploy Monitoring for RingCentral","icon":"rocket","href":"/integrations/ringcentral-monitoring/deploy-monitoring-for-ringcentral"},{"title":"Configure Monitoring for RingCentral","sidebarTitle":"Configure Monitoring for RingCentral","icon":"list-check","href":"/integrations/ringcentral-monitoring/configure-monitoring-for-ringcentral"}]},{"group":"Salesforce Experience Cloud Operational Experience Intelligence","pages":[{"title":"Salesforce Experience Cloud Operational Experience Intelligence","sidebarTitle":"Overview","icon":"plug","href":"/integrations/salesforce-experience-cloud-monitoring/index"},{"title":"Deploy Monitoring for Salesforce Experience Cloud","sidebarTitle":"Deploy Monitoring for Salesforce Experience Cloud","icon":"rocket","href":"/integrations/salesforce-experience-cloud-monitoring/deploy-monitoring-for-sfdc-experience-cloud"},{"group":"Configure Monitoring for Salesforce Experience Cloud","pages":[{"title":"Configure Monitoring for Salesforce Experience Cloud","sidebarTitle":"Overview","icon":"list-check","href":"/integrations/salesforce-experience-cloud-monitoring/configure-monitoring-for-salesforce-experience-cloud"},{"title":"User Feedback for Salesforce Experience Cloud (Configure)","sidebarTitle":"User Feedback for Salesforce Experience Cloud (Configure)","icon":"list-check","href":"/integrations/salesforce-experience-cloud-monitoring/user-feedback-for-salesforce-experience-cloud-configure"},{"title":"User Monitoring for Salesforce Experience Cloud (Configure)","sidebarTitle":"User Monitoring for Salesforce Experience Cloud (Configure)","icon":"list-check","href":"/integrations/salesforce-experience-cloud-monitoring/user-monitoring-for-salesforce-experience-cloud-configure"}]},{"title":"KPIs for Salesforce Experience Cloud Monitoring","sidebarTitle":"KPIs for Salesforce Experience Cloud Monitoring","icon":"gauge","href":"/integrations/salesforce-experience-cloud-monitoring/kpis-for-salesforce-experience-cloud-monitoring"}]},{"group":"Salesforce Operational Experience Intelligence","pages":[{"title":"Salesforce Operational Experience Intelligence","sidebarTitle":"Overview","icon":"plug","href":"/integrations/salesforce-monitoring/index"},{"title":"Deploy Monitoring for Salesforce","sidebarTitle":"Deploy Monitoring for Salesforce","icon":"rocket","href":"/integrations/salesforce-monitoring/salesforce-monitoring-deployment"},{"group":"Configure Monitoring for Salesforce","pages":[{"title":"Configure Monitoring for Salesforce","sidebarTitle":"Overview","icon":"list-check","href":"/integrations/salesforce-monitoring/salesforce-monitoring-configuration"},{"title":"Agentforce Monitoring for Salesforce","sidebarTitle":"Agentforce Monitoring for Salesforce","icon":"list-check","href":"/integrations/salesforce-monitoring/salesforce-agentforce-monitoring"},{"title":"Apex Code Monitoring for Salesforce Cloud (Configure)","sidebarTitle":"Apex Code Monitoring for Salesforce Cloud (Configure)","icon":"list-check","href":"/integrations/salesforce-monitoring/salesforce-code-monitoring"},{"title":"Apex Exception Monitoring for Salesforce Cloud (Configure)","sidebarTitle":"Apex Exception Monitoring for Salesforce Cloud (Configure)","icon":"list-check","href":"/integrations/salesforce-monitoring/apex-exception-monitoring-for-salesforce-cloud-configure"},{"title":"Audit Monitoring for Salesforce Cloud (Configuration)","sidebarTitle":"Audit Monitoring for Salesforce Cloud (Configuration)","icon":"list-check","href":"/integrations/salesforce-monitoring/salesforce-audit-monitoring"},{"title":"Debug Log Monitoring for Salesforce Cloud (Configure)","sidebarTitle":"Debug Log Monitoring for Salesforce Cloud (Configure)","icon":"list-check","href":"/integrations/salesforce-monitoring/salesforce-debug-log-monitoring"},{"title":"Error Monitoring for Salesforce Cloud (Configure)","sidebarTitle":"Error Monitoring for Salesforce Cloud (Configure)","icon":"list-check","href":"/integrations/salesforce-monitoring/error-monitoring-for-salesforce-cloud-configure"},{"title":"Instance Status Monitoring for Salesforce Cloud (Configure)","sidebarTitle":"Instance Status Monitoring for Salesforce Cloud (Configure)","icon":"list-check","href":"/integrations/salesforce-monitoring/salesforce-instance-status-monitoring"},{"title":"Log Monitoring for Salesforce Cloud (Configure)","sidebarTitle":"Log Monitoring for Salesforce Cloud (Configure)","icon":"list-check","href":"/integrations/salesforce-monitoring/salesforce-log-monitoring"},{"title":"Omni-Channel Monitoring for Salesforce Cloud (Configure)","sidebarTitle":"Omni-Channel Monitoring for Salesforce Cloud (Configure)","icon":"list-check","href":"/integrations/salesforce-monitoring/omni-channel-monitoring-for-salesforce-cloud-configure"},{"title":"Real-Time Event Monitoring for Salesforce Cloud (Configure)","sidebarTitle":"Real-Time Event Monitoring for Salesforce Cloud (Configure)","icon":"list-check","href":"/integrations/salesforce-monitoring/salesforce-real-time-event-monitoring"},{"title":"Stats Monitoring for Salesforce Cloud (Configure)","sidebarTitle":"Stats Monitoring for Salesforce Cloud (Configure)","icon":"list-check","href":"/integrations/salesforce-monitoring/salesforce-stats-monitoring"},{"title":"User Click Analysis for Salesforce Cloud (Configure)","sidebarTitle":"User Click Analysis for Salesforce Cloud (Configure)","icon":"list-check","href":"/integrations/salesforce-monitoring/salesforce-user-click-analysis"},{"title":"User Feedback for Salesforce (Configure)","sidebarTitle":"User Feedback for Salesforce (Configure)","icon":"list-check","href":"/integrations/salesforce-monitoring/user-feedback-for-salesforce-configure"},{"title":"User Monitoring and Session Replay for Salesforce Cloud (Configure)","sidebarTitle":"User Monitoring and Session Replay for Salesforce Cloud (Configure)","icon":"list-check","href":"/integrations/salesforce-monitoring/salesforce-user-monitoring-and-replay"}]},{"title":"KPIs for Salesforce Monitoring","sidebarTitle":"KPIs for Salesforce Monitoring","icon":"gauge","href":"/integrations/salesforce-monitoring/salesforce-monitoring-kpis"},{"title":"APIs for Salesforce (Classic, Lightning)","sidebarTitle":"APIs for Salesforce (Classic, Lightning)","icon":"code","href":"/integrations/salesforce-monitoring/apis-for-salesforce-classic-lightning"}]},{"group":"SAP Commerce Cloud Operational Experience Intelligence","icon":"cubes","pages":[{"title":"SAP Commerce Cloud Operational Experience Intelligence","sidebarTitle":"Overview","href":"/integrations/sap-commerce-cloud/index"},{"group":"Deploy Monitoring for SAP Commerce Cloud","pages":[{"title":"Deploy Monitoring for SAP Commerce Cloud","sidebarTitle":"Overview","href":"/integrations/sap-commerce-cloud/deploy-monitoring-for-sap"},{"title":"Engine Deployment for SAP Commerce Cloud","href":"/integrations/sap-commerce-cloud/engine-deployment-for-sap"},{"title":"JS Profiler Deployment for SAP Commerce Cloud","href":"/integrations/sap-commerce-cloud/js-profiler-deployment-for-sap"},{"title":"RPA Bot Recorder Deployment for SAP Commerce Cloud","href":"/integrations/sap-commerce-cloud/rpa-bot-recorder-deployment-for-sap"},{"title":"RUM JS Deployment for SAP Commerce Cloud","href":"/integrations/sap-commerce-cloud/rum-js-deployment-for-sap"}]},{"group":"Configure Monitoring for SAP Commerce Cloud","pages":[{"title":"Configure Monitoring for SAP Commerce Cloud","sidebarTitle":"Overview","href":"/integrations/sap-commerce-cloud/configure-monitoring-for-sap"},{"title":"Browser Real-Time Debugger for SAP Commerce Cloud (Configure)","href":"/integrations/sap-commerce-cloud/abap-browser-real-time-debugger-for-sap-configure"},{"title":"Application Monitoring for SAP Commerce Cloud (Configure)","href":"/integrations/sap-commerce-cloud/application-monitoring-for-sap-configure"},{"title":"Business Process Monitoring for SAP Commerce Cloud (Configure)","href":"/integrations/sap-commerce-cloud/business-process-monitoring-for-sap-configure"},{"title":"Crash and Diagnostic-File Monitoring for SAP Commerce Cloud (Configure)","href":"/integrations/sap-commerce-cloud/crash-monitoring-for-sap-configure"},{"title":"Error Monitoring for SAP Commerce Cloud (Configure)","href":"/integrations/sap-commerce-cloud/error-monitoring-for-sap-configure"},{"title":"Outlier Detection for SAP Commerce Cloud (Configuration)","href":"/integrations/sap-commerce-cloud/outlier-detection-for-sap-configuration"},{"title":"RPA Bots for Proactive Issue Detection and Resolution for SAP Commerce Cloud (Configure)","href":"/integrations/sap-commerce-cloud/rpa-bots-for-proactive-issue-detection-and-resolution"},{"title":"User Feedback for SAP Commerce Cloud (Configure)","href":"/integrations/sap-commerce-cloud/user-feedback-for-sap-configure"},{"title":"User Monitoring and Session Replay for SAP Commerce Cloud (Configure)","href":"/integrations/sap-commerce-cloud/user-monitoring-and-session-replay-for-sap-configure"}]},{"title":"KPIs for SAP Commerce Cloud","href":"/integrations/sap-commerce-cloud/kpis-for-sap"}]},{"group":"SAP ERP Operational Experience Intelligence","icon":"cubes","pages":[{"title":"SAP ERP Operational Experience Intelligence","sidebarTitle":"Overview","icon":"plug","href":"/integrations/sap-erp/index"}]},{"group":"Shopify Operational Experience Intelligence","pages":[{"title":"Shopify Operational Experience Intelligence","sidebarTitle":"Overview","icon":"plug","href":"/integrations/shopify/index"},{"title":"Deploy Monitoring for Shopify","sidebarTitle":"Deploy Monitoring for Shopify","icon":"rocket","href":"/integrations/shopify/deploy-monitoring-for-shopify"},{"group":"Configure Monitoring for Shopify","pages":[{"title":"Configure Monitoring for Shopify","sidebarTitle":"Overview","icon":"list-check","href":"/integrations/shopify/configure-monitoring-for-shopify"},{"title":"3rd-Party Checkouts Monitoring for Shopify (Configure)","sidebarTitle":"3rd-Party Checkouts Monitoring for Shopify (Configure)","icon":"list-check","href":"/integrations/shopify/3rd-party-checkouts-monitoring-for-shopify-configure"},{"title":"Error Monitoring for Shopify (Configure)","sidebarTitle":"Error Monitoring for Shopify (Configure)","icon":"list-check","href":"/integrations/shopify/error-monitoring-for-shopify-configure"},{"title":"Shopify Events (Configure)","sidebarTitle":"Shopify Events (Configure)","icon":"list-check","href":"/integrations/shopify/configure-shopify-events-add-to-cart-remove-from-cart"},{"title":"User Feedback for Shopify (Configure)","sidebarTitle":"User Feedback for Shopify (Configure)","icon":"list-check","href":"/integrations/shopify/user-feedback-for-shopify-configure"}]},{"title":"KPIs for Shopify Monitoring","sidebarTitle":"KPIs for Shopify Monitoring","icon":"gauge","href":"/integrations/shopify/kpis-for-shopify-monitoring"}]},{"title":"ServiceNow Incident Intelligence","icon":"lightbulb","href":"/integrations/service-now-incident-intelligence"},{"title":"SnapLogic Operational Experience Intelligence","sidebarTitle":"SnapLogic Operational Experience Intelligence","icon":"plug","href":"/integrations/snaplogic-operational-experience-intelligence"},{"title":"Slack Notifications","icon":"lightbulb","href":"/integrations/slack-notifications"},{"group":"Soap Observability","pages":[{"title":"SOAP Observability","sidebarTitle":"Overview","icon":"plug","href":"/integrations/soap-monitoring/index"},{"title":"Deploy Monitoring for SOAP","sidebarTitle":"Deploy Monitoring for SOAP","icon":"rocket","href":"/integrations/soap-monitoring/deploy-monitoring-for-soap"},{"title":"Configure Monitoring for SOAP","sidebarTitle":"Configure Monitoring for SOAP","icon":"list-check","href":"/integrations/soap-monitoring/configure-monitoring-for-soap"}]},{"group":"Solaris Observability","pages":[{"title":"Solaris Observability","sidebarTitle":"Overview","icon":"plug","href":"/integrations/solaris-monitoring/index"},{"title":"Deploy Monitoring for Solaris","sidebarTitle":"Deploy Monitoring for Solaris","icon":"rocket","href":"/integrations/solaris-monitoring/deploy-monitoring-for-solaris"},{"title":"Configure Monitoring for Solaris","sidebarTitle":"Configure Monitoring for Solaris","icon":"list-check","href":"/integrations/solaris-monitoring/configure-monitoring-for-solaris"}]},{"group":"Squarespace Operational Experience Intelligence","pages":[{"title":"Squarespace Operational Experience Intelligence","sidebarTitle":"Overview","icon":"plug","href":"/integrations/squarespace-monitoring/index"},{"title":"Deploy Monitoring for Squarespace","sidebarTitle":"Deploy Monitoring for Squarespace","icon":"rocket","href":"/integrations/squarespace-monitoring/deploy-monitoring-for-squarespace"},{"title":"Configure Monitoring for Squarespace","sidebarTitle":"Configure Monitoring for Squarespace","icon":"list-check","href":"/integrations/squarespace-monitoring/configure-monitoring-for-squarespace"}]},{"group":"Tibco Observability","pages":[{"title":"Tibco Observability","sidebarTitle":"Overview","icon":"plug","href":"/integrations/tibco-monitoring/index"},{"title":"Deploy Monitoring for TIBCO","sidebarTitle":"Deploy Monitoring for TIBCO","href":"/integrations/tibco-monitoring/deploy-monitoring-for-tibco"},{"title":"Configure Monitoring for TIBCO","sidebarTitle":"Configure Monitoring for TIBCO","icon":"list-check","href":"/integrations/tibco-monitoring/configure-monitoring-for-tibco"}]},{"group":"Tomcat Observability","pages":[{"title":"Tomcat Observability","sidebarTitle":"Overview","icon":"plug","href":"/integrations/apache-tomcat-monitoring/index"},{"title":"Deploy Monitoring for Apache Tomcat","sidebarTitle":"Deploy Monitoring for Apache Tomcat","icon":"rocket","href":"/integrations/apache-tomcat-monitoring/deploy-monitoring-for-apache-tomcat"},{"title":"Configure Monitoring for Apache Tomcat","sidebarTitle":"Configure Monitoring for Apache Tomcat","icon":"list-check","href":"/integrations/apache-tomcat-monitoring/configure-monitoring-for-apache-tomcat"}]},{"title":"Vercel (AI Chat)","icon":"plug","href":"/integrations/vercel"},{"group":"Vue.js Operational Experience Intelligence","pages":[{"title":"Vue.js Operational Experience Intelligence","sidebarTitle":"Overview","icon":"plug","href":"/integrations/vue-js-monitoring/index"},{"title":"Deploy Monitoring for VueJS","sidebarTitle":"Deploy Monitoring for VueJS","icon":"rocket","href":"/integrations/vue-js-monitoring/deploy-monitoring-for-vuejs"},{"title":"Configure Monitoring for Vue.js","sidebarTitle":"Configure Monitoring for Vue.js","icon":"list-check","href":"/integrations/vue-js-monitoring/configure-monitoring-for-vue-js"}]},{"group":"Webflow Observability","pages":[{"title":"Webflow Observability","sidebarTitle":"Overview","icon":"plug","href":"/integrations/webflow-monitoring/index"},{"title":"Deploy Monitoring for Webflow","sidebarTitle":"Deploy Monitoring for Webflow","icon":"rocket","href":"/integrations/webflow-monitoring/deploy-monitoring-for-webflow"},{"title":"Configure Monitoring for Webflow","sidebarTitle":"Configure Monitoring for Webflow","icon":"list-check","href":"/integrations/webflow-monitoring/configure-monitoring-for-webflow"}]},{"group":"WebSphere MQ Observability","pages":[{"title":"WebSphere MQ Observability","sidebarTitle":"Overview","icon":"plug","href":"/integrations/websphere-mq-monitoring/index"},{"title":"Deploy Monitoring for IBM WebSphere MQ","sidebarTitle":"Deploy Monitoring for IBM WebSphere MQ","icon":"rocket","href":"/integrations/websphere-mq-monitoring/deploy-monitoring-for-ibm-websphere-mq"},{"title":"Configure Monitoring for IBM WebSphere MQ","sidebarTitle":"Configure Monitoring for IBM WebSphere MQ","icon":"list-check","href":"/integrations/websphere-mq-monitoring/configure-monitoring-for-ibm-websphere-mq"}]},{"group":"Windows Application Operational Experience Intelligence","pages":[{"title":"Windows Application Operational Experience Intelligence","sidebarTitle":"Overview","icon":"plug","href":"/integrations/windows-monitoring/index"},{"group":"Deploy Monitoring for Windows Application","pages":[{"title":"Deploy Monitoring for Windows Application","sidebarTitle":"Overview","icon":"rocket","href":"/integrations/windows-monitoring/deploy-monitoring-or-automation-for-windows-application"},{"title":"GermainUX Agent Installation","sidebarTitle":"GermainUX-Agent Installation","icon":"rocket","href":"/integrations/windows-monitoring/germainux-agent-installation"},{"title":"GermainUX Agent Settings (Registry)","sidebarTitle":"GermainUX-Agent Settings (Registry)","icon":"lightbulb","href":"/integrations/windows-monitoring/germainux-agent-settings-registry"}]},{"title":"Configure Monitoring for Windows Application","sidebarTitle":"Configure Monitoring for Windows Application","icon":"list-check","href":"/integrations/windows-monitoring/configure-monitoring-or-automation-for-windows-application"},{"title":"KPIs for Windows Application Monitoring, Automation \u0026 Session Replay","sidebarTitle":"KPIs for Windows Application Monitoring, Automation \u0026 Session Replay","icon":"gauge","href":"/integrations/windows-monitoring/kpis-for-windows-application-monitoring-automation-session-replay"},{"title":"GermainUX Agent Troubleshooting","sidebarTitle":"GermainUX Agent Troubleshooting","icon":"wrench","href":"/integrations/windows-monitoring/germainux-agent-troubleshooting"}]},{"group":"Wix Operational Experience Intelligence","pages":[{"title":"Wix Operational Experience Intelligence","sidebarTitle":"Overview","icon":"plug","href":"/integrations/wix-monitoring/index"},{"title":"Deploy Monitoring for Wix","sidebarTitle":"Deploy Monitoring for Wix","icon":"rocket","href":"/integrations/wix-monitoring/deploy-monitoring-for-wix"},{"title":"Configure Monitoring for Wix","sidebarTitle":"Configure Monitoring for Wix","icon":"list-check","href":"/integrations/wix-monitoring/configure-monitoring-for-wix"}]},{"group":"WooCommerce Operational Experience Intelligence","pages":[{"title":"WooCommerce Operational Experience Intelligence","sidebarTitle":"Overview","icon":"plug","href":"/integrations/woocommerce-monitoring/index"},{"title":"Deploy Monitoring for WooCommerce","sidebarTitle":"Deploy Monitoring for WooCommerce","icon":"rocket","href":"/integrations/woocommerce-monitoring/deploy-monitoring-for-woocommerce"},{"title":"Configure Monitoring for WooCommerce","sidebarTitle":"Configure Monitoring for WooCommerce","icon":"list-check","href":"/integrations/woocommerce-monitoring/configure-monitoring-for-woocommerce"}]},{"group":"WordPress Operational Experience Intelligence","pages":[{"title":"WordPress Operational Experience Intelligence","sidebarTitle":"Overview","icon":"plug","href":"/integrations/wordpress-monitoring/index"},{"title":"Deploy Monitoring for WordPress","sidebarTitle":"Deploy Monitoring for WordPress","icon":"rocket","href":"/integrations/wordpress-monitoring/deploy-monitoring-for-wordpress"},{"title":"Configure Monitoring for WordPress","sidebarTitle":"Configure Monitoring for WordPress","icon":"list-check","href":"/integrations/wordpress-monitoring/configure-monitoring-for-wordpress"}]},{"group":"Zookeeper Observability","pages":[{"title":"Zookeeper Observability","sidebarTitle":"Overview","icon":"plug","href":"/integrations/apache-zookeeper-monitoring/index"},{"title":"Deploy Monitoring for Apache ZooKeeper","sidebarTitle":"Deploy Monitoring for Apache ZooKeeper","icon":"rocket","href":"/integrations/apache-zookeeper-monitoring/deploy-monitoring-for-apache-zookeeper"},{"title":"Configure Monitoring for Apache ZooKeeper","sidebarTitle":"Configure Monitoring for Apache ZooKeeper","icon":"list-check","href":"/integrations/apache-zookeeper-monitoring/configure-monitoring-for-apache-zookeeper"}]}]},{"group":"Dashboards and Reports","icon":"table-columns","pages":[{"title":"Dashboards and Reports","sidebarTitle":"Overview","icon":"table-columns","href":"/dashboards/dashboard-and-report"},{"title":"AI Advice Dashboard","sidebarTitle":"AI Advice Dashboard","icon":"table-columns","href":"/dashboards/ai-advice-dashboard"},{"group":"Analytics Dashboard","pages":[{"title":"Analytics Dashboard","sidebarTitle":"Overview","icon":"table-columns","href":"/dashboards/analytics-dashboard/index"},{"group":"1-Aggregate Dashboard","pages":[{"title":"1-Aggregate Dashboard","sidebarTitle":"Overview","icon":"table-columns","href":"/dashboards/analytics-dashboard/1-aggregate-dashboard"},{"title":"Score Configuration (for \"Worst Instance..\")","sidebarTitle":"Score Configuration (for \"Worst Instance..\")","icon":"lightbulb","href":"/dashboards/analytics-dashboard/score-configuration-for-worst-instance"}]},{"title":"2-Pivot Dashboard","sidebarTitle":"2-Pivot Dashboard","icon":"table-columns","href":"/dashboards/analytics-dashboard/2-pivot-dashboard"},{"title":"3-Drill-Through Dashboard","sidebarTitle":"3-Drill-Through Dashboard","icon":"table-columns","href":"/dashboards/analytics-dashboard/3-drill-through-dashboard"},{"title":"4-Analysis Dashboard","sidebarTitle":"4-Analysis Dashboard","icon":"table-columns","href":"/dashboards/analytics-dashboard/4-analysis-dashboard"}]},{"title":"Configuration \u0026 Customization Dashboards","sidebarTitle":"Configuration \u0026 Customization Dashboards","icon":"table-columns","href":"/dashboards/management-dashboards"},{"title":"Frictions Dashboard","sidebarTitle":"Frictions Dashboard","icon":"table-columns","href":"/dashboards/frictions-dashboard"},{"title":"Notes and Tickets Dashboard","sidebarTitle":"Notes and Tickets Dashboard","icon":"table-columns","href":"/dashboards/note-ticket-dashboards"},{"group":"Operational Dashboard","pages":[{"title":"Operational Dashboard","sidebarTitle":"Overview","icon":"table-columns","href":"/dashboards/operational-dashboard/index"},{"title":"Adoption Tab","sidebarTitle":"Adoption Tab","icon":"table-columns","href":"/dashboards/operational-dashboard/adoption-tab"},{"title":"Conversion Tab","sidebarTitle":"Conversion Tab","icon":"table-columns","href":"/dashboards/operational-dashboard/conversion-tab"},{"title":"Productivity Tab","sidebarTitle":"Productivity Tab","icon":"table-columns","href":"/dashboards/operational-dashboard/productivity-tab"},{"title":"Experience Tab","sidebarTitle":"Experience Tab","icon":"table-columns","href":"/dashboards/operational-dashboard/experience-tab"},{"title":"Technology Health Tab","sidebarTitle":"Technology Health Tab","icon":"table-columns","href":"/dashboards/operational-dashboard/technology-health-tab"}]},{"title":"Reports (Manual)","sidebarTitle":"Reports (Manual)","icon":"lightbulb","href":"/dashboards/reports"},{"title":"Search and Filters","sidebarTitle":"Search and Filters","icon":"lightbulb","href":"/dashboards/search-and-filters"},{"title":"SLA Violation Dashboard","sidebarTitle":"SLA Violation Dashboard","icon":"gauge-high","href":"/dashboards/sla-violation-dashboard"}]},{"group":"Management","icon":"sliders","pages":[{"title":"Management","sidebarTitle":"Overview","icon":"sliders","href":"/management/index"},{"title":"AA Unit / Day","sidebarTitle":"AA Unit / Day","icon":"lightbulb","href":"/management/analytics-and-automation-unit-aa-unit"},{"title":"Access to Germain UI/Workspace","sidebarTitle":"Access to Germain UI/Workspace","icon":"lightbulb","href":"/management/request-access"},{"title":"AI Features Management","sidebarTitle":"AI Features Management","icon":"lightbulb","href":"/management/ai-settings"},{"title":"Configure GermainUX with WebMCP","sidebarTitle":"Configure with WebMCP","icon":"robot","href":"/management/configure-with-webmcp"},{"title":"Automation Management","sidebarTitle":"Automation Management","icon":"lightbulb","href":"/management/automation-management"},{"group":"Compliance, Data Privacy and Security","pages":[{"title":"Compliance, Data Privacy and Security","sidebarTitle":"Overview","icon":"lightbulb","href":"/management/compliance-privacy-and-security/index"},{"title":"AI Governance, Security, and Responsible Use","sidebarTitle":"AI Governance","icon":"scale-balanced","href":"/management/compliance-privacy-and-security/ai-governance"},{"title":"Certifications and Policies","sidebarTitle":"Certifications and Policies","icon":"lightbulb","href":"/management/compliance-privacy-and-security/compliance"},{"title":"Cookie Consent \u0026 User Privacy","sidebarTitle":"Cookie Consent \u0026 User Privacy","href":"/management/compliance-privacy-and-security/cookie-consent"},{"group":"Data Privacy","pages":[{"title":"Data Privacy","sidebarTitle":"Overview","icon":"lightbulb","href":"/management/compliance-privacy-and-security/data-privacy"},{"title":"AI Driven Detection","sidebarTitle":"AI Driven Detection","icon":"lightbulb","href":"/management/compliance-privacy-and-security/pii-detection-ai-driven"},{"title":"Exclusion Process","sidebarTitle":"Exclusion Process","icon":"lightbulb","href":"/management/compliance-privacy-and-security/exclusion-process"}]},{"title":"Data Security","sidebarTitle":"Data Security","icon":"lightbulb","href":"/management/compliance-privacy-and-security/data-security"},{"title":"Form Privacy and UX Monitoring Profile View","sidebarTitle":"Form Privacy and UX Monitoring Profile View","icon":"lightbulb","href":"/management/compliance-privacy-and-security/form-privacy-and-ux-monitoring-profile-view"}]},{"title":"Dashboard Management","sidebarTitle":"Dashboard Management","icon":"table-columns","href":"/management/dashboard-visibility-team-owners"},{"title":"Data Retention","sidebarTitle":"Data Retention","icon":"lightbulb","href":"/management/data-retention"},{"title":"Datasources","sidebarTitle":"Datasources","icon":"lightbulb","href":"/management/data-source"},{"group":"Data Warehouse","pages":[{"title":"Data Warehouse","sidebarTitle":"Overview","icon":"lightbulb","href":"/management/data-analysis/index"},{"title":"Data Model","sidebarTitle":"Data Model","icon":"lightbulb","href":"/management/data-analysis/data-model"},{"title":"Data Query API","sidebarTitle":"Data Query API","icon":"code","href":"/management/data-analysis/data-query-api"},{"title":"Data Ingestion API","sidebarTitle":"Data Ingestion API","icon":"code","href":"/management/data-analysis/data-ingestion-api"},{"title":"Dynamic Database Table Creation","sidebarTitle":"Dynamic Database Table Creation","icon":"lightbulb","href":"/management/data-analysis/dynamic-database-table-creation"},{"title":"Data Model Extensibility","sidebarTitle":"Data Model Extensibility","icon":"puzzle-piece","href":"/management/data-analysis/data-model-extensibility"}]},{"title":"Display Settings","sidebarTitle":"Display Settings","icon":"lightbulb","href":"/management/display-settings"},{"group":"Germain Health","pages":[{"title":"Germain Health","sidebarTitle":"Overview","icon":"lightbulb","href":"/management/germain-health/index"},{"title":"Disaster Recovery","sidebarTitle":"Disaster Recovery","icon":"lightbulb","href":"/management/germain-health/setting-up-disaster-recovery"},{"title":"Health Check Endpoint","sidebarTitle":"Health Check Endpoint","icon":"lightbulb","href":"/management/germain-health/health-check-endpoint"},{"title":"Prometheus Metrics","sidebarTitle":"Prometheus Metrics","href":"/management/germain-health/prometheus-metrics"}]},{"title":"KPIs Management","sidebarTitle":"KPIs Management","icon":"lightbulb","href":"/management/manage-kpis"},{"title":"License","sidebarTitle":"License","icon":"lightbulb","href":"/management/license"},{"title":"Maintenance Period","sidebarTitle":"Maintenance Period","icon":"lightbulb","href":"/management/maintenance-window"},{"title":"Monitoring Management","sidebarTitle":"Monitoring Management","href":"/management/monitoring-management"},{"title":"My Data: Save Insights for Later","sidebarTitle":"My Data: Save Insights for Later","icon":"lightbulb","href":"/management/my-data-save-this-for-later"},{"title":"MySQL Database Backup","sidebarTitle":"MySQL Database Backup","icon":"lightbulb","href":"/management/how-to-backup-mysql-databases"},{"title":"Note and Ticket Management","sidebarTitle":"Note and Ticket Management","icon":"lightbulb","href":"/management/note-ticket-management"},{"title":"Presentation Mode","sidebarTitle":"Presentation Mode","icon":"lightbulb","href":"/management/presentation-mode"},{"title":"Profiles: Monitoring and Automation Sets","sidebarTitle":"Profiles: Monitoring and Automation Sets","icon":"lightbulb","href":"/management/profiles-to-deploy-at-scale"},{"group":"Template Editor for Alerts and Reports","pages":[{"title":"Template Editor for Alerts and Reports","sidebarTitle":"Overview","icon":"lightbulb","href":"/management/templates/index"},{"title":"Edit a Template","sidebarTitle":"Edit a Template","icon":"list-check","href":"/management/templates/edit-a-template"},{"title":"Template Audit Trail","sidebarTitle":"Template Audit Trail","icon":"lightbulb","href":"/management/templates/audit-trail-of-a-template"}]},{"title":"Time Ranges","sidebarTitle":"Time Ranges","icon":"lightbulb","href":"/management/time-ranges"},{"group":"User Management","pages":[{"title":"User Management","sidebarTitle":"Overview","icon":"lightbulb","href":"/management/user-management/index"},{"group":"Users","pages":[{"title":"Users","sidebarTitle":"Overview","icon":"lightbulb","href":"/management/user-management/users"},{"title":"Database Users and Roles","sidebarTitle":"Database Users and Roles","icon":"lightbulb","href":"/management/user-management/database-user-management"},{"title":"LDAP User Management","sidebarTitle":"LDAP User Management","icon":"lightbulb","href":"/management/user-management/ldap-user-management"},{"group":"OAuth User Management","pages":[{"title":"OAuth User Management","sidebarTitle":"Overview","icon":"lightbulb","href":"/management/user-management/oauth-user-management"},{"title":"Okta User Management","sidebarTitle":"Okta User Management","icon":"lightbulb","href":"/management/user-management/okta-oauth-integration-with-germain"},{"title":"PingFederate OIDC","sidebarTitle":"PingFederate OIDC","icon":"lightbulb","href":"/management/user-management/ping-federated-oidc"},{"title":"PingID User Management","sidebarTitle":"PingID User Management","icon":"lightbulb","href":"/management/user-management/pingid"}]},{"title":"Password Reset","sidebarTitle":"Password Reset","icon":"lightbulb","href":"/management/user-management/password-reset"},{"title":"User Access Request","sidebarTitle":"User Access Request","icon":"lightbulb","href":"/management/user-management/user-access-request"},{"title":"Windows Active Directory User Management","sidebarTitle":"Windows Active Directory User Management","icon":"lightbulb","href":"/management/user-management/windows-active-directory-user-management"}]},{"title":"Roles","sidebarTitle":"Roles","icon":"lightbulb","href":"/management/user-management/users-roles"},{"title":"Teams","sidebarTitle":"Teams","icon":"lightbulb","href":"/management/user-management/teams"},{"title":"API Keys","sidebarTitle":"API Keys","icon":"code","href":"/management/user-management/api-keys"}]},{"title":"Wizard","sidebarTitle":"Wizard","icon":"lightbulb","href":"/management/wizard"},{"title":"Workspace","sidebarTitle":"Workspace","icon":"lightbulb","href":"/management/workspace"}]}]},{"group":"Editor Toolkit","icon":"toolbox","hidden":true,"pages":[{"title":"Gx brand","href":"/snippets/gx-brand"},{"title":"Template: Feature or concept page","sidebarTitle":"Feature or concept","icon":"lightbulb","href":"/templates/feature-page"},{"title":"Template: How-to or configuration guide","sidebarTitle":"How-to guide","icon":"list-check","href":"/templates/how-to-guide"},{"title":"Template: Deployment guide","sidebarTitle":"Deployment guide","icon":"rocket","href":"/templates/deployment-guide"},{"title":"Template: Integration overview","sidebarTitle":"Integration overview","icon":"plug","href":"/templates/integration-overview"},{"title":"Template: KPI reference","sidebarTitle":"KPI reference","icon":"gauge","href":"/templates/kpi-reference"},{"title":"Template: Dashboard guide","sidebarTitle":"Dashboard guide","icon":"table-columns","href":"/templates/dashboard-guide"},{"title":"Template: Release notes","sidebarTitle":"Release notes","icon":"rocket","href":"/templates/release-notes"},{"title":"Template: Section landing page","sidebarTitle":"Section landing page","icon":"folder-open","href":"/templates/section-landing"},{"title":"Template: Success story","sidebarTitle":"Success story","icon":"trophy","href":"/templates/success-story"},{"title":"Template: API reference","sidebarTitle":"API reference","icon":"code","href":"/templates/api-reference"},{"title":"Template: Reference or requirements","sidebarTitle":"Reference","icon":"book","href":"/templates/reference"},{"title":"Template: Troubleshooting guide","sidebarTitle":"Troubleshooting","icon":"wrench","href":"/templates/troubleshooting"},{"title":"Template: Release notes archive (2018 to 2022)","sidebarTitle":"Release notes archive","icon":"box-archive","href":"/templates/release-notes-archive"}]}]},{"tab":"Release Notes","pages":[{"title":"Release Notes","href":"/release-notes/overview"}]},{"tab":"Success Stories","pages":[{"title":"Success Stories","href":"/success-stories/overview"}]},{"tab":"Use Cases","pages":[{"title":"Use Cases","href":"/use-cases/overview"}]}]},"basePath":"","title":"Hazelcast Monitoring - GermainUX Docs","buildId":"dpl_715YoAgvjTGBDdo8RtXmHKM22b5p","deploymentId":"dpl_715YoAgvjTGBDdo8RtXmHKM22b5p","dynamics":["07c022d89b","a74be98ba7"],"chunks":["Frame-vIkpUzVS.js","DynamicMarkdown-TAXIW2vN.js","zoom-image-lightbox-y00V8U6G.js","lightbox-handle-r17bVUz3.js"]}