

Before You Start
Deploy
Validate
Troubleshooting
Overview
The Salesforce.com Application Monitoring wizard connects a GermainUX Engine to one Salesforce org through the Salesforce API. It deploys the components that collect Event Monitoring logs, debug logs, org limits, audit and deployment history, usage statistics, Apex code and coverage, and instance status. For what Salesforce monitoring gives you, see Salesforce Operational Experience Intelligence. Browser monitoring (RUM JS or RUM Extension) is a separate deployment, described in Deploy Monitoring for Salesforce.What the Wizard Creates
The wizard creates these components on the Engine you select. All of them belong to the Salesforce Application profile.Before You Start
- A GermainUX Engine that can reach Salesforce. See GermainUX Engine.
- Outbound HTTPS (port 443) from the Engine to your My Domain host (for example
acme.my.salesforce.com), to the login host you use (login.salesforce.comortest.salesforce.com), and toapi.status.salesforce.comfor instance status. - The Salesforce Event Monitoring add-on, for the Event Log Monitor. Without it, Salesforce provides no hourly event log files, and the other components still work.
- A dedicated Salesforce integration user. Make it an API-only user, and don’t use a personal administrator account.
- A Salesforce app for the login: an existing Connected App for username and password login, or an External Client App for JWT bearer login. See Prepare Salesforce.
- Two folders on the Engine host with write access: one for event log files and one for debug logs.
- Trace flags in Salesforce for the users whose debug logs you want. GermainUX collects debug logs that already exist and doesn’t create trace flags.
Permissions for the Integration User
Give the integration user these permissions through a permission set:Deploy
Prepare Salesforce
Salesforce supports two logins for this integration. The wizard sets up username and password login. JWT bearer login uses a certificate instead of a password, and you switch the components to it after you run the wizard.- Username and Password
- JWT Bearer
Allow the username-password flow
Check the Connected App
Authorize the integration user
Decide on IP restrictions
Run the Wizard
Open the wizard
Select the Engine host
Fill in the fields
Finish
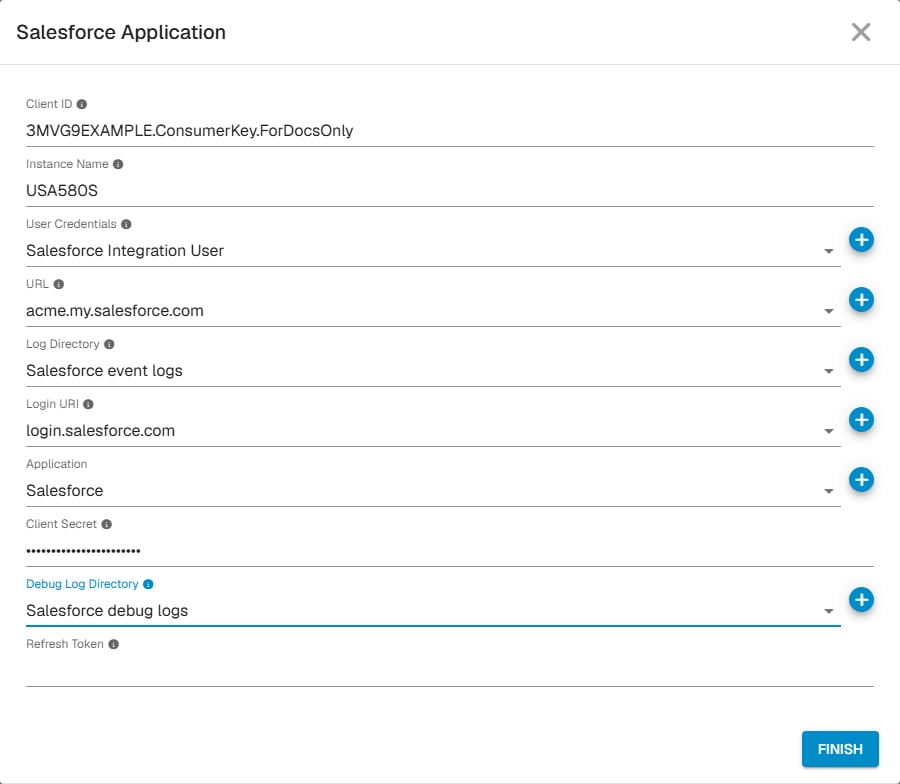
Salesforce.com Application Monitoring Wizard - GermainUX
Use JWT Bearer Login
Do this only for the JWT Bearer login. It changes the five components that log in to Salesforce: Event Log Monitor, Audit Monitor, Stats Monitor, Code Monitor and Debug Log Monitor.Create credentials for the private key
germainux-salesforce.key as the password. The key can be on one line.Change the login request of each component type
GetAccessToken and replace its parameters with these two:Switch each component to JWT
JWT, set Credentials to the credentials from step 1, and add two references:Save
Collection Schedule and API Usage
Each component runs at minute 30 of the hour, every whole number of hours. The intervals are under Advanced in the wizard. At the default intervals, the components make about these Salesforce API requests:Validate
Check the components
Salesforce. All ten components should be listed, enabled, on the Engine you selected.Wait for the first run
Open the Salesforce Logs dashboard
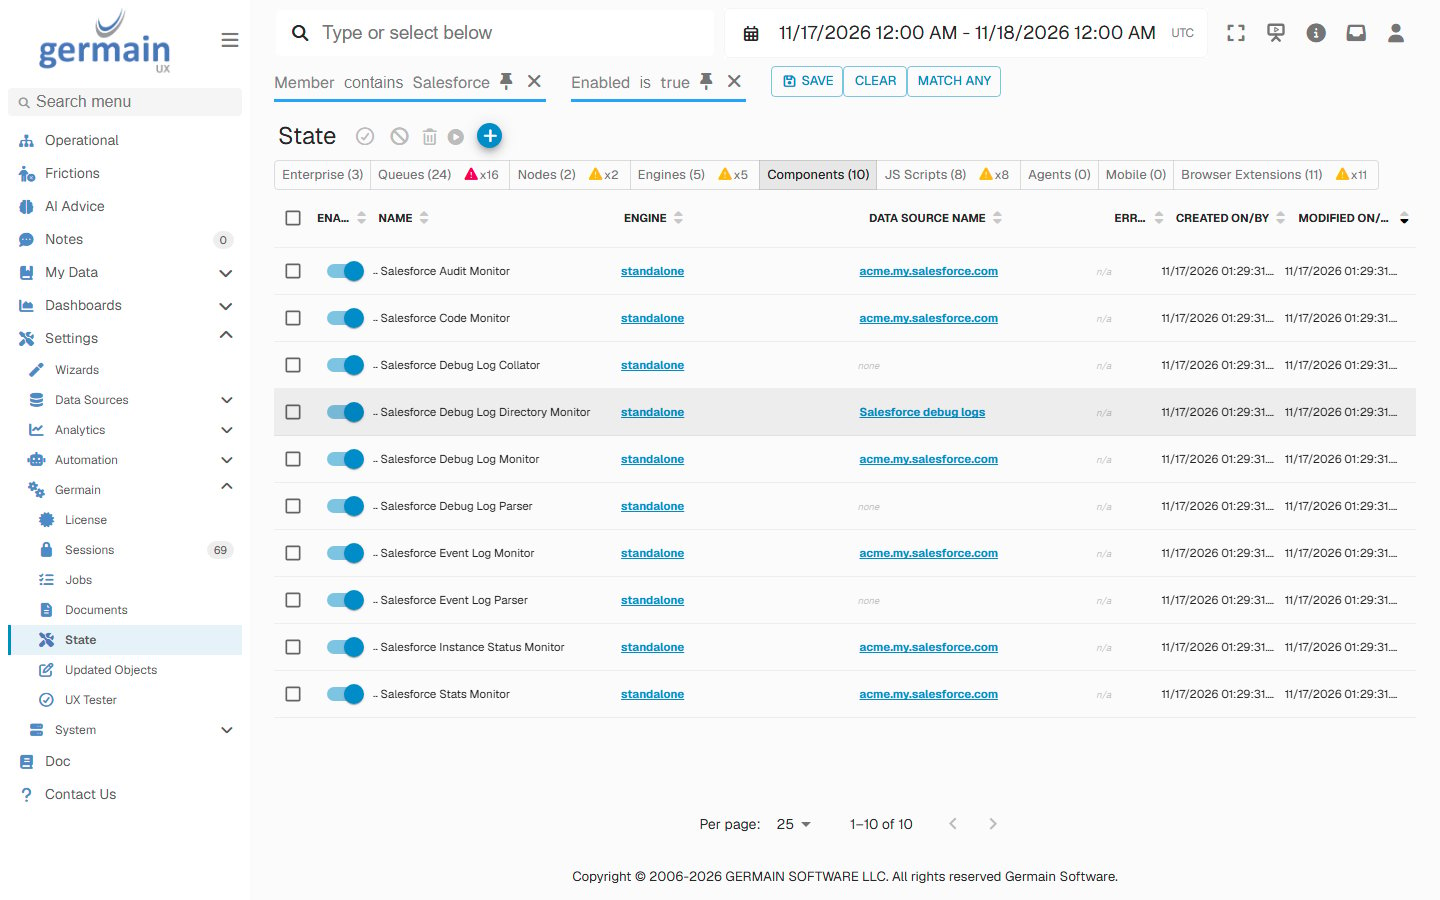
Salesforce Components on the State Screen - GermainUX
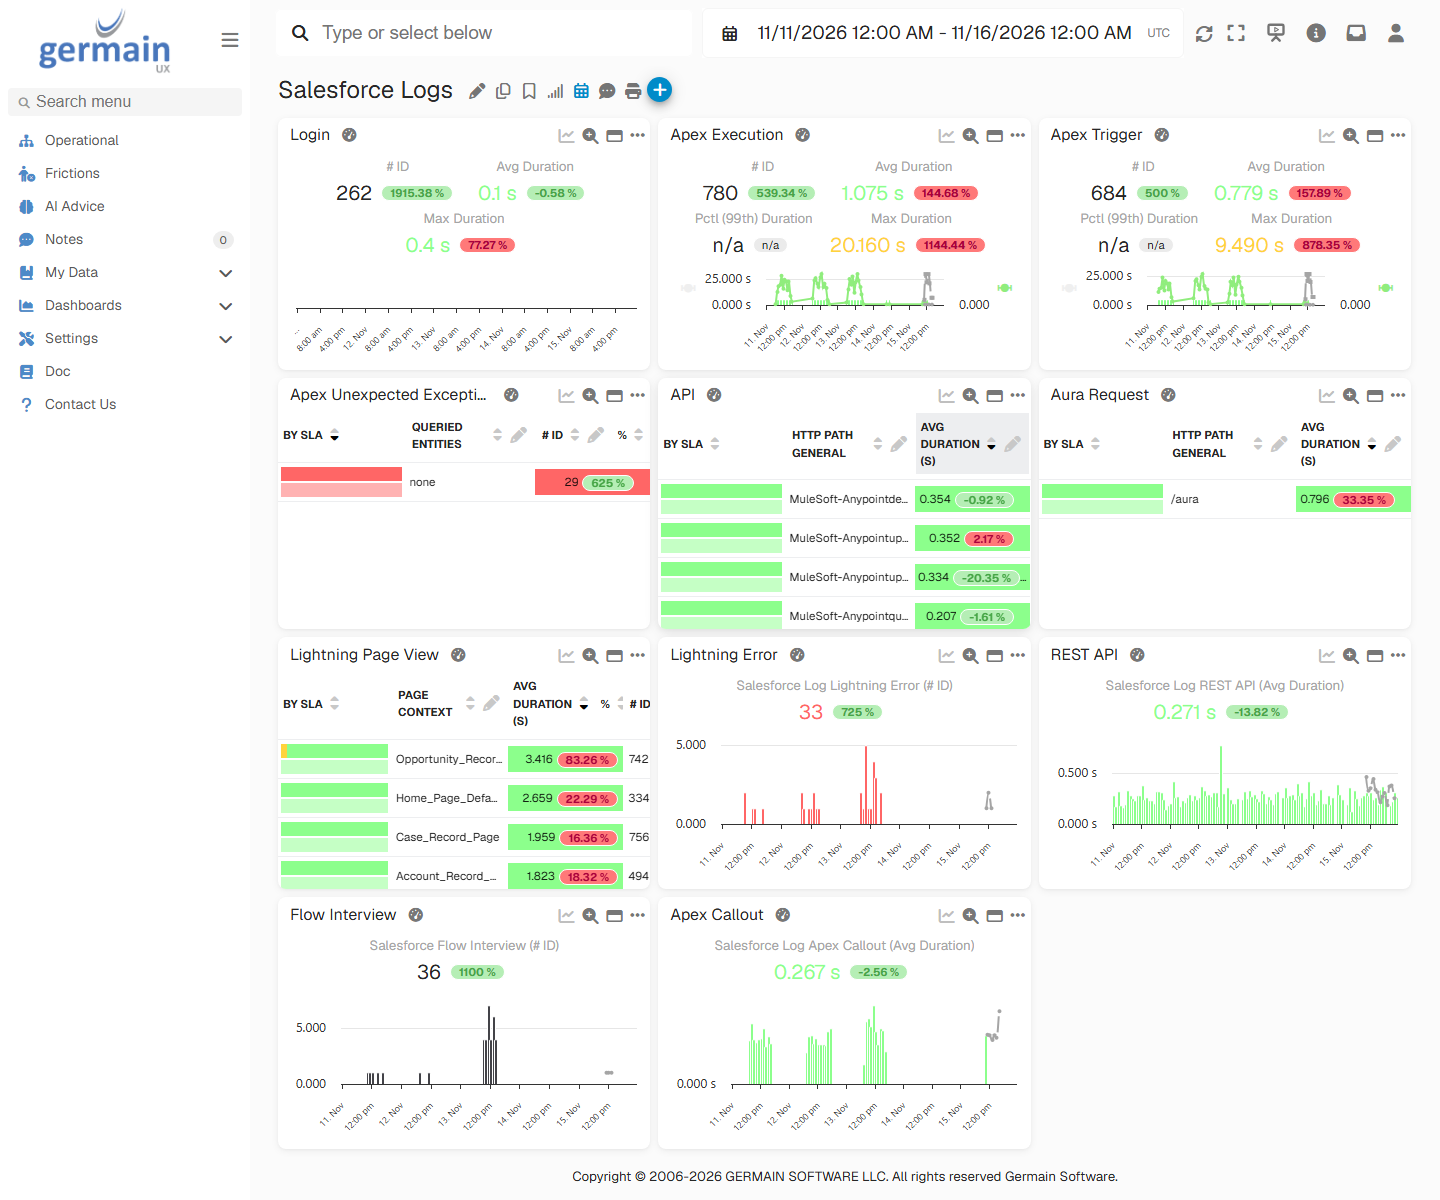
Salesforce Logs Dashboard - GermainUX
Example: A Release Slows Down Apex
In this example, a release changes the Opportunity pricing code in the morning. Open the Analysis Dashboard on Salesforce Log Apex Execution for that day. VS RECENT shows Apex executions take 2.2 seconds on average, against 0.48 seconds at the same hours on the previous days. The Relationships chart shows when: durations stay high from mid-morning, after the release, to mid-afternoon.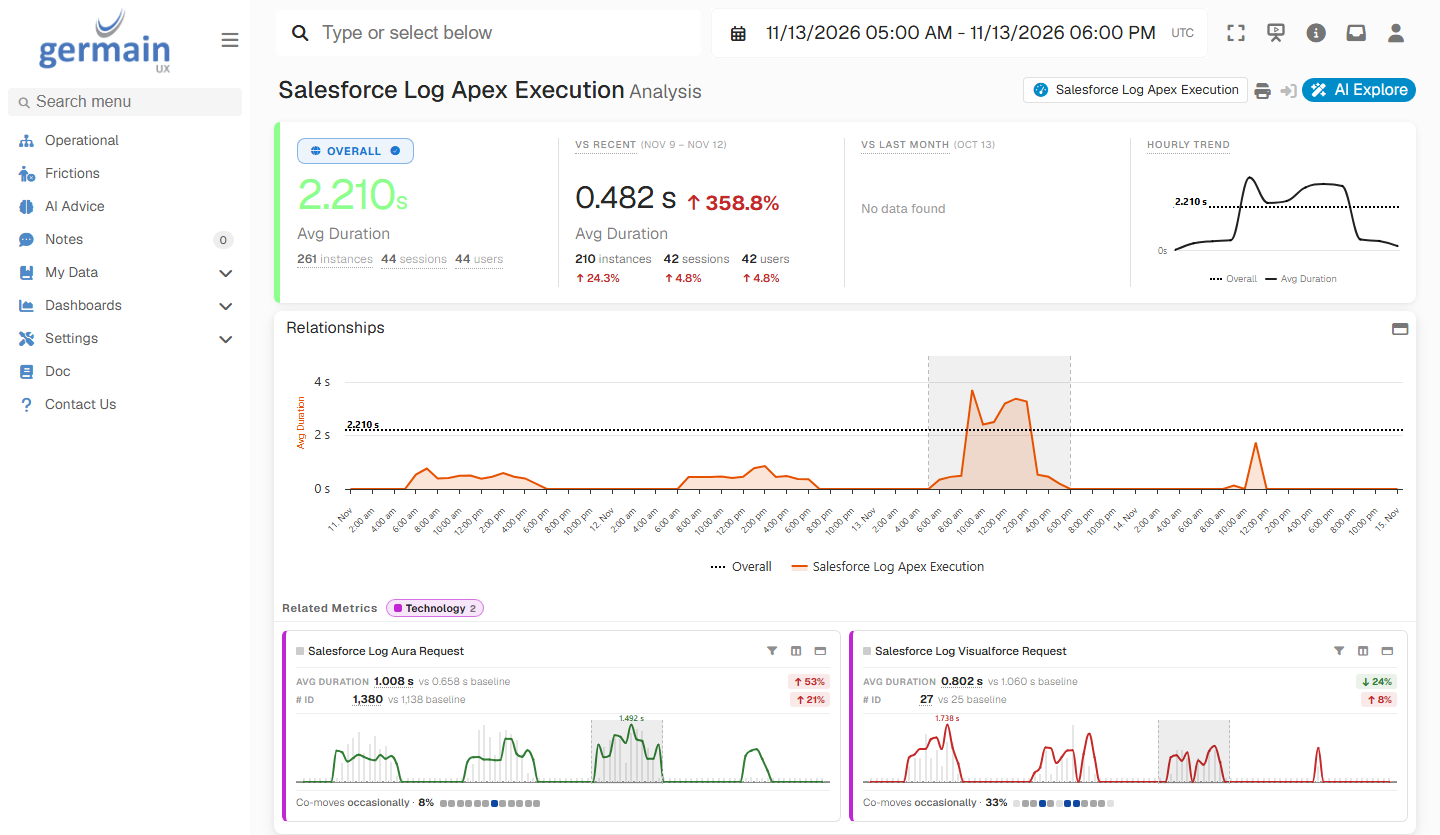
Apex Executions on the Day of a Release - GermainUX
Example: Compare a Slow Save with a Normal One
Once Apex executions arrive, you can put a slow one next to a normal one and see what changed. In this example, a release changes the Opportunity pricing code, and Opportunity saves slow down on the same morning.Pick the slow save
Pick a normal save
Read the differences
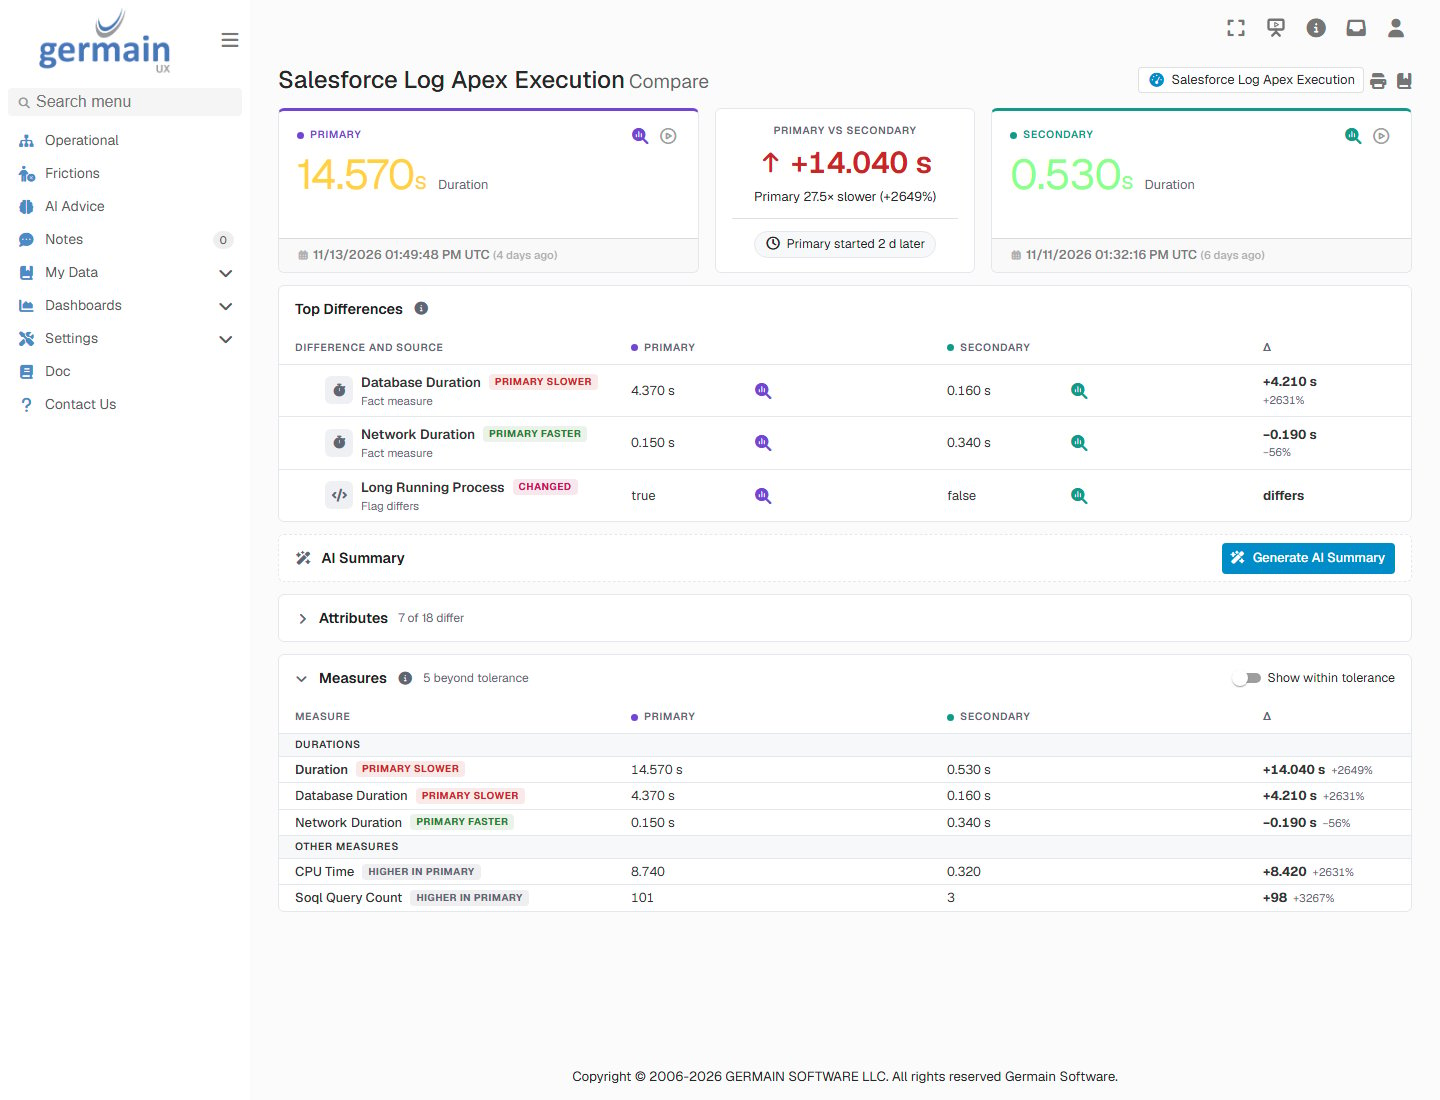
Slow Opportunity Save Compared with a Normal One - GermainUX
Example: Salesforce Is Slow, Not Your Code
In this example, Salesforce reports a minor incident on your instance one afternoon. Open the analysis of Salesforce Log Lightning Page View for that afternoon. Pages take 2.4 seconds on average, against 1.7 seconds on the previous days. Leading Factors list many users and no single page, so no release or page of yours is the cause. To confirm, check Salesforce Instance Status for the same hours.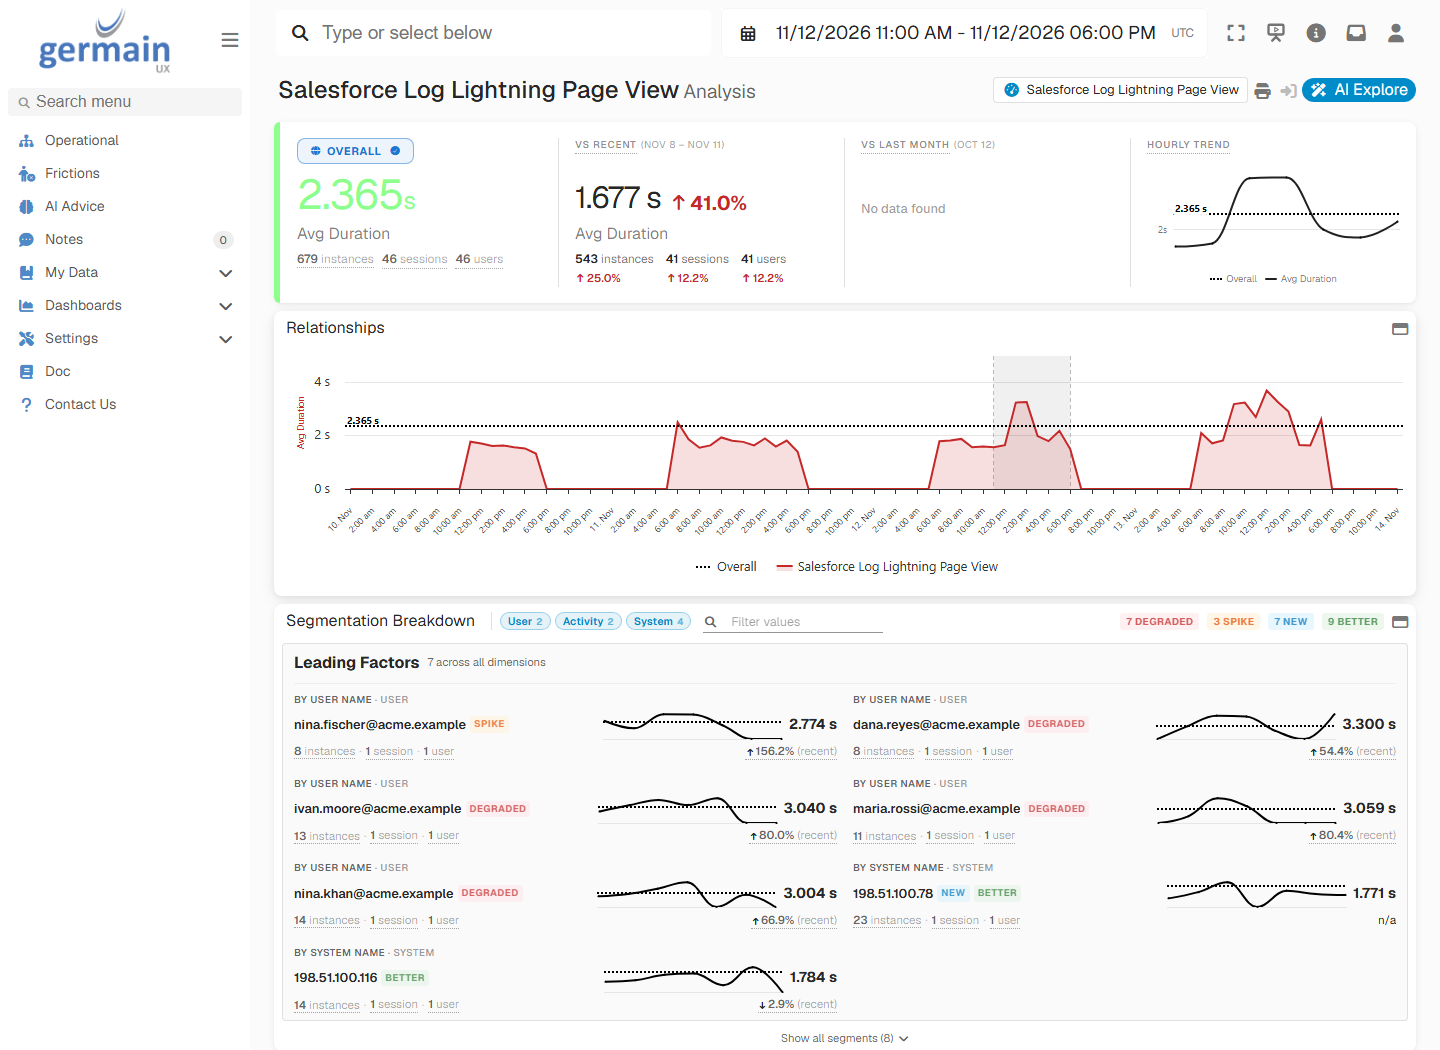
Lightning Page Views During a Salesforce Incident - GermainUX
Example: An Integration Uses Up the API Limit
In this example, the ERP integration re-syncs Opportunities one morning. Open the analysis of Salesforce Log Api with the number of calls as the measure. The morning has 559 API calls, against 122 at the same hours on the previous days. Leading Factors point to the integration’s address and its MuleSoft API calls. Check Salesforce Resource Usage to see how close the org came to its daily API limit.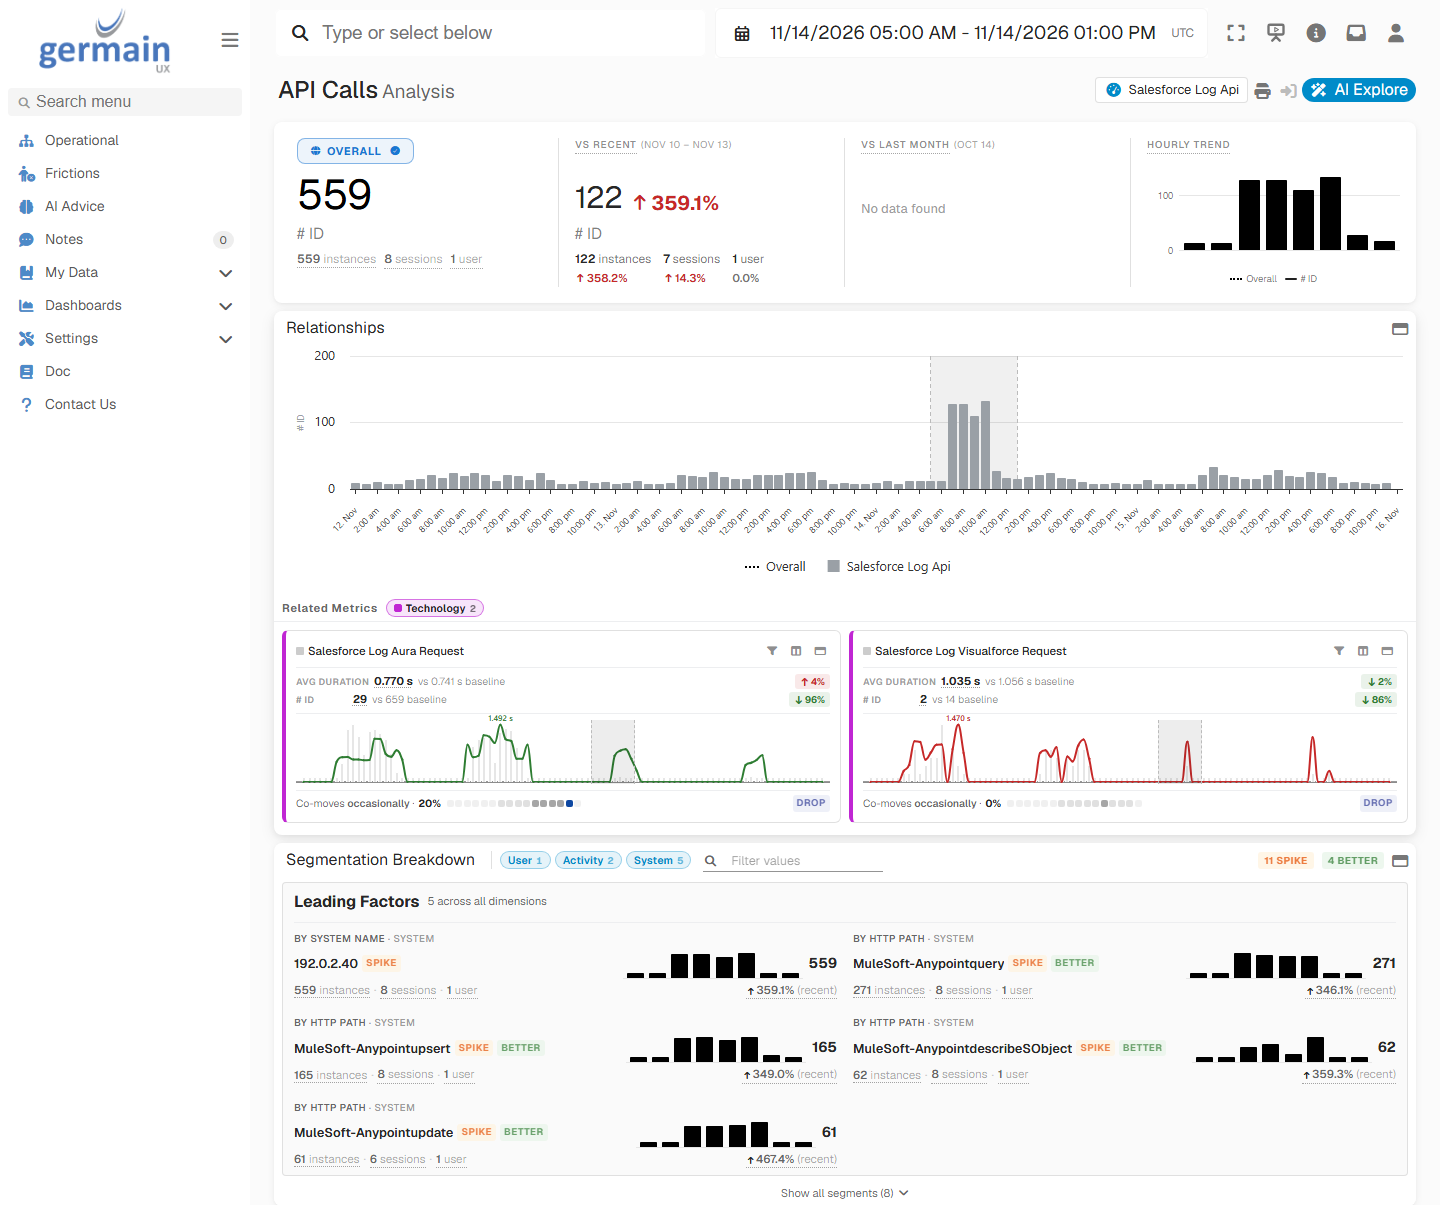
API Calls During an Integration Re-Sync - GermainUX
Troubleshooting
The wizard asks you to assign an engine
The wizard asks you to assign an engine
The Engine log shows invalid_grant
The Engine log shows invalid_grant
- The user name, password and security token in the credentials. A password change also changes the security token.
- The Login URI:
test.salesforce.comfor a sandbox,login.salesforce.comor your My Domain URL for production. - For username and password login: Allow OAuth Username-Password Flows is on, and the org isn’t one that blocks the flow.
- The integration user is pre-authorized for the app, and the app is the one whose consumer key you entered.
- For JWT bearer login: the certificate in the app matches the private key, the user name in the credentials is the integration user, and the Engine’s clock is correct.
No Event Monitoring data
No Event Monitoring data
- The org has the Event Monitoring add-on, and the integration user has View Event Log Files.
- Enough time has passed. Salesforce publishes hourly files with a delay, so data arrives two to three hours after the activity.
- The Log Directory exists on the Engine host and the Engine can write to it, and the disk isn’t full.
Gaps in Event Monitoring data
Gaps in Event Monitoring data
No debug logs
No debug logs
No instance status
No instance status
api.status.salesforce.com.User names are missing from Event Monitoring data
User names are missing from Event Monitoring data
Next Steps
Configure Monitoring for Salesforce
Salesforce KPIs
Get Help
Contact GermainUX Support
Can't Find What You Need?
The content of this document is proprietary to GERMAIN SOFTWARE.