

GermainUX provides real-time Observability, Code Profiling, Transaction Monitoring, Analytics, Alerting, and Automation for PHP applications.
Visibility Scope
What PHP monitoring covers
Network Request Monitoring
Downstream service dependencies
KPIs & Analytics
PHP metrics and reports
Deployment
Agent, profiler and engine
Supported Platforms and Correlation
Monitor PHP 7.4 and later applications and correlate browser activity with PHP code execution, network requests, database SQL, and external integrations.Visibility Scope
Browser-Level Events
Correlate browser-level activity with PHP application processing. GermainUX captures and analyzes browser events to help understand how user interactions relate to the PHP code executed in response. This provides visibility across:User ActionBrowserPHP Transaction
and helps connect user experience with server-side application behavior.
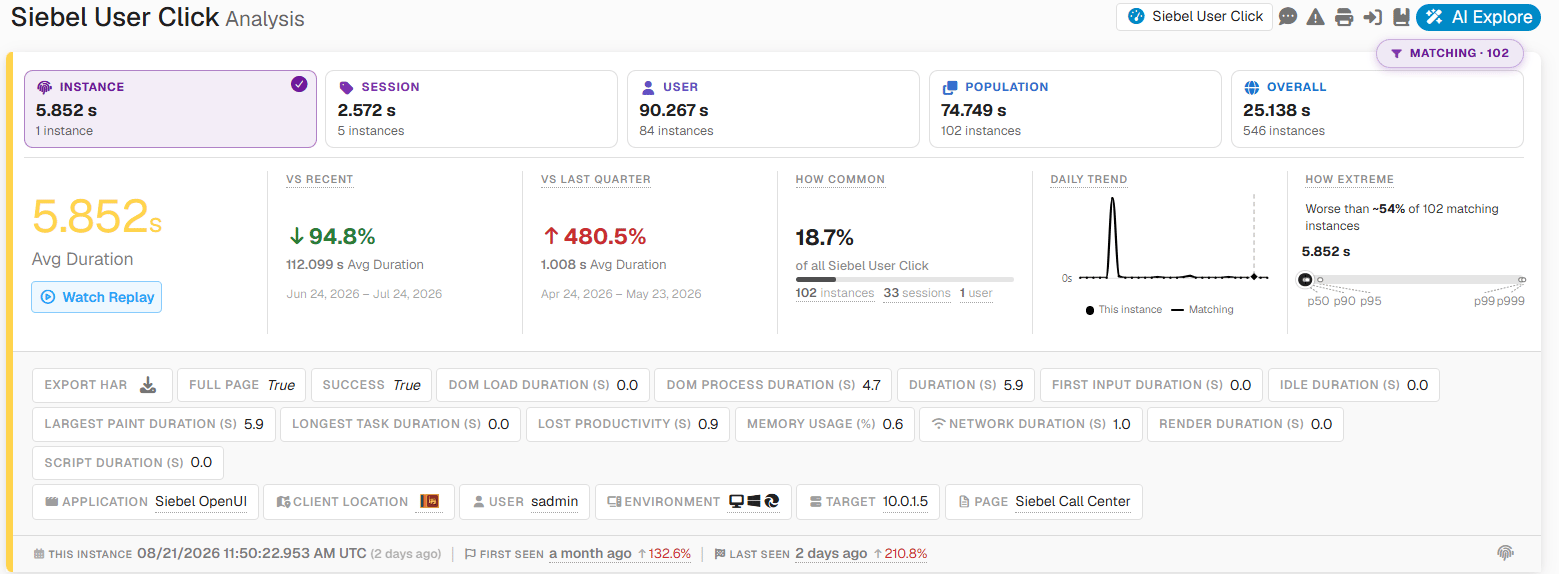
Slow User Click Instance Analysis (example) - GermainUX
PHP Code Execution
Monitor PHP code execution to understand the performance and behavior of application code. GermainUX provides visibility into individual code segments to help identify:- Slow execution
- Performance bottlenecks
- Inefficient code
- Errors
- Unexpected application behavior
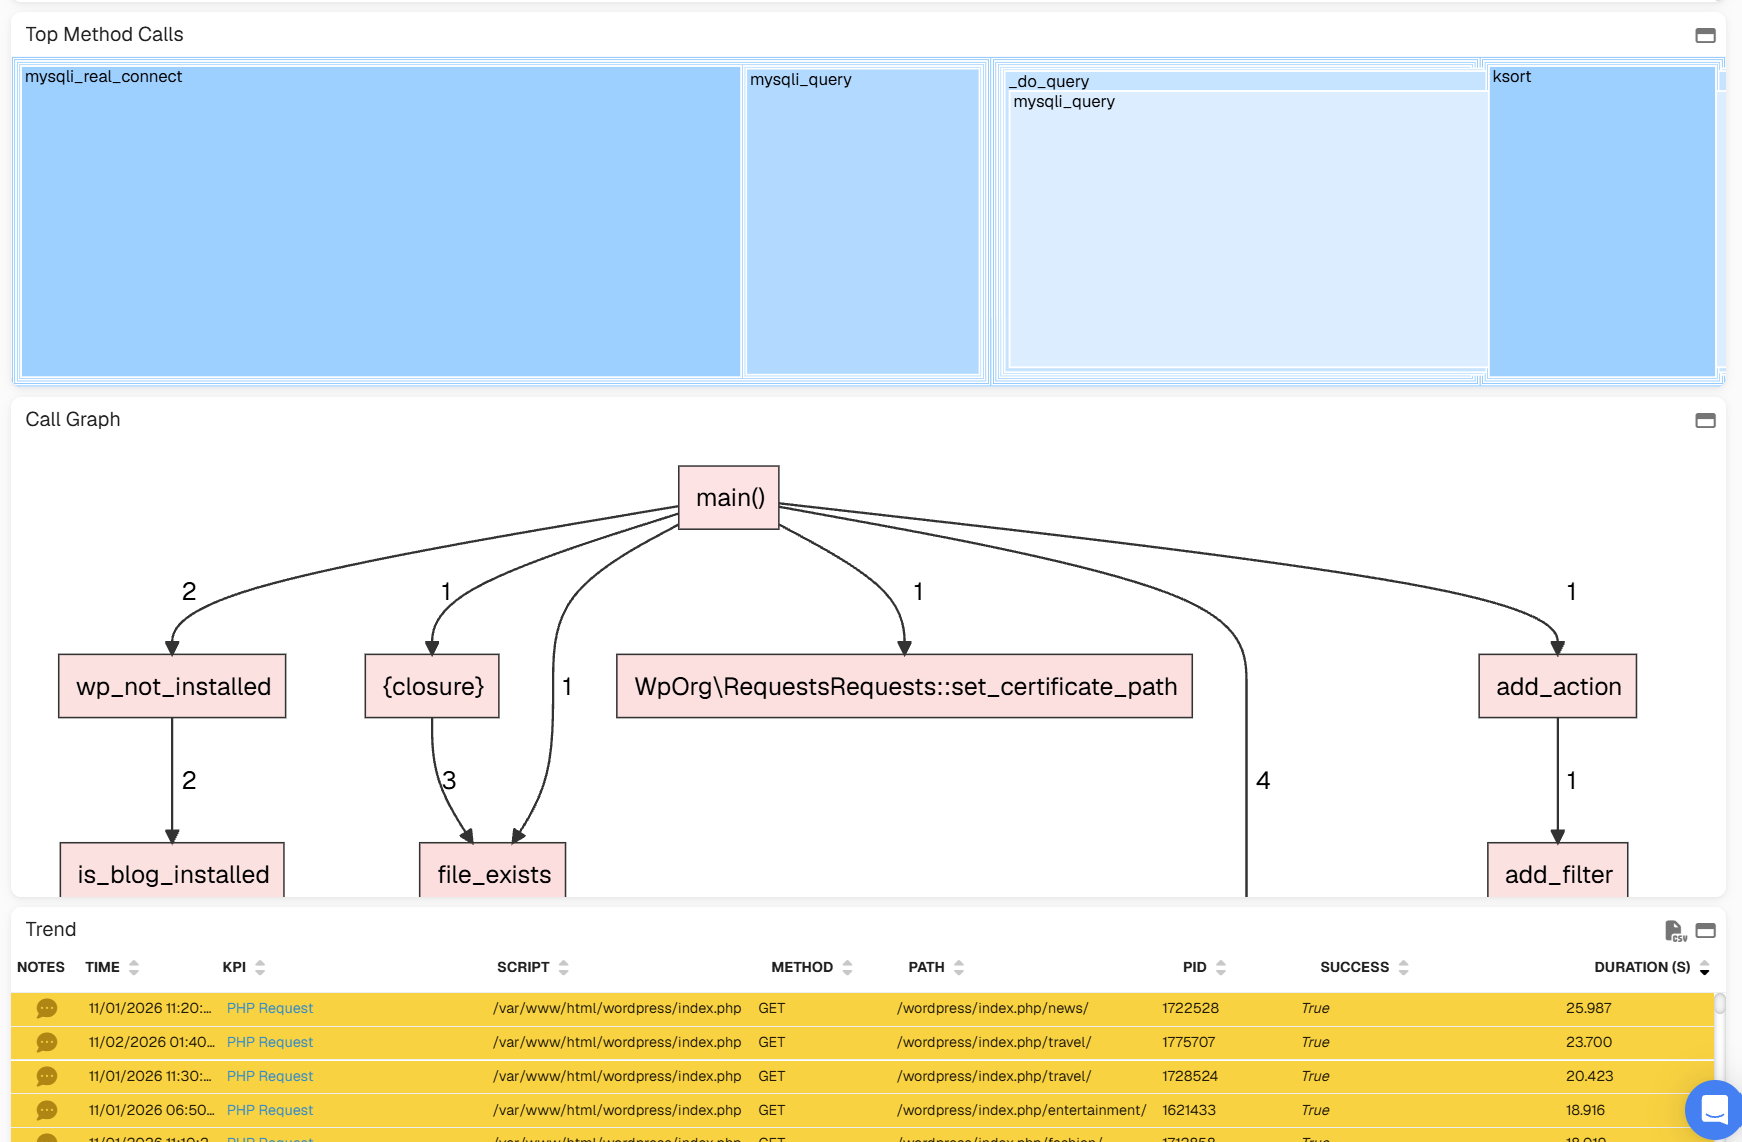
PHP Code Profiling - GermainUX
PHP Transaction Monitoring
Monitor PHP transactions in real time. Transaction monitoring provides visibility into the execution of application operations and their related:- PHP code
- Network requests
- SQL
- External integrations
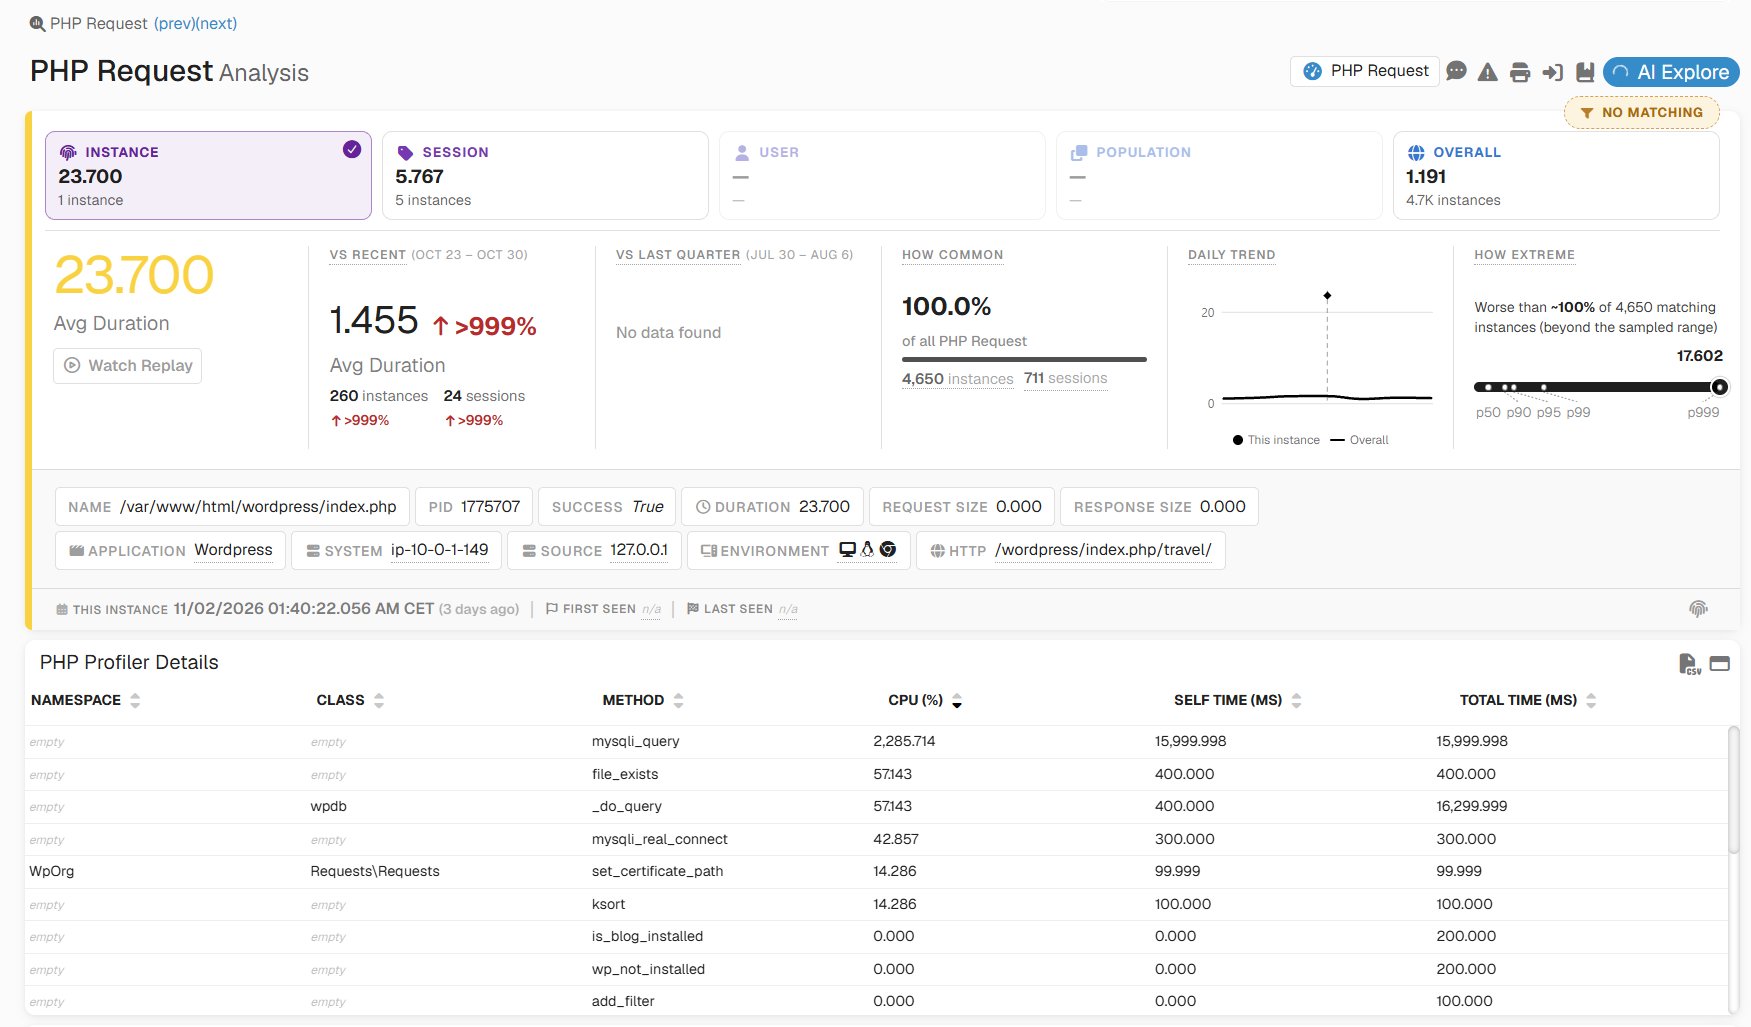
PHP Transaction Detailed Analysis - GermainUX
Network Request Monitoring
Monitor network requests initiated by PHP applications. GermainUX tracks interactions such as:- HTTP requests
- API calls
- External service requests
- Response time
- Latency
- Request performance
- Related PHP transaction
Database SQL Monitoring
Monitor SQL executed within PHP applications. GermainUX captures database interactions associated with PHP transactions to help identify:- Slow SQL
- Database response time
- Database-related performance degradation
- SQL contributing to slow PHP transactions
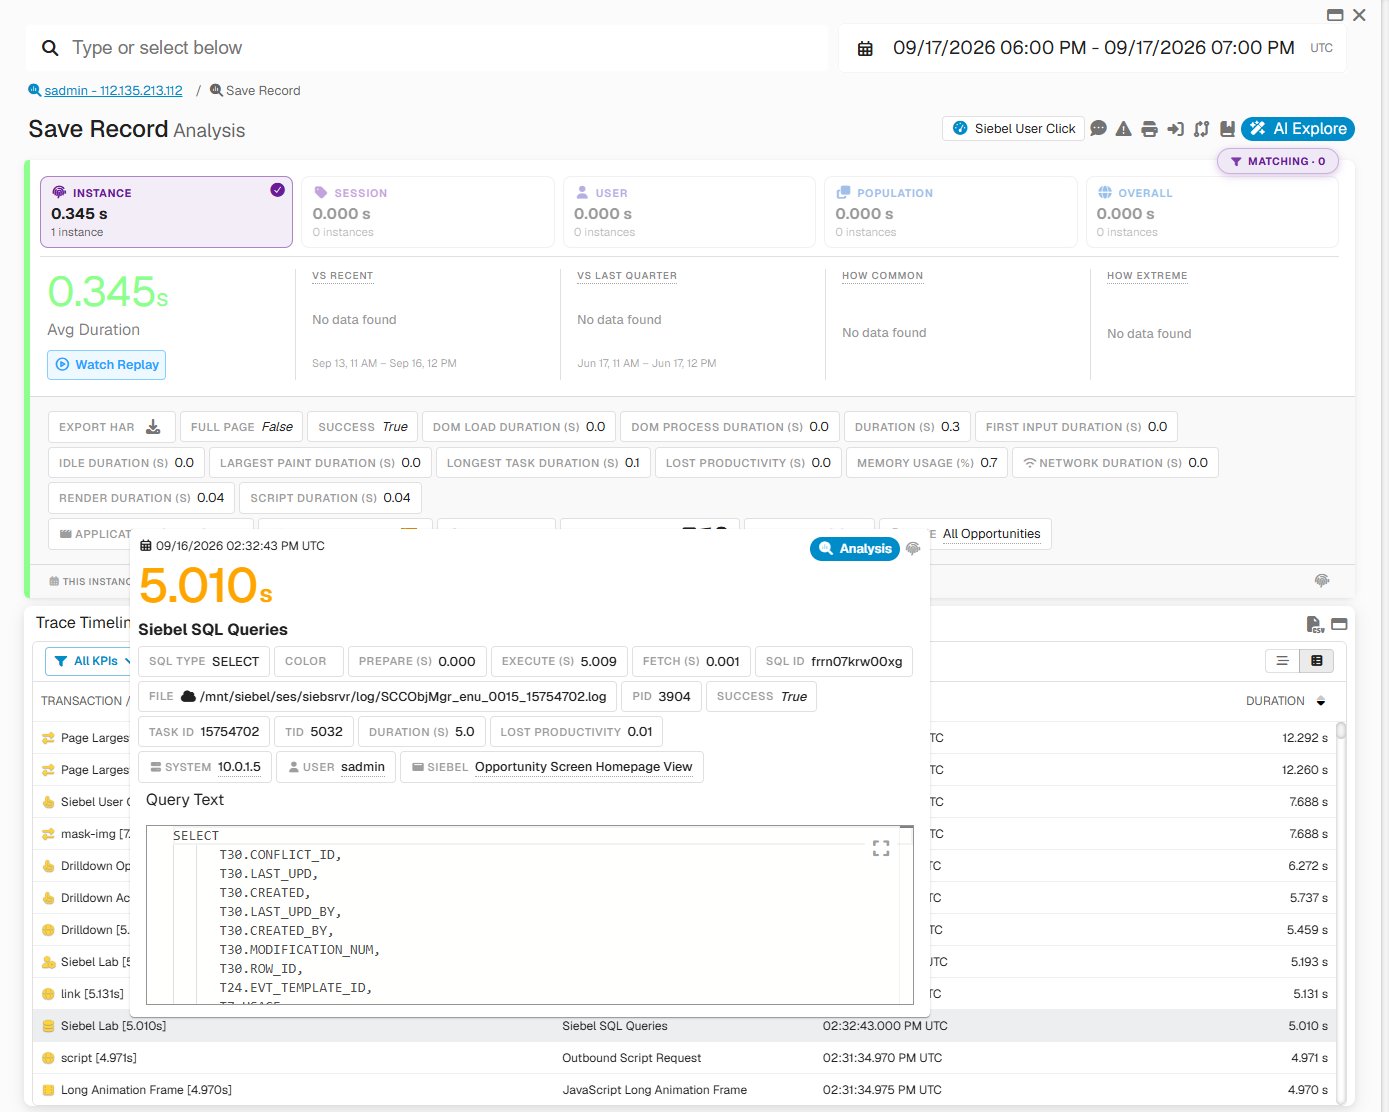
Slow SQL Statement (example) - GermainUX
Integration Transaction Monitoring
Monitor external services and integrations used by PHP applications. Examples include:- Third-party APIs
- External services
- Message queues
- Other system integrations
Root Cause & Transaction Tracing
Correlate activity across the PHP transaction. For example:User ActionPHP TransactionPHP CodeSQL QueryDatabase
or:
User ActionPHP TransactionHTTP RequestExternal API
This helps teams move from an application symptom toward the code, database, network request, or external integration contributing to it.
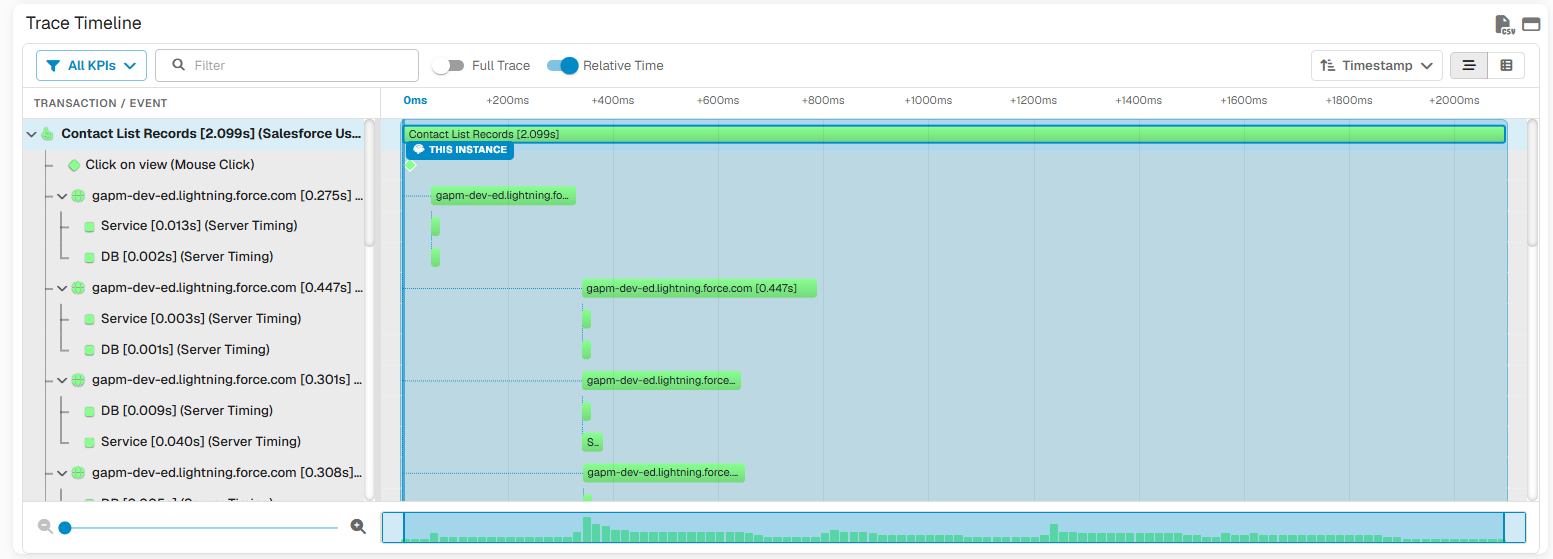
Trace Timeline (example) - GermainUX
Transaction Performance Comparison
When analyzing a slow or failed PHP application transaction, use Comparison to compare its performance with another execution of the same transaction, such as the fastest, slowest, most recent, first seen, or last seen. Comparison can reveal:- Differences in execution time for the same PHP operation
- Which steps, code segments, or database queries caused the slowdown
- Performance differences between successful and failed PHP transactions
- Errors or bottlenecks affecting PHP workflows
- Potential root causes of transaction performance degradation
Detect Performance Issues
GermainUX can help identify conditions such as:- Slow PHP transactions
- Slow PHP code
- Slow HTTP/API calls
- Slow SQL
- External-service degradation
- Integration-related performance issues
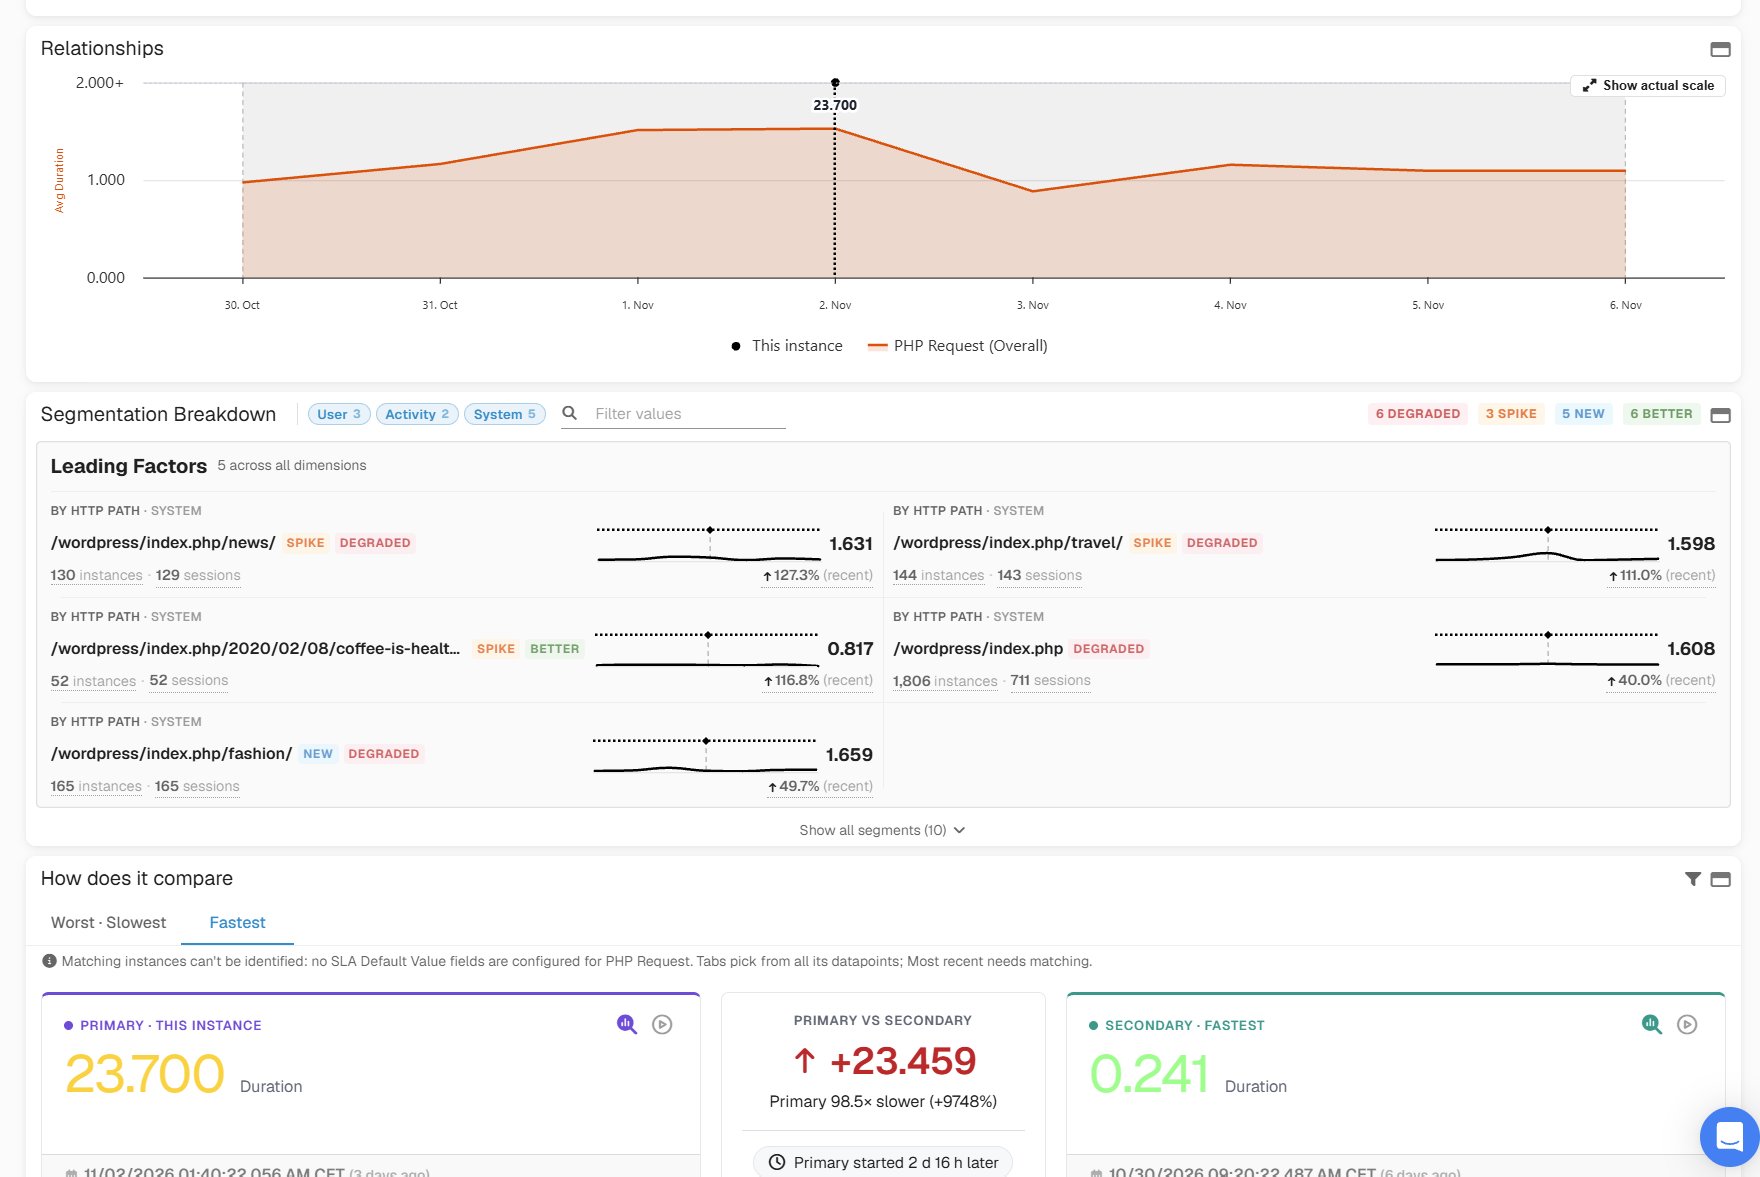
Relationship, Segmentation and Comparison - GermainUX
KPIs & Analytics
Configure KPIs for the PHP conditions important to the application. Examples include: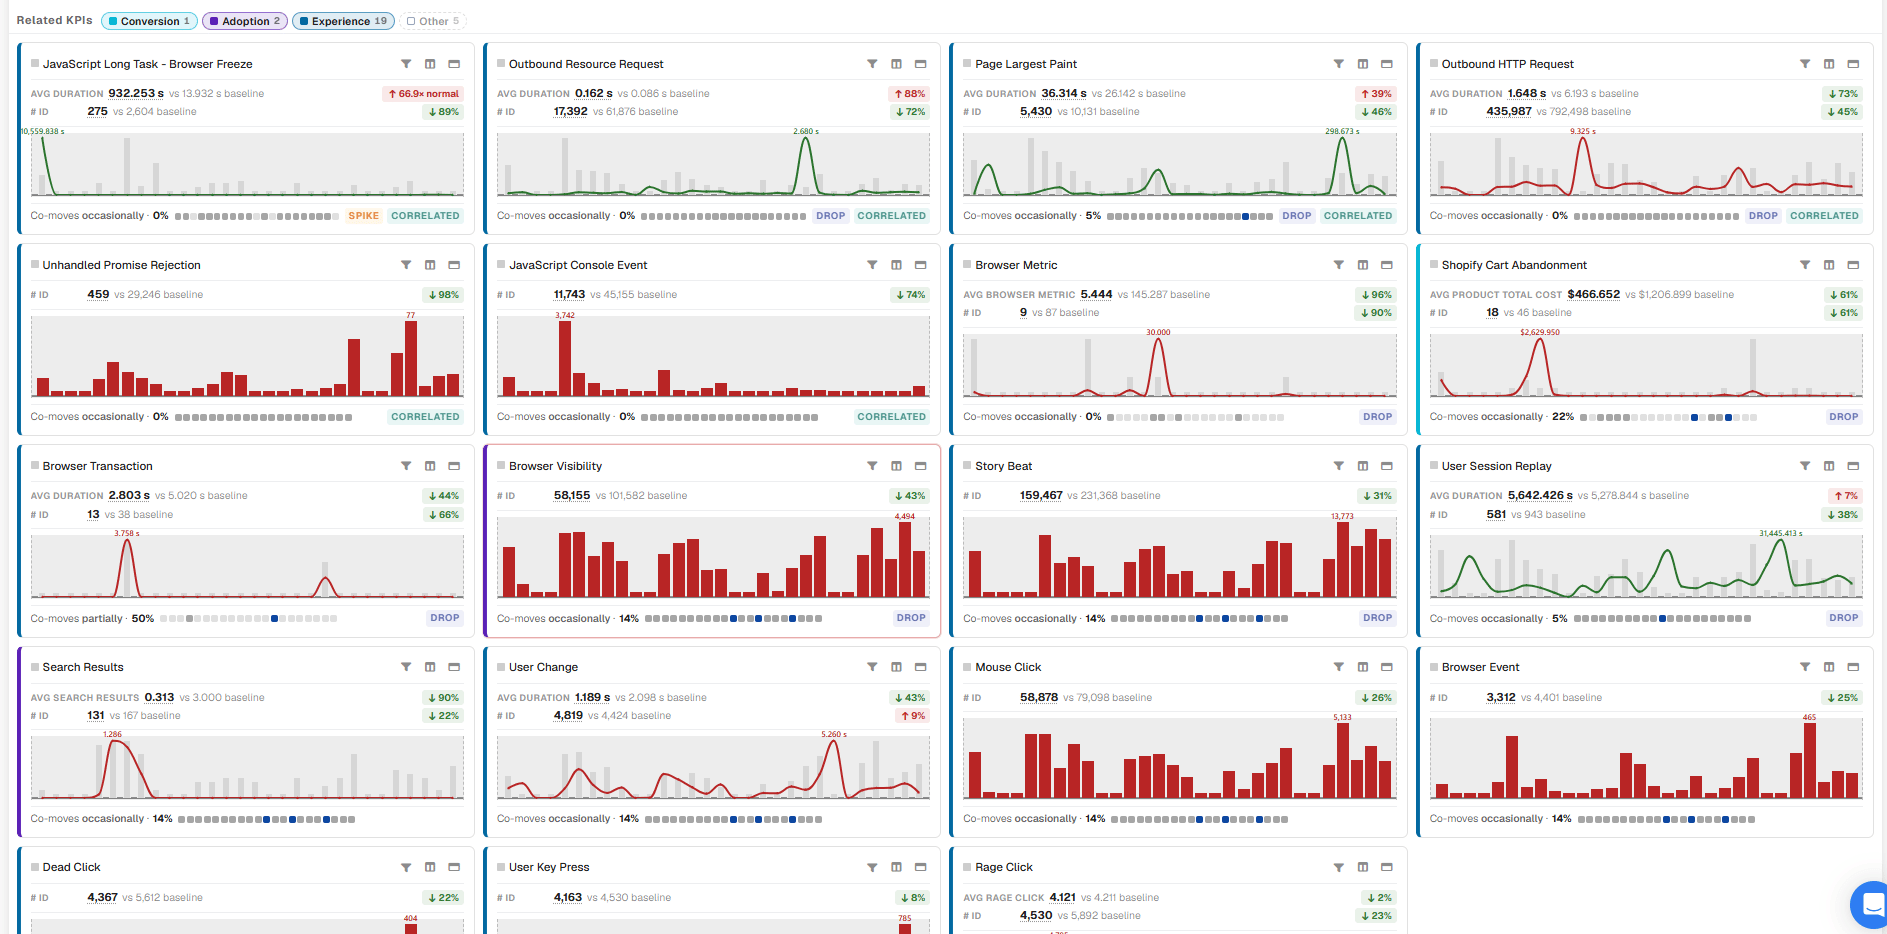
Related KPIs (example) - GermainUX
Real-Time Dashboards & Automated Reports
- PHP transaction duration
- PHP code execution time
- Network-request duration
- SQL execution time
- Integration transaction duration
Real-Time Dashboards & Automated Reports
Create dashboards and automated reports for PHP monitoring. Examples include:- PHP transaction performance
- PHP code performance
- Network requests
- SQL performance
- Integration performance
- Application trends
- SLA status
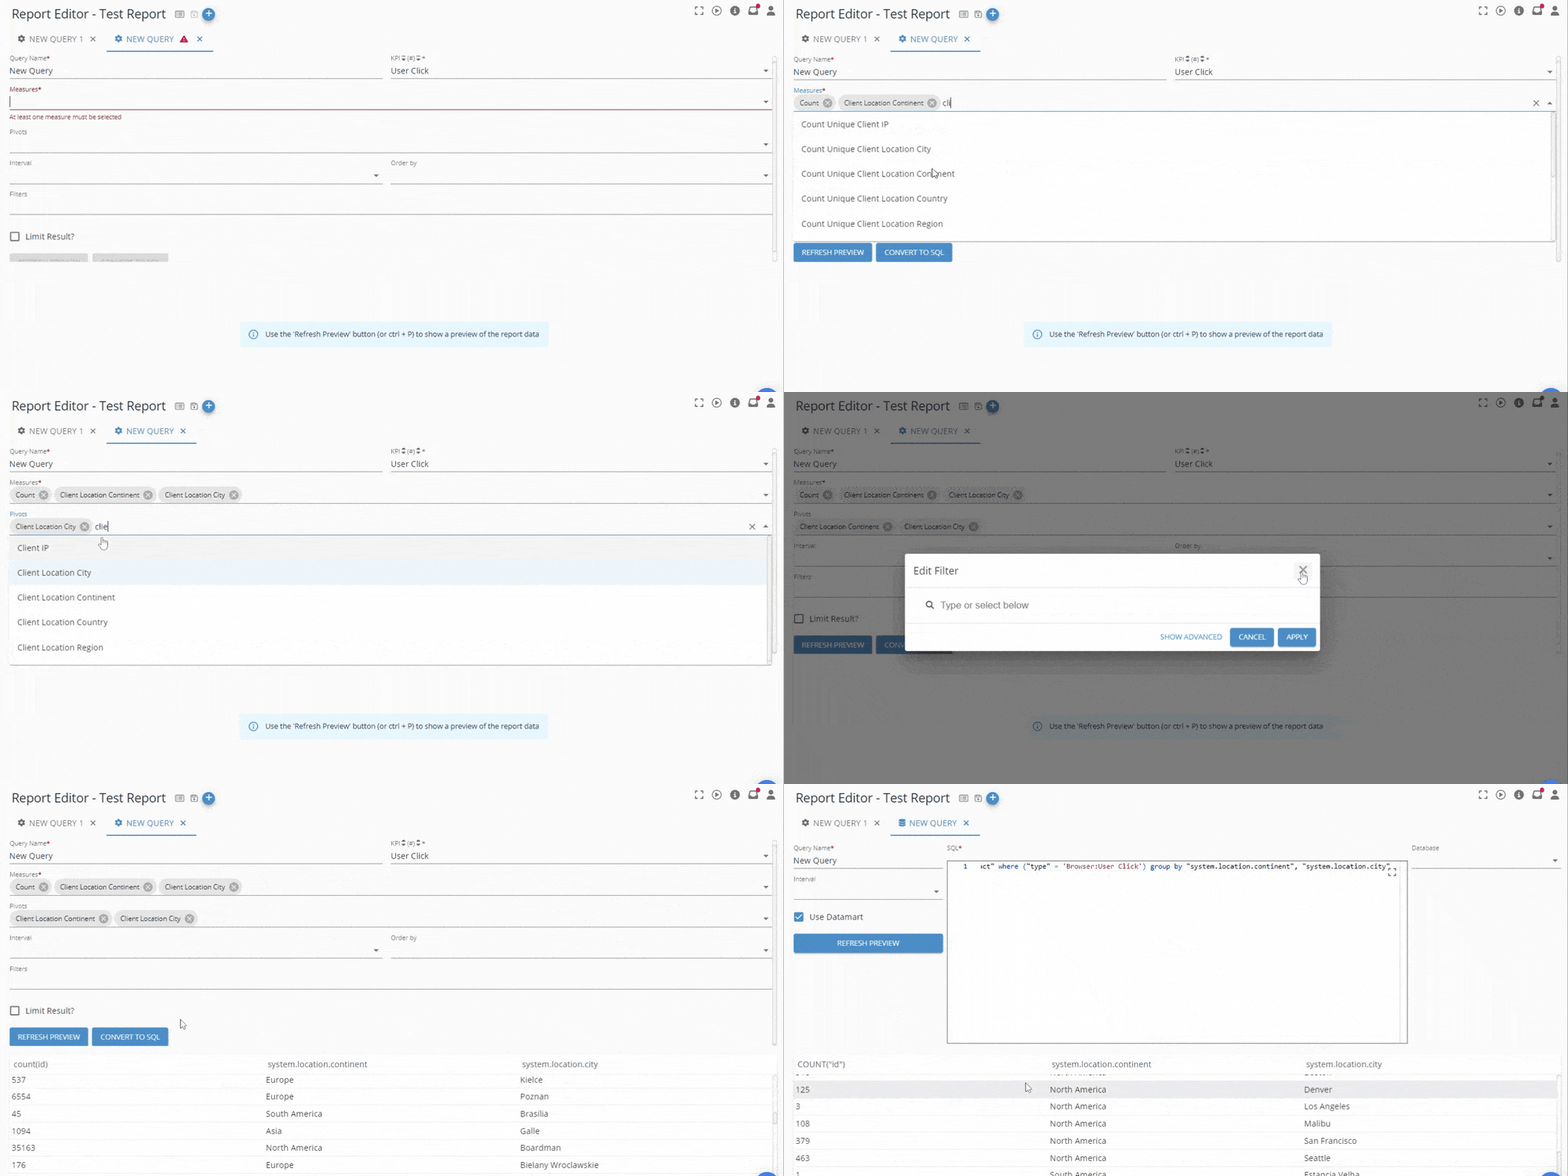
Report Editor to quickly enable a report - GermainUX
Alerts & SLA Monitoring
- PHP transaction performance
- PHP code performance
- Network requests
- SQL performance
- Integration performance
- Application trends
- SLA status
Alerts & SLA Monitoring
Configure SLAs and alerts for PHP conditions requiring attention. For example:- PHP transaction exceeds threshold
- Code execution exceeds threshold
- HTTP request exceeds threshold
- SQL execution exceeds threshold
- Integration performance degrades
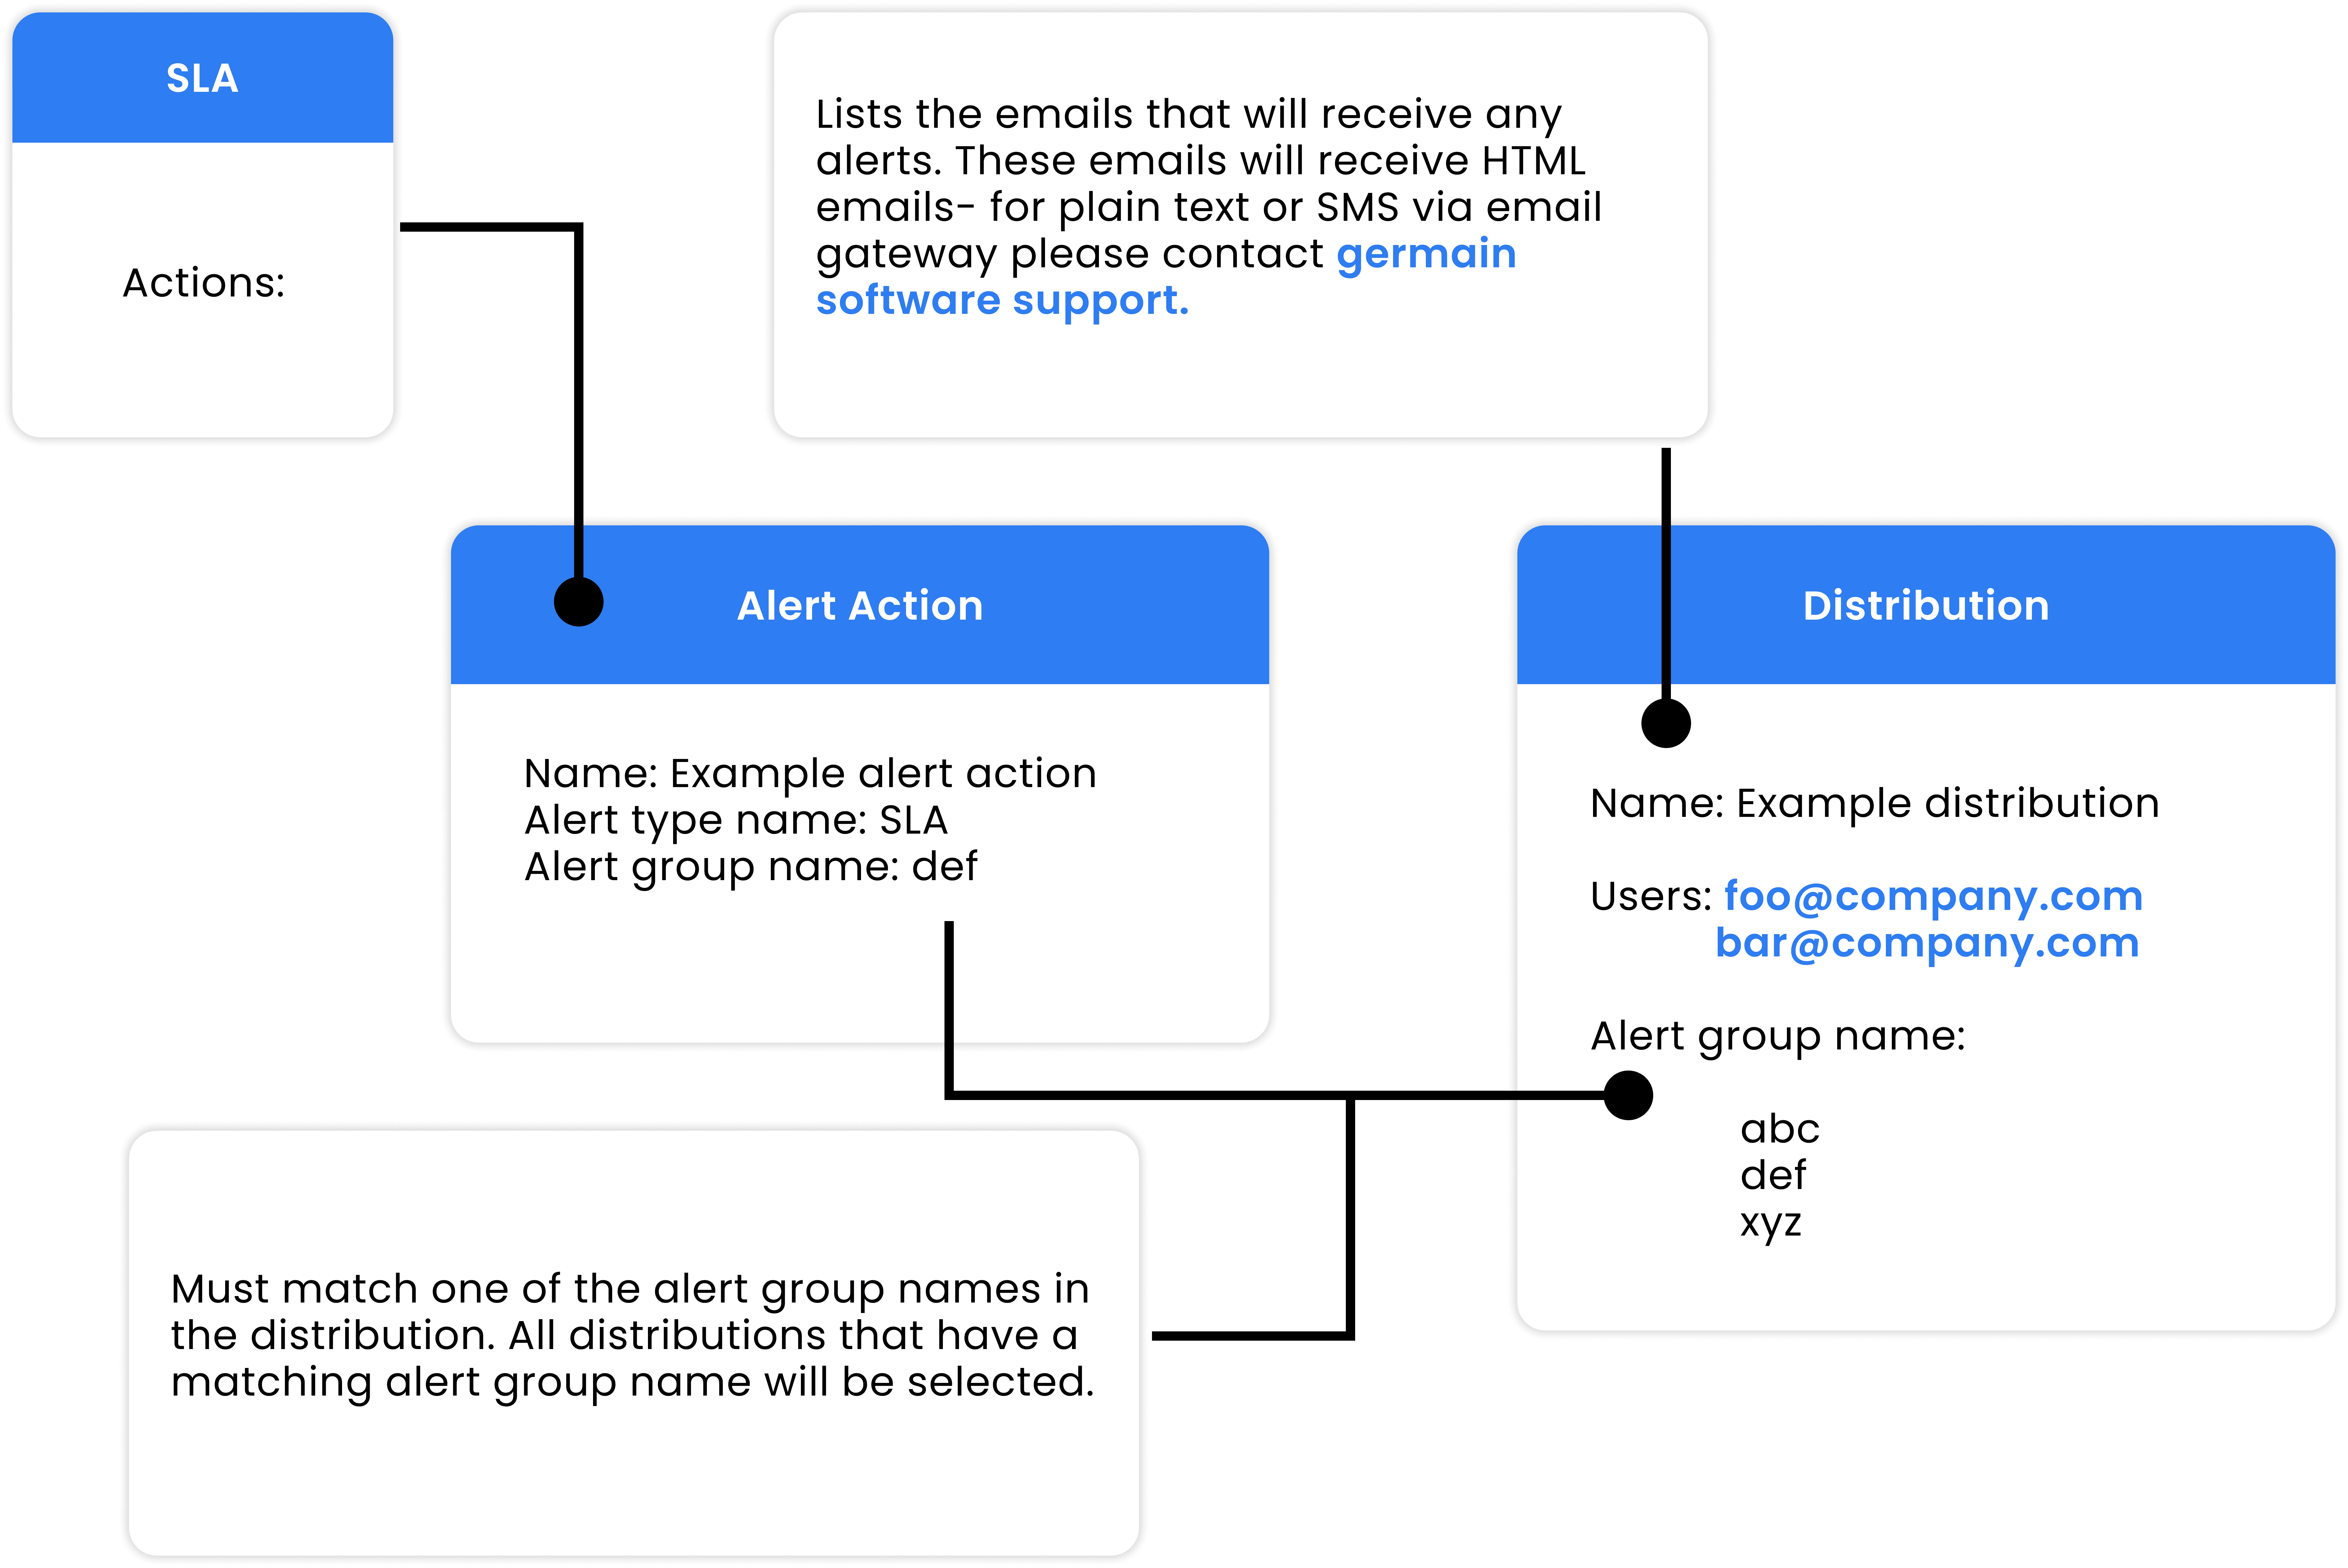
How Alerting Works - GermainUX
Automation
- PHP transaction exceeds threshold
- Code execution exceeds threshold
- HTTP request exceeds threshold
- SQL execution exceeds threshold
- Integration performance degrades
Automation
PHP monitoring conditions can trigger GermainUX automation. For example:MonitorDetectAnalyzeAlertAutomate
Depending on the use case, automation can include:
- Notifications
- Reports
- Scripts
- Operational workflows
- Remediation actions where appropriate
End-to-End Observability
Depending on the use case, automation can include:- Notifications
- Reports
- Scripts
- Operational workflows
- Remediation actions where appropriate
End-to-End Observability
Combine PHP monitoring with other GermainUX integrations to provide broader application visibility. For example:UserBrowserPHPAPI / ServiceDatabaseInfrastructure
This helps teams understand both application impact and the technical conditions contributing to it.
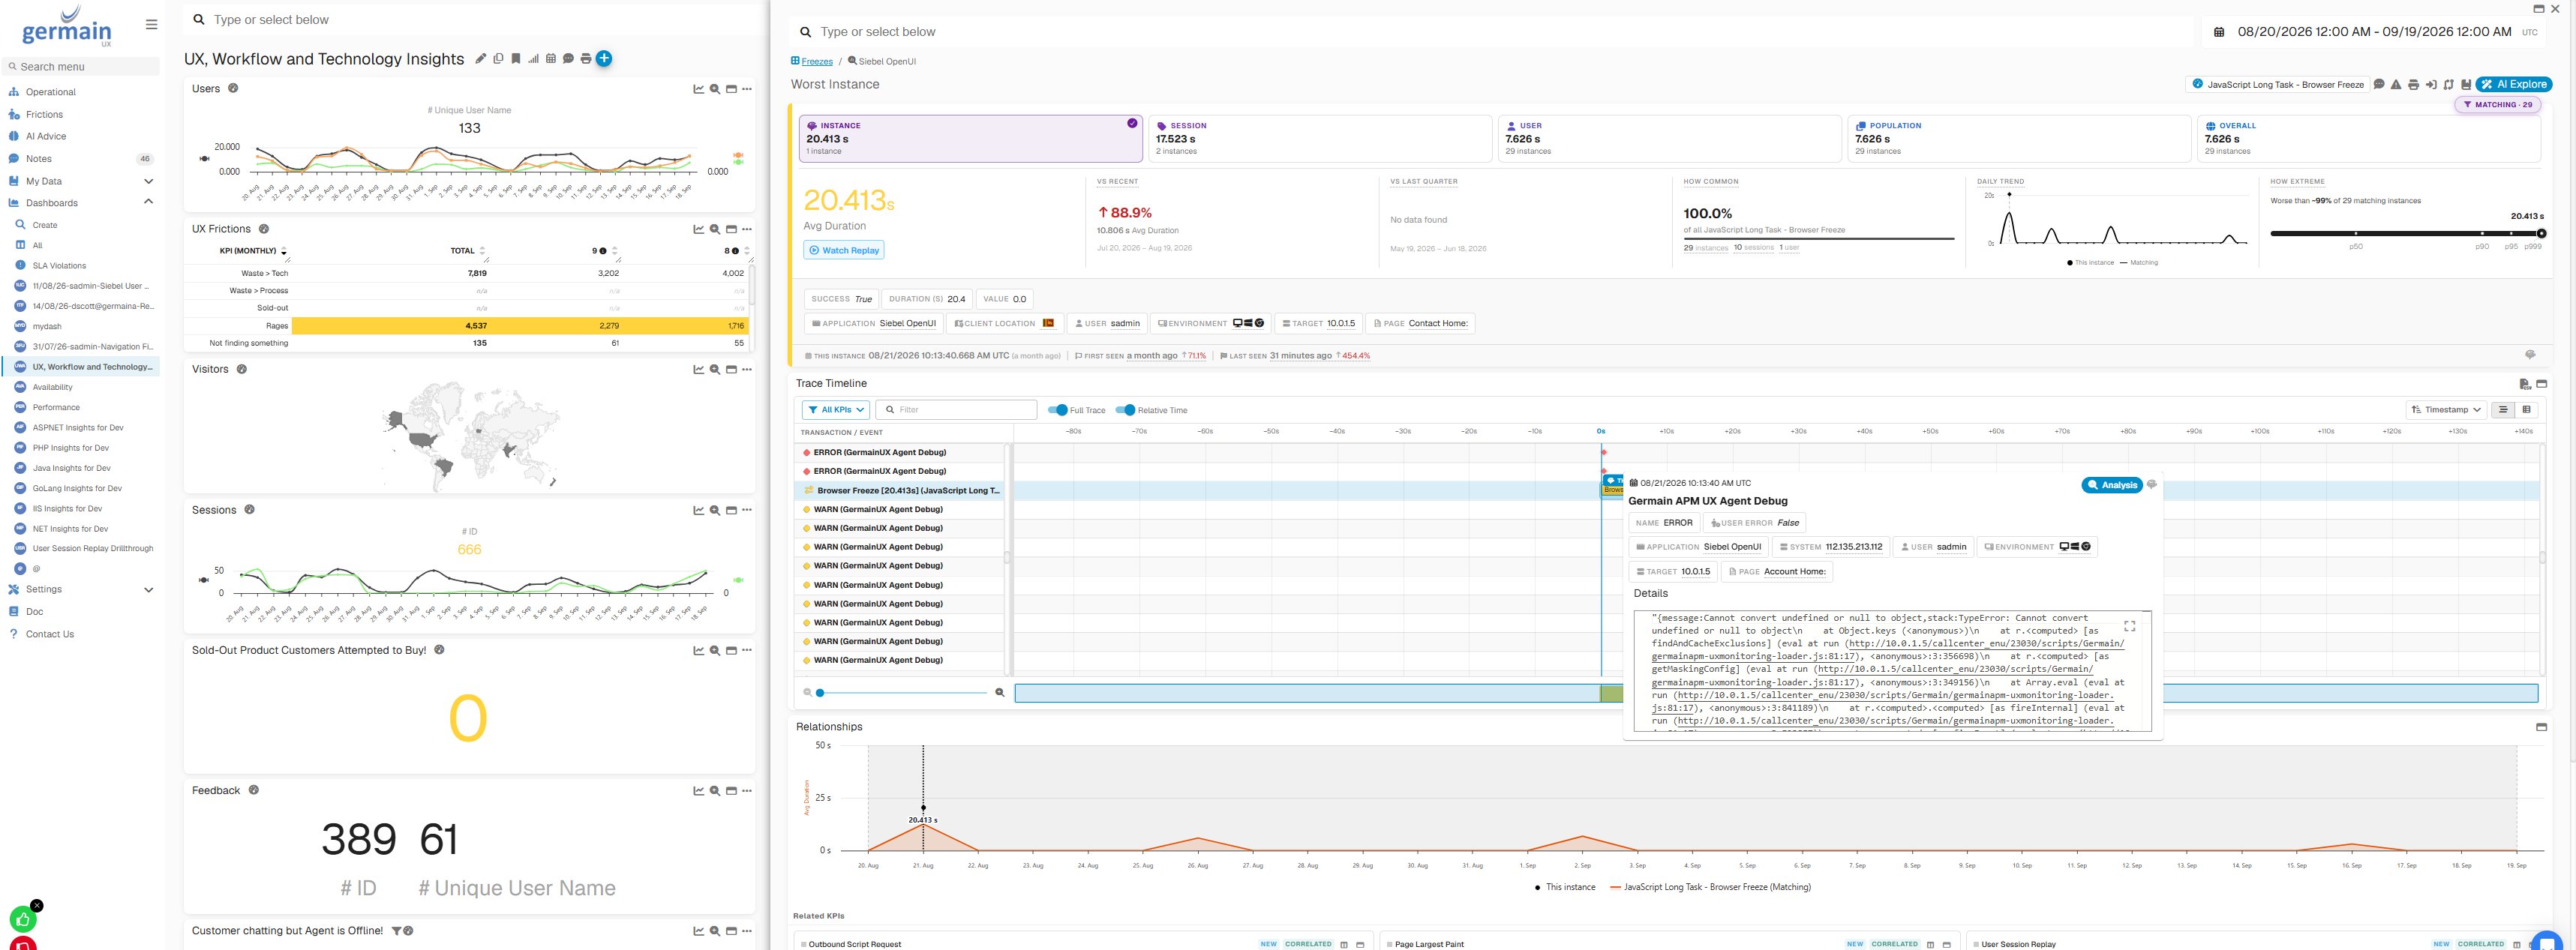
End-to-End Correlation across PhP App layers (example) - GermainUX
Deployment
UserBrowserPHPAPI / ServiceDatabaseInfrastructure
Deployment
PHP monitoring uses the GermainUX PHP Agent, Code Profiler, and Engine. Deployment includes:- xhprof
- GermainUX Engine
germainapm.php- PHP monitoring profile
- Application instrumentation
Get More Information
- xhprof
- GermainUX Engine
germainapm.php- PHP monitoring profile
- Application instrumentation
Get More Information
The GermainUX team can help configure the appropriate monitoring scope, privacy controls, analytics, alerts, and automation for your PHP environmentHP environments can vary significantly depending on storefront customization, extensions, integrations, infrastructure, and security requirements. Please contact us for any help.Get Help
Contact GermainUX Support
The GermainUX team helps you get up and running faster, empower your team, turn data into actionable insights, and optimize performance to deliver measurable business outcomes.
Can't Find What You Need?
Search all GermainUX docs with Ctrl + K, or use the feedback buttons at the bottom of this page to tell us what is missing.
Get Help
Contact GermainUX Support
The GermainUX team helps you get up and running faster, empower your team, turn data into actionable insights, and optimize performance to deliver measurable business outcomes.
Can't Find What You Need?
Search all GermainUX docs with Ctrl + K, or use the feedback buttons at the bottom of this page to tell us what is missing.
The content of this document is proprietary to GERMAIN SOFTWARE.