GermainUX shows you which errors your Mule runtimes raise, in which application and flow, for the runtimes you host yourself. Each ERROR, FATAL and WARN entry in mule_ee.log and the application logs becomes a log event with its Mule error type, such as HTTP:CONNECTIVITY, its flow, application and correlation ID, and the full error block. Next to it, GermainUX tracks the runtime’s JVM: heap, CPU, threads and garbage collection. An error-spike SLA comes ready to use, so your team sees a new failure pattern, or a runtime running out of memory, before the integrations behind it stop.
Errors by Mule Error Type
Errors grouped by the Mule error type from the error block (HTTP:CONNECTIVITY, HTTP:TIMEOUT), or by logger name when there is none.
Flow and Application
The flow and Mule application each error came from, taken from the processor path, the thread name or the log file name.
Full Error Context
The whole multi-line entry, with the error message, element, flow stack and stack trace, plus the correlation ID of the Mule event.
Runtime Startup and Deployment Errors
Errors the runtime writes to mule_ee.log, such as an application that failed to deploy.
JVM Health
Heap and non-heap memory, process CPU, threads, class loading and garbage collection of the Mule runtime JVM.
Each log event keeps the correlation ID of the Mule event. When your flows also send transactions to GermainUX, the transaction and its log errors share that ID, so you go from a failed API call to the error that caused it.
Failed API CallCorrelation IDLog Error BlockJVM Heap and GC
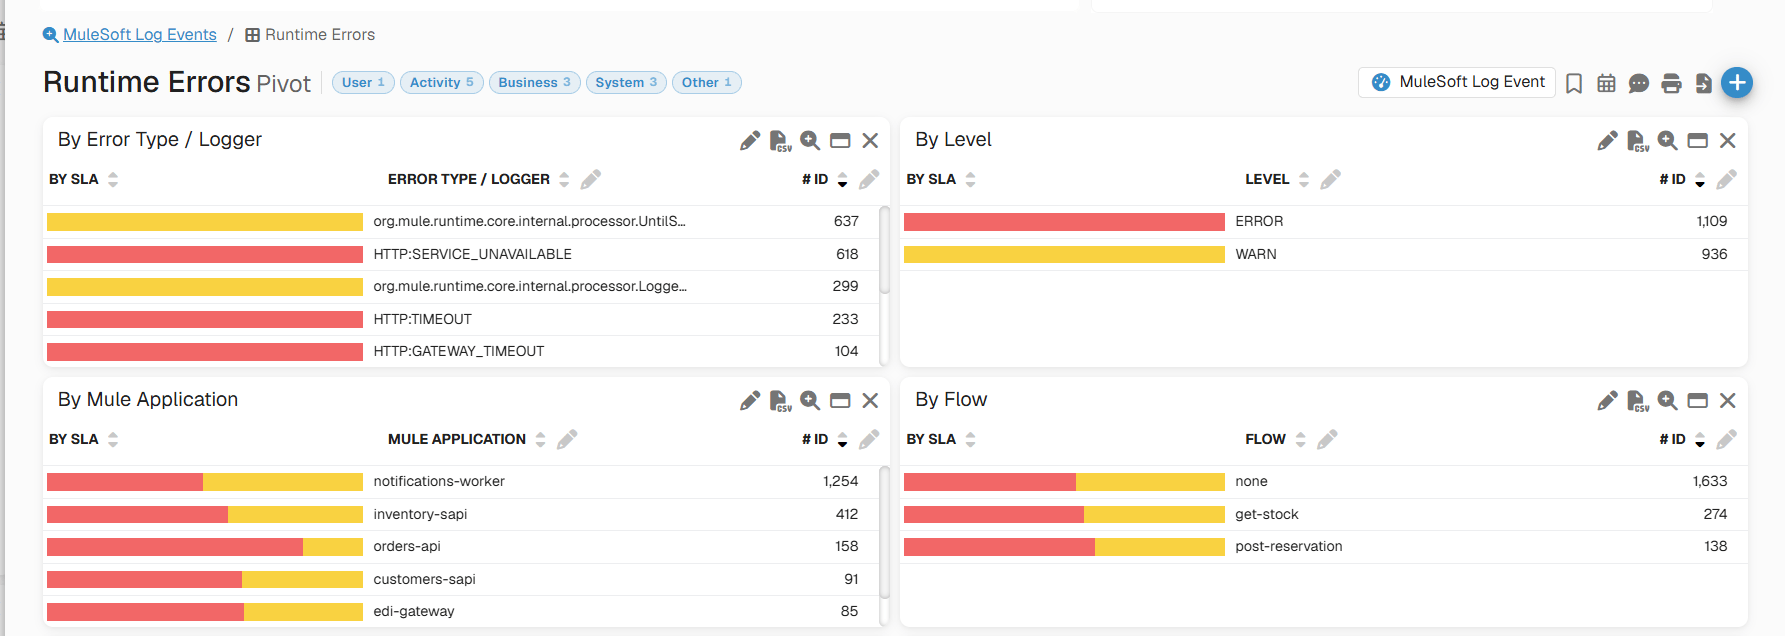
In the left menu, select Dashboards > All, and then open MuleSoft Overview in the MuleSoft folder under Application. The Runtime Errors chart counts ERROR and FATAL log events. Click it to open the MuleSoft Log Event KPI and pivot by error type, application or flow.
MuleSoft log events by error type - GermainUX
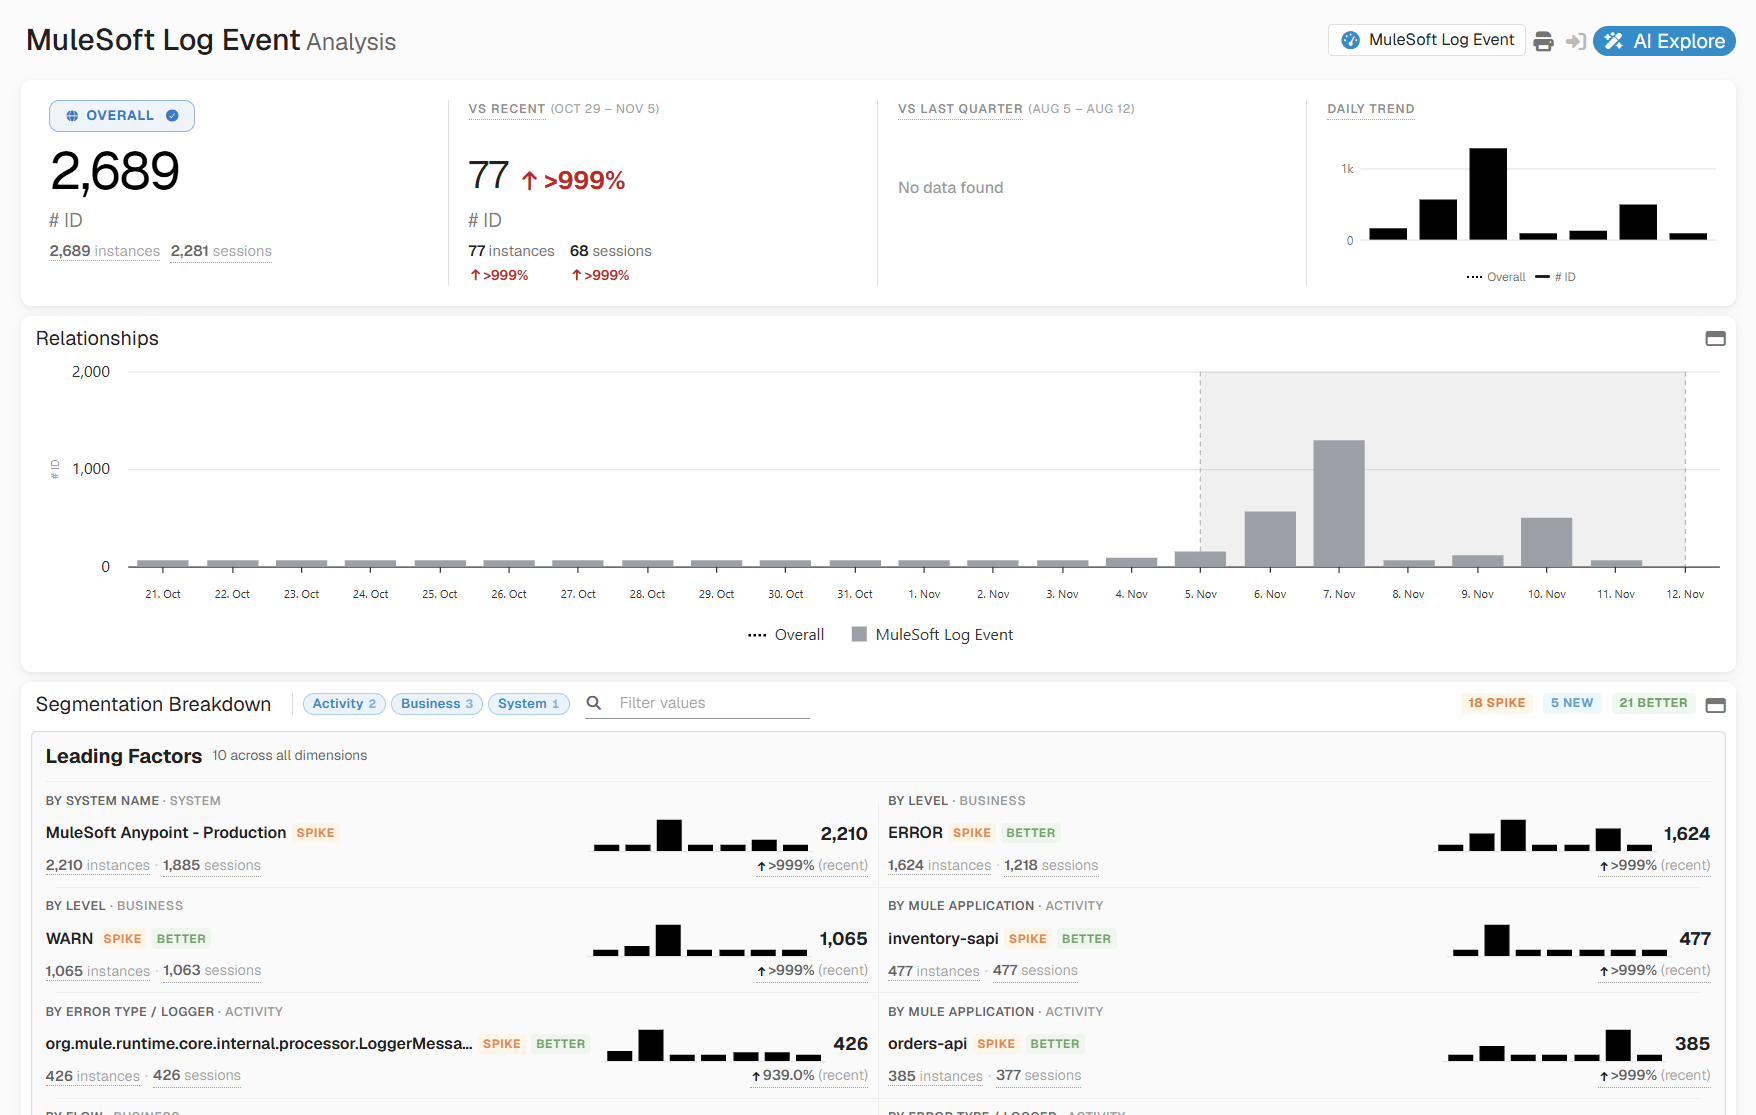
The analysis of the MuleSoft Log Event KPI shows the days with error spikes, and ranks the levels, applications and error types behind them.
Analysis of the MuleSoft Log Event KPI - GermainUX
Runs on a GermainUX Engine with access to the Mule log directory. It watches the .log files in that directory, and reads existing files when it starts.
MuleSoft Runtime Log Parser
Parses each entry, keeps the ERROR, FATAL and WARN entries with their multi-line error blocks, and records each one as a MuleSoft Log Event
JVM JMX Monitor
Connects to the runtime’s JMX port and reads memory, CPU, thread, class-loading and garbage-collection values. It records them as the same Java KPIs that the GermainUX Java agent produces.
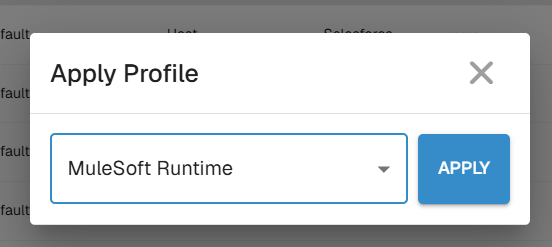
The MuleSoft Runtime server profile deploys the log directory monitor and the log parser together on the host.The parser reads the default Mule 4 log formats: the runtime format of mule_ee.log, the application format with processor path and event ID, and the format of the Mule tracing module. It skips INFO and DEBUG entries.For each event, GermainUX takes:
Field
Taken from
Error Type / Logger
The Error type line of the Mule error block, or the logger name when there is none
Level
ERROR, FATAL or WARN
Flow
The processor path, or the flow in the thread name
Mule Application
The application in the thread name, or the log file name (orders-api.log)
Correlation ID
The event ID or correlationId of the entry
Details
The whole entry, including the error block and stack trace
CloudHub 1.0, CloudHub 2.0 and Runtime Fabric applications don’t write log files you can reach. GermainUX reads their errors through Anypoint Platform instead, into the same MuleSoft Log Event KPI. See Anypoint Platform Monitoring for MuleSoft.
A GermainUX Engine on the runtime host, or on a host that can read the Mule log directory, associated with the host in GermainUX. See GermainUX Engine and Profiles to Deploy at Scale.
The path of the Mule log directory, usually $MULE_HOME/logs
For JVM metrics: remote JMX turned on in the Mule runtime JVM, and the JMX port open to the Engine
The GermainUX team sets up the JVM JMX Monitor component for your runtimes. Before you contact them:
1
Turn on remote JMX
Turn on remote JMX for the Mule runtime JVM, in $MULE_HOME/conf/wrapper.conf, and restart the runtime. Follow your organization’s rules for JMX authentication and TLS.
2
Open the JMX port to the Engine
Allow the GermainUX Engine to reach the JMX port on the runtime host.
3
Send the connection details to GermainUX support
Send the host, the JMX port and the JMX credentials, if any, to GermainUX Support. Share credentials through a secure channel.
Check that the Mule Log Directory points to the directory that holds mule_ee.log, not to a single file, and that the Engine’s user can read the files. The directory monitor doesn’t read subdirectories.
Some errors are missing
The parser reads the default Mule 4 log formats. If your log4j2.xml uses a custom pattern, the entries don’t match and GermainUX skips them. Use the default pattern for the application logs, or contact GermainUX support to adapt the parser.
Events have no application or flow
GermainUX takes the application and flow from the thread name, the processor path or the log file name. Entries the runtime writes outside a flow, such as startup errors in mule_ee.log, have no flow.
No JVM metrics arrive
Check that remote JMX is on in wrapper.conf, that the runtime was restarted afterwards, and that the Engine reaches the JMX port.
Log messages: Details holds the full log entry, including error messages, element definitions and stack traces, which can include URLs, customer identifiers and payload fragments
Infrastructure data: the log file path and the application, flow and host names
Free text: log messages contain whatever your applications write into them, so treat them as possibly containing personal or customer data
To mask, anonymize or exclude this data, see Data Privacy.
Java Heap Usage, Java Heap Available, Java Heap Space Size, Java Heap Space Allocated
Heap memory of the runtime JVM
—
Java Non-Heap Size, Java Non-Heap Available
Non-heap memory of the runtime JVM
—
Java Process CPU Load, Java Thread Count
CPU and threads of the runtime JVM
—
Java Loaded Class Count, Java Unloaded Class Count, Java Total Loaded Class Count
Class loading
—
Java GC Count, Java GC Time
Garbage collection
—
Default SLA:
SLA
KPI
Severity
Breached when
Error Spike
MuleSoft Log Event
Medium
Every 15 minutes, per error type: ERROR and FATAL entries changed by more than 200% compared with the same 15 minutes a week earlier, with at least 20 entries
For all MuleSoft KPIs, see KPIs on the MuleSoft overview.
The GermainUX team helps you get up and running faster, empower your team, turn data into actionable insights, and optimize performance to deliver measurable business outcomes.
Can't Find What You Need?
Search all GermainUX docs with Ctrl + K, or use the feedback buttons at the bottom of this page to tell us what is missing.
The content of this document is proprietary to GERMAIN SOFTWARE.
Was this page helpful?
{"docsConfig":{"theme":"mint","$schema":"https://mintlify.com/docs.json","name":"GermainUX Docs","description":"GermainUX is a real-time Operational Experience Intelligence platform that combines Monitoring + Analytics + AI + Automation to help organizations detect and resolve user, workflow, and technology issues faster, in order to 1)Improve CRM and ERP Adoption and Productivity 2)Increase eCommerce Conversion","colors":{"primary":"#2E7DF2","light":"#5B9CFF","dark":"#1A5FC8"},"logo":{"light":"https://mintcdn.com/germain-ux/ok7-BbqwVV0uk3t8/images/logo-light.png?fit=max\u0026auto=format\u0026n=ok7-BbqwVV0uk3t8\u0026q=85\u0026s=3cfe3238ac55802e43da3e4da5806f0d","dark":"https://mintcdn.com/germain-ux/ok7-BbqwVV0uk3t8/images/logo-dark.png?fit=max\u0026auto=format\u0026n=ok7-BbqwVV0uk3t8\u0026q=85\u0026s=1886121bf4312c96b6321ea733078b7f","href":"/"},"favicon":"https://mintcdn.com/germain-ux/Jw6D65yKWJ4U5yOS/images/favicon.png?fit=max\u0026auto=format\u0026n=Jw6D65yKWJ4U5yOS\u0026q=85\u0026s=bcc4dd08f0edb299e0b2af2f079f8526","appearance":{"default":"light"},"background":{"color":{"light":"#FFFFFF","dark":"#00112A"}},"navbar":{"links":[{"href":"https://germainux.atlassian.net/servicedesk/customer/portal/1","label":"Ticket"},{"href":"https://calendly.com/germainux","label":"Schedule"}],"primary":{"type":"button","label":"Contact GermainUX","href":"https://docs.germainux.com/getting-started/support"}},"footer":{"socials":{"website":"https://germainux.com"}},"seo":{"metatags":{"canonical":"https://docs.germainux.com","og:locale":"en_US","og:site_name":"GermainUX Docs","twitter:card":"summary_large_image"},"indexing":"navigable"},"styling":{"eyebrows":"section","latex":true},"integrations":{"gtm":{"tagId":"GTM-MRCBSV5R"}},"contextual":{"options":["view","chatgpt","claude"],"display":"header"},"navigation":{"pages":[]}},"deployment":{"deploymentMetadataValue":{"subdomain":"germain-ux","hasAudioNarration":false,"actualSubdomain":"germain-ux","customDomains":["docs.germainux.com"],"gitSource":{"type":"github","owner":"germainsoftware","repo":"germain-docs","deployBranch":"main","contentDirectory":"","isPrivate":true,"mountPath":"","label":"","_id":"6ae890c6c73aaa2ebb8f7a7f"},"feedback":{"contextualFeedback":{"allowEmail":true,"textInputOnly":false},"edits":false,"issues":false,"thumbs":true},"entitlements":{"AI_CHAT":{"status":"ENABLED"},"WEB_MCP":{"status":"ENABLED"},"NARRATION":{"status":"ENABLED"}},"buildId":"6af4e010e10befedd659574e","clientVersion":"0.0.4111","searchFilterCounts":[{"language":"default","tag":"Documentation","count":495},{"language":"default","tag":"GermainUX Documentation","count":495},{"language":"default","tag":"Integrations","count":255},{"language":"default","tag":"Release Notes","count":81},{"language":"default","tag":"Archive","count":73},{"language":"default","tag":"Management","count":58},{"language":"default","tag":"Analytics","count":53},{"language":"default","tag":"Deploy GermainUX","count":53},{"language":"default","tag":"Automation","count":48},{"language":"default","tag":"Success Stories","count":34}],"searchSettings":{"fullPageSearch":true,"showContentSnippets":true}},"assistantConfig":{"enableAskAiButton":false,"enableStarterQuestions":false,"enableContextualStarterQuestions":false,"enableAskAiSearchBar":true},"basePath":"","hasChatPermissions":true,"hasWebMcpPermissions":true,"toggles":[{"name":"kill-isr","enabled":true,"variant":{"name":"disabled","enabled":false,"feature_enabled":true},"impressionData":false},{"name":"custom-rbac-roles","enabled":true,"variant":{"name":"disabled","enabled":false,"feature_enabled":true},"impressionData":false},{"name":"agent-mintlify-slack","enabled":true,"variant":{"name":"disabled","enabled":false,"feature_enabled":true},"impressionData":false},{"name":"agent-integrations-settings","enabled":true,"variant":{"name":"disabled","enabled":false,"feature_enabled":true},"impressionData":false},{"name":"rbac-expansion","enabled":true,"variant":{"name":"disabled","enabled":false,"feature_enabled":true},"impressionData":false},{"name":"automations-pr-grouping","enabled":true,"variant":{"name":"disabled","enabled":false,"feature_enabled":true},"impressionData":false},{"name":"custom-prefix","enabled":true,"variant":{"name":"disabled","enabled":false,"feature_enabled":true},"impressionData":false},{"name":"analytics-v7","enabled":true,"variant":{"name":"disabled","enabled":false,"feature_enabled":true},"impressionData":false},{"name":"user-flows-analytics","enabled":true,"variant":{"name":"disabled","enabled":false,"feature_enabled":true},"impressionData":false},{"name":"no-publish-flow","enabled":true,"variant":{"name":"disabled","enabled":false,"feature_enabled":true},"impressionData":false},{"name":"workos-onboarding","enabled":true,"variant":{"name":"disabled","enabled":false,"feature_enabled":true},"impressionData":false},{"name":"llms-txt-v2","enabled":true,"variant":{"name":"disabled","enabled":false,"feature_enabled":true},"impressionData":false},{"name":"snapshot-serving-live","enabled":true,"variant":{"name":"disabled","enabled":false,"feature_enabled":true},"impressionData":false},{"name":"stripTemperatureMiddleware","enabled":true,"variant":{"name":"disabled","enabled":false,"feature_enabled":true},"impressionData":false},{"name":"support-platform-pylon-zendesk","enabled":true,"variant":{"name":"disabled","enabled":false,"feature_enabled":true},"impressionData":false},{"name":"snapshot-serving","enabled":true,"variant":{"name":"disabled","enabled":false,"feature_enabled":true},"impressionData":false},{"name":"instant-rollback","enabled":true,"variant":{"name":"disabled","enabled":false,"feature_enabled":true},"impressionData":false},{"name":"granular-notifications-server","enabled":true,"variant":{"name":"disabled","enabled":false,"feature_enabled":true},"impressionData":false},{"name":"granular-notifications","enabled":true,"variant":{"name":"disabled","enabled":false,"feature_enabled":true},"impressionData":false},{"name":"automations-fable","enabled":true,"variant":{"name":"disabled","enabled":false,"feature_enabled":true},"impressionData":false},{"name":"fixed-ai-action-pricing","enabled":true,"variant":{"name":"disabled","enabled":false,"feature_enabled":true},"impressionData":false},{"name":"automation-resolve-merge-conflict","enabled":true,"variant":{"name":"disabled","enabled":false,"feature_enabled":true},"impressionData":false},{"name":"scoped-publishing","enabled":true,"variant":{"name":"disabled","enabled":false,"feature_enabled":true},"impressionData":false},{"name":"mintql","enabled":true,"variant":{"name":"disabled","enabled":false,"feature_enabled":true},"impressionData":false},{"name":"page-level-analytics","enabled":true,"variant":{"name":"disabled","enabled":false,"feature_enabled":true},"impressionData":false},{"name":"editor-version-history-v2","enabled":true,"variant":{"name":"disabled","enabled":false,"feature_enabled":true},"impressionData":false},{"name":"billing-page-v2","enabled":true,"variant":{"name":"disabled","enabled":false,"feature_enabled":true},"impressionData":false},{"name":"full-page-search","enabled":true,"variant":{"name":"disabled","enabled":false,"feature_enabled":true},"impressionData":false},{"name":"workspace-projects","enabled":true,"variant":{"name":"disabled","enabled":false,"feature_enabled":true},"impressionData":false},{"name":"assistant-v5","enabled":true,"variant":{"name":"disabled","enabled":false,"feature_enabled":true},"impressionData":false},{"name":"fork-pr-previews","enabled":true,"variant":{"name":"disabled","enabled":false,"feature_enabled":true},"impressionData":false},{"name":"revalidation-jwt","enabled":true,"variant":{"name":"disabled","enabled":false,"feature_enabled":true},"impressionData":false},{"name":"workos-sso-scim","enabled":true,"variant":{"name":"disabled","enabled":false,"feature_enabled":true},"impressionData":false},{"name":"hobby-abuse-scan","enabled":true,"variant":{"name":"disabled","enabled":false,"feature_enabled":true},"impressionData":false},{"name":"dashboard-inbox","enabled":true,"variant":{"name":"disabled","enabled":false,"feature_enabled":true},"impressionData":false},{"name":"workos-signup","enabled":true,"variant":{"name":"disabled","enabled":false,"feature_enabled":true},"impressionData":false},{"name":"turbopuffer-dual-write","enabled":true,"variant":{"name":"disabled","enabled":false,"feature_enabled":true},"impressionData":false},{"name":"workos-enabled","enabled":true,"variant":{"name":"disabled","enabled":false,"feature_enabled":true},"impressionData":false},{"name":"approve-review-flow","enabled":true,"variant":{"name":"disabled","enabled":false,"feature_enabled":true},"impressionData":false},{"name":"editor-metadata","enabled":true,"variant":{"name":"disabled","enabled":false,"feature_enabled":true},"impressionData":false},{"name":"sso-setup-deadline-banner","enabled":true,"variant":{"name":"disabled","enabled":false,"feature_enabled":true},"impressionData":false},{"name":"turbopuffer-serve","enabled":true,"variant":{"name":"disabled","enabled":false,"feature_enabled":true},"impressionData":false},{"name":"live-agents","enabled":true,"variant":{"name":"disabled","enabled":false,"feature_enabled":true},"impressionData":false}],"googleFontsInlined":false},"customCss":[],"page":{"pagePath":"integrations/mulesoft-monitoring/mulesoft-runtime-monitoring","slug":"/integrations/mulesoft-monitoring/mulesoft-runtime-monitoring","pageMetadata":{"title":"Runtime Monitoring for MuleSoft","sidebarTitle":"Runtime Monitoring","description":"Turn the errors in your Mule runtime logs, and the health of the runtime's JVM, into KPIs and alerts for the runtimes you host.","icon":"server","keywords":["Mule runtime","mule_ee.log","MuleSoft logs","MuleSoft log parsing","Mule error type","hybrid runtime","Mule JVM","JMX"],"href":"/integrations/mulesoft-monitoring/mulesoft-runtime-monitoring"},"description":{"compiledSource":"\"use strict\";\nconst {jsx: _jsx} = arguments[0];\nconst {useMDXComponents: _provideComponents} = arguments[0];\nfunction _createMdxContent(props) {\n const _components = {\n p: \"p\",\n ..._provideComponents(),\n ...props.components\n };\n return _jsx(_components.p, {\n children: \"Turn the errors in your Mule runtime logs, and the health of the runtime’s JVM, into KPIs and alerts for the runtimes you host.\"\n });\n}\nfunction MDXContent(props = {}) {\n const {wrapper: MDXLayout} = {\n ..._provideComponents(),\n ...props.components\n };\n return MDXLayout ? _jsx(MDXLayout, {\n ...props,\n children: _jsx(_createMdxContent, {\n ...props\n })\n }) : _createMdxContent(props);\n}\nreturn {\n default: MDXContent\n};\n","frontmatter":{},"scope":{}},"pageType":"default","mdx":{"mdxSource":{"compiledSource":"\"use strict\";const{Fragment:_Fragment,jsx:_jsx,jsxs:_jsxs}=arguments[0];const{useMDXComponents:_provideComponents}=arguments[0];const GxFooter=()=>_jsx(`p`,{className:`gx-fine`,children:`The content of this document is proprietary to GERMAIN SOFTWARE.`});const GxStyle=()=>_jsx(`style`,{children:`\n.gx-meta { display:flex; flex-direction:column; gap:10px; margin:22px 0 6px; padding:16px 18px; border:1px solid rgba(15,23,42,.08); border-radius:16px; background:rgba(46,125,242,.035); font-size:13.5px; }\n.gx-meta-row { display:flex; flex-wrap:wrap; align-items:center; gap:6px; }\n.gx-meta-label { width:96px; flex:none; color:#64748b; }\n.dark .gx-meta-label { color:#94a3b8; }\n.gx-meta code { border-color:rgba(46,125,242,.25) !important; color:#1A5FC8 !important; background:rgba(46,125,242,.08) !important; }\n.dark .gx-meta { background:linear-gradient(135deg,rgba(46,125,242,.16),rgba(0,17,42,.4)); border-color:rgba(91,156,255,.22); }\n.dark .gx-meta code { color:#BFD6FF !important; background:rgba(91,156,255,.12) !important; border-color:rgba(91,156,255,.28) !important; }\n.gx-list ul { columns:2; column-gap:24px; list-style:none !important; padding-left:0 !important; margin:14px 0 0 !important; }\n.gx-list ul:has(> li:only-child) { columns:1; }\n.gx-list li { break-inside:avoid; position:relative; padding:4px 0 4px 22px !important; margin:0 !important; font-size:14.5px; }\n.gx-list li::marker { content:\"\"; }\n.gx-list li::before { content:\"\"; position:absolute; left:3px; top:13px; width:7px; height:7px; border-radius:50%; background:#2E7DF2; opacity:.75; }\n.dark .gx-list li::before { background:#5B9CFF; }\n.gx-flow { display:flex; flex-wrap:wrap; align-items:center; gap:10px 32px; margin:16px 0; }\n.gx-flow span { position:relative; display:inline-flex; align-items:center; padding:6px 12px; border-radius:8px; font-size:13.5px; font-weight:500; background:#fff; border:1px solid rgba(15,23,42,.12); color:#0f172a; box-shadow:0 1px 2px rgba(15,23,42,.05); }\n.gx-flow span:first-child, .gx-flow span:last-child { background:rgba(46,125,242,.08); border-color:rgba(46,125,242,.25); color:#1A5FC8; }\n.gx-flow span:not(:last-child)::after { content:\"\\\\2192\"; position:absolute; left:calc(100% + 9px); color:#94a3b8; font-weight:400; }\n.dark .gx-flow span { background:rgba(255,255,255,.03); border-color:rgba(255,255,255,.12); color:#e2e8f0; box-shadow:none; }\n.dark .gx-flow span:first-child, .dark .gx-flow span:last-child { background:rgba(91,156,255,.10); border-color:rgba(91,156,255,.28); color:#BFD6FF; }\n.dark .gx-flow span:not(:last-child)::after { color:#64748b; }\n#sidebar li[id] > a > div:first-child:has(> svg[aria-hidden]) { display: none; }\n#sidebar svg[style*=\"mask-image\"], #sidebar-content svg[style*=\"mask-image\"], #navigation-items svg[style*=\"mask-image\"], aside svg[style*=\"mask-image\"] { display: none !important; }\n#sidebar div:has(> svg[style*=\"mask-image\"]), #sidebar-content div:has(> svg[style*=\"mask-image\"]), #navigation-items div:has(> svg[style*=\"mask-image\"]), aside div:has(> svg[style*=\"mask-image\"]) { display: none !important; }\n.gx-fine { margin-top:56px; padding-top:20px; border-top:1px solid rgba(15,23,42,.08); font-size:13px; color:#64748b; }\n.dark .gx-fine { border-top-color:rgba(255,255,255,.08); color:#94a3b8; }\n.gx-fine p { margin:0 !important; font-size:13px !important; color:inherit !important; }\n.eyebrow { font-size:13px !important; font-weight:700 !important; letter-spacing:.12em !important; text-transform:uppercase; color:#2E7DF2 !important; display:inline-flex; align-items:center; gap:8px; padding:4px 12px; border-radius:999px; background:rgba(46,125,242,.10); border:1px solid rgba(46,125,242,.25); height:auto !important; margin-bottom:6px; }\n.dark .eyebrow { color:#8DB8FF !important; background:rgba(91,156,255,.12); border-color:rgba(91,156,255,.30); }\n#page-title { letter-spacing:-.02em; }\n.dark #page-title { background:linear-gradient(90deg,#FFFFFF 0%,#BFD6FF 100%); -webkit-background-clip:text; background-clip:text; -webkit-text-fill-color:transparent; }\n.mdx-content h2:not(.not-prose) { position:relative; padding-left:16px; }\n.mdx-content h2:not(.not-prose)::before { content:\"\"; position:absolute; left:0; top:.2em; bottom:.2em; width:4px; border-radius:4px; background:linear-gradient(180deg,#2E7DF2,#5B9CFF); }\n.dark table th { color:#BFD6FF; }\n.dark table td:first-child { color:#FFFFFF; font-weight:500; }\n@media (max-width: 820px) { .gx-list ul { columns:1; } }\n.gx-list-more:not(.is-open) > ul > li:nth-child(n+11) { display:none; }\n.gx-more-toggle { display:inline-flex; align-items:center; gap:6px; margin:8px 0 12px 22px; padding:0; border:0; background:none; cursor:pointer; font-size:14px; font-weight:600; color:#1A5FC8; }\n.gx-more-toggle:hover { text-decoration:underline; }\n.gx-more-toggle::after { content:\"\\\\25BE\"; display:inline-block; font-size:12px; transition:transform .15s; }\n.gx-list-more.is-open .gx-more-toggle::after { transform:rotate(180deg); }\n.dark .gx-more-toggle { color:#8DB8FF; }\n/* === Concept #1: hero header + numbered section tiles === */\n#content-area { counter-reset: gxsec; }\n#header { position:relative; overflow:hidden; padding:36px 30px 24px; border-radius:24px; border:1px solid rgba(91,156,255,.22); background:radial-gradient(800px 300px at 100% 0%, rgba(46,125,242,.32), transparent 65%), #0B2147; }\n#header::before { content:\"\"; position:absolute; inset:0; pointer-events:none; background-image:linear-gradient(rgba(255,255,255,.045) 1px,transparent 1px),linear-gradient(90deg,rgba(255,255,255,.045) 1px,transparent 1px); background-size:34px 34px; -webkit-mask-image:linear-gradient(100deg,transparent 15%,#000 75%); mask-image:linear-gradient(100deg,transparent 15%,#000 75%); }\n#header > * { position:relative; }\n#header #page-title { color:#fff !important; -webkit-text-fill-color:#fff !important; background:none !important; font-size:clamp(1.9rem,3.4vw,2.6rem) !important; line-height:1.06 !important; font-weight:800 !important; letter-spacing:-.035em !important; }\n#header .prose, #header .prose p, #header p { color:rgba(222,233,255,.82) !important; font-size:1.06rem; line-height:1.6; }\n#header .eyebrow { color:#BFD6FF !important; background:rgba(91,156,255,.14) !important; border-color:rgba(91,156,255,.32) !important; }\n#header button, #header [role=\"button\"] { color:#DCE8FF !important; border-color:rgba(191,214,255,.25) !important; background:rgba(255,255,255,.04) !important; }\n#content-area:has(#content > .gx-meta:first-child) #header { border-radius:24px 24px 0 0; border-bottom:0; padding-bottom:18px; }\n#content:has(> .gx-meta:first-child) { margin-top:0 !important; }\n#content > .gx-meta:first-child { margin:0 !important; padding:4px 30px 28px !important; border-radius:0 0 24px 24px !important; border:1px solid rgba(91,156,255,.22) !important; border-top:0 !important; background:#0B2147 !important; }\n#content > .gx-meta:first-child:has(+ .columns) { border-radius:0 !important; border-bottom:0 !important; padding-bottom:18px !important; }\n#content > .gx-meta:first-child + .columns { margin:0 0 8px !important; padding:4px 30px 30px !important; border:1px solid rgba(91,156,255,.22); border-top:0; border-radius:0 0 24px 24px; background:#0B2147; gap:12px !important; }\n#content > .gx-meta:first-child + .columns > * { background:rgba(255,255,255,.035) !important; border-color:rgba(91,156,255,.28) !important; border-radius:16px !important; }\n#content > .gx-meta:first-child + .columns h2, #content > .gx-meta:first-child + .columns [data-component-part=\"card-title\"] { color:#fff !important; font-size:15px !important; overflow-wrap:normal !important; word-break:normal !important; }\n#content > .gx-meta:first-child + .columns p, #content > .gx-meta:first-child + .columns [data-component-part=\"card-content\"] { color:rgba(214,226,250,.7) !important; }\n#content > .gx-meta:first-child + .columns svg { background-color:#5B9CFF !important; }\n#content > .gx-meta:first-child .gx-meta-label { color:rgba(191,214,255,.6) !important; }\n#content > .gx-meta:first-child code { font-family:inherit !important; font-weight:600 !important; font-size:12.5px !important; padding:5px 13px !important; border-radius:999px !important; color:#DCE8FF !important; background:rgba(46,125,242,.14) !important; border:1px solid rgba(91,156,255,.55) !important; }\n#content > .gx-meta:first-child a { text-decoration:none !important; border:0 !important; }\n#content > .gx-meta:first-child a:not(:has(code)) { color:#BFD6FF !important; font-weight:600; }\n#content > .gx-meta:first-child .gx-meta-row > span:not(.gx-meta-label) { color:#86EFAC !important; background:rgba(34,197,94,.14) !important; border-color:rgba(134,239,172,.35) !important; }\n.mdx-content > h2:not(.not-prose), #content > h2 { counter-increment:gxsec; display:flex !important; align-items:center; gap:14px; padding-left:0 !important; margin-top:2.6em !important; font-weight:750; letter-spacing:-.02em; }\n.mdx-content > h2:not(.not-prose)::before, #content > h2::before { content:counter(gxsec, decimal-leading-zero) !important; position:static !important; flex:none; width:40px; height:40px; border-radius:12px; display:inline-flex; align-items:center; justify-content:center; font-size:13px; font-weight:700; letter-spacing:0; color:#fff; background:linear-gradient(135deg,#2E7DF2,#5B9CFF) !important; box-shadow:0 6px 18px rgba(46,125,242,.35); }\n@media (max-width:820px) { #header, #content > .gx-meta:first-child, #content > .gx-meta:first-child + .columns { padding-left:20px !important; padding-right:20px !important; } }\n#content-area:has(#content > .columns:first-child) #header { border-radius:24px 24px 0 0; border-bottom:0; padding-bottom:18px; }\n#content:has(> .columns:first-child) { margin-top:0 !important; }\n#content > .columns:first-child { margin:0 0 8px !important; padding:4px 30px 30px !important; border:1px solid rgba(91,156,255,.22); border-top:0; border-radius:0 0 24px 24px; background:#0B2147; gap:12px !important; }\n#content > .columns:first-child > * { background:rgba(255,255,255,.035) !important; border-color:rgba(91,156,255,.28) !important; border-radius:16px !important; }\n#content > .columns:first-child h2, #content > .columns:first-child [data-component-part=\"card-title\"] { color:#fff !important; font-size:15px !important; overflow-wrap:normal !important; word-break:normal !important; }\n#content > .columns:first-child p, #content > .columns:first-child [data-component-part=\"card-content\"] { color:rgba(214,226,250,.7) !important; }\n#content > .columns:first-child svg { background-color:#5B9CFF !important; }\n/* === Shell: concept #1 (top bar, menus, page) === */\n#navbar, #navbar-transition, #navbar > div { background:#00112A !important; }\n#navbar { border-bottom:1px solid rgba(91,156,255,.18) !important; }\n#navbar a, #navbar button, #navbar .nav-tabs-item { color:rgba(220,232,255,.78) !important; }\n#navbar a:hover, #navbar button:hover, #navbar .nav-tabs-item[data-active=\"true\"] { color:#FFFFFF !important; }\n#navbar a[class*=\"bg-primary\"], #navbar a[class*=\"bg-primary\"] * { color:#FFFFFF !important; }\n#navbar a[href=\"/\"], #navbar a[href=\"/\"] * { color:#FFFFFF !important; }\n#search-bar-entry { background:rgba(255,255,255,.06) !important; border:1px solid rgba(255,255,255,.14) !important; box-shadow:none !important; }\n#search-bar-entry, #search-bar-entry * { color:rgba(220,232,255,.72) !important; }\nhtml:not(.dark) #navbar img[src*=\"logo-light\"] { display:none !important; }\nhtml:not(.dark) #navbar img[src*=\"logo-dark\"] { display:block !important; }\nhtml:not(.dark) #sidebar, html:not(.dark) #sidebar-content { background:#FFFFFF !important; }\nhtml:not(.dark) #sidebar { border-right:1px solid #E6ECF5 !important; }\n#navigation-items .sidebar-group-header { font-size:11.5px !important; letter-spacing:.08em; text-transform:uppercase; }\nhtml:not(.dark) #navigation-items .sidebar-group-header { color:#0B1B33 !important; }\n#navigation-items a { font-size:13.5px !important; border-radius:10px !important; }\nhtml:not(.dark) #navigation-items a { color:#4A5A75 !important; }\nhtml:not(.dark) #navigation-items a:hover { background:#F1F5FC !important; color:#0B1B33 !important; }\n#navigation-items li[data-active] > a, #navigation-items a[aria-current=\"page\"], #navigation-items a[class*=\"bg-primary\"] { background:#EAF2FF !important; color:#1A5FC8 !important; font-weight:600 !important; box-shadow:inset 3px 0 0 #2E7DF2; }\n.dark #navigation-items li[data-active] > a, .dark #navigation-items a[aria-current=\"page\"], .dark #navigation-items a[class*=\"bg-primary\"] { background:rgba(46,125,242,.16) !important; color:#BFD6FF !important; }\nhtml:not(.dark) #table-of-contents a { color:#5B6B85; }\nhtml:not(.dark) .mdx-content h2, html:not(.dark) .mdx-content h3 { color:#0B1B33; }\nhtml:not(.dark) .mdx-content p, html:not(.dark) .mdx-content li { color:#33415C; }\n`});function _createMdxContent(props){const _components={a:`a`,code:`code`,li:`li`,p:`p`,strong:`strong`,tbody:`tbody`,td:`td`,th:`th`,thead:`thead`,tr:`tr`,ul:`ul`,..._provideComponents(),...props.components},{Accordion,AccordionGroup,Card,CardGroup,Frame,Heading,OptimizedImage,Step,Steps,Table,_MdxComponentBoundary}=_components;if(!Accordion)_missingMdxReference(`Accordion`,true);if(!AccordionGroup)_missingMdxReference(`AccordionGroup`,true);if(!Card)_missingMdxReference(`Card`,true);if(!CardGroup)_missingMdxReference(`CardGroup`,true);if(!Frame)_missingMdxReference(`Frame`,true);if(!Heading)_missingMdxReference(`Heading`,true);if(!OptimizedImage)_missingMdxReference(`OptimizedImage`,true);if(!Step)_missingMdxReference(`Step`,true);if(!Steps)_missingMdxReference(`Steps`,true);if(!Table)_missingMdxReference(`Table`,true);if(!_MdxComponentBoundary)_missingMdxReference(`_MdxComponentBoundary`,true);return _jsxs(_Fragment,{children:[_jsx(`div`,{className:`gx-meta`,children:_jsxs(`div`,{className:`gx-meta-row`,children:[_jsx(`span`,{className:`gx-meta-label`,children:`Components`}),_jsx(_components.a,{href:`/deploy/germain-ux-engine`,children:_jsx(`code`,{children:`Engine`})})]})}),`\n`,_jsxs(CardGroup,{cols:4,children:[_jsx(Card,{title:`How It Works`,icon:`gears`,href:`#how-it-works`,children:_jsx(_components.p,{children:`Log parser and JMX`})}),_jsx(Card,{title:`Before You Start`,icon:`clipboard-check`,href:`#before-you-start`,children:_jsx(_components.p,{children:`Engine and log access`})}),_jsx(Card,{title:`Set It Up`,icon:`sliders`,href:`#set-it-up`,children:_jsx(_components.p,{children:`Server profile and JMX`})}),_jsx(Card,{title:`KPIs`,icon:`gauge`,href:`#kpis`,children:_jsx(_components.p,{children:`Log events and JVM`})})]}),`\n`,_jsx(Heading,{level:`2`,id:`overview`,children:`Overview`}),`\n`,_jsxs(_components.p,{children:[`GermainUX shows you `,_jsx(_components.strong,{children:`which errors your Mule runtimes raise, in which application and flow`}),`, for the runtimes you host yourself. Each ERROR, FATAL and WARN entry in `,_jsx(_components.code,{children:`mule_ee.log`}),` and the application logs becomes a log event with its Mule error type, such as `,_jsx(_components.code,{children:`HTTP:CONNECTIVITY`}),`, its flow, application and correlation ID, and the full error block. Next to it, GermainUX tracks the runtime’s JVM: heap, CPU, threads and garbage collection. An error-spike SLA comes ready to use, so your team sees a new failure pattern, or a runtime running out of memory, before the integrations behind it stop.`]}),`\n`,_jsxs(CardGroup,{cols:2,children:[_jsx(Card,{title:`Errors by Mule Error Type`,icon:`triangle-exclamation`,children:_jsxs(_components.p,{children:[`Errors grouped by the Mule error type from the error block (`,_jsx(_components.code,{children:`HTTP:CONNECTIVITY`}),`, `,_jsx(_components.code,{children:`HTTP:TIMEOUT`}),`), or by logger name when there is none.`]})}),_jsx(Card,{title:`Flow and Application`,icon:`diagram-project`,children:_jsx(_components.p,{children:`The flow and Mule application each error came from, taken from the processor path, the thread name or the log file name.`})}),_jsx(Card,{title:`Full Error Context`,icon:`file-lines`,children:_jsx(_components.p,{children:`The whole multi-line entry, with the error message, element, flow stack and stack trace, plus the correlation ID of the Mule event.`})}),_jsx(Card,{title:`Runtime Startup and Deployment Errors`,icon:`rocket`,children:_jsxs(_components.p,{children:[`Errors the runtime writes to `,_jsx(_components.code,{children:`mule_ee.log`}),`, such as an application that failed to deploy.`]})}),_jsx(Card,{title:`JVM Health`,icon:`memory`,children:_jsx(_components.p,{children:`Heap and non-heap memory, process CPU, threads, class loading and garbage collection of the Mule runtime JVM.`})})]}),`\n`,_jsx(Heading,{level:`3`,id:`questions-it-answers`,children:`Questions It Answers`}),`\n`,_jsx(`div`,{className:`gx-list`,children:_jsxs(_components.ul,{children:[`\n`,_jsx(_components.li,{children:`Which Mule error types are we getting most, and since when?`}),`\n`,_jsx(_components.li,{children:`Which application and flow does this error come from?`}),`\n`,_jsx(_components.li,{children:`Did a new error type appear after the last deployment?`}),`\n`,_jsx(_components.li,{children:`Which application failed to deploy when the runtime restarted?`}),`\n`,_jsx(_components.li,{children:`Is the runtime running out of heap before the errors start?`}),`\n`,_jsx(_components.li,{children:`Which API call does this log error belong to?`}),`\n`]})}),`\n`,_jsx(Heading,{level:`3`,id:`how-it-connects-to-other-data`,children:`How It Connects to Other Data`}),`\n`,_jsx(_components.p,{children:`Each log event keeps the correlation ID of the Mule event. When your flows also send transactions to GermainUX, the transaction and its log errors share that ID, so you go from a failed API call to the error that caused it.`}),`\n`,_jsxs(`div`,{className:`gx-flow`,children:[_jsx(`span`,{children:`Failed API Call`}),_jsx(`span`,{children:`Correlation ID`}),_jsx(`span`,{children:`Log Error Block`}),_jsx(`span`,{children:`JVM Heap and GC`})]}),`\n`,_jsx(Heading,{level:`3`,id:`see-it-on-the-dashboard`,children:`See It on the Dashboard`}),`\n`,_jsxs(_components.p,{children:[`In the left menu, select `,_jsx(_components.strong,{children:`Dashboards > All`}),`, and then open `,_jsx(_components.strong,{children:`MuleSoft Overview`}),` in the `,_jsx(_components.strong,{children:`MuleSoft`}),` folder under `,_jsx(_components.strong,{children:`Application`}),`. The `,_jsx(_components.strong,{children:`Runtime Errors`}),` chart counts ERROR and FATAL log events. Click it to open the `,_jsx(_components.strong,{children:`MuleSoft Log Event`}),` KPI and pivot by error type, application or flow.`]}),`\n`,_jsx(Frame,{caption:`MuleSoft log events by error type - GermainUX`,children:_jsx(OptimizedImage,{loading:`lazy`,src:`https://mintcdn.com/germain-ux/yNXlW51ZNuuaNNHr/images/main/mulesoft-runtime-monitoring/mulesoft-log-events-by-error-type.png?fit=max\u0026auto=format\u0026n=yNXlW51ZNuuaNNHr\u0026q=85\u0026s=3f8a1be52b973d36ae7aeae45b7acc7f`,alt:`Runtime Errors pivot of the MuleSoft Log Event KPI by error type, level, Mule application and flow`,\"data-og-width\":`1785`,width:`1785`,\"data-og-height\":`636`,height:`636`,\"data-path\":`images/main/mulesoft-runtime-monitoring/mulesoft-log-events-by-error-type.png`,\"data-optimize\":`true`,\"data-opv\":`3`,srcset:`https://mintcdn.com/germain-ux/yNXlW51ZNuuaNNHr/images/main/mulesoft-runtime-monitoring/mulesoft-log-events-by-error-type.png?w=280\u0026fit=max\u0026auto=format\u0026n=yNXlW51ZNuuaNNHr\u0026q=85\u0026s=599b76b4009ab28d659a7e4b1acd3967 280w, https://mintcdn.com/germain-ux/yNXlW51ZNuuaNNHr/images/main/mulesoft-runtime-monitoring/mulesoft-log-events-by-error-type.png?w=560\u0026fit=max\u0026auto=format\u0026n=yNXlW51ZNuuaNNHr\u0026q=85\u0026s=e3c785e4c98ec75379d73b594e46c82f 560w, https://mintcdn.com/germain-ux/yNXlW51ZNuuaNNHr/images/main/mulesoft-runtime-monitoring/mulesoft-log-events-by-error-type.png?w=840\u0026fit=max\u0026auto=format\u0026n=yNXlW51ZNuuaNNHr\u0026q=85\u0026s=d1e54d504abe1c7e63c7709f2c7be199 840w, https://mintcdn.com/germain-ux/yNXlW51ZNuuaNNHr/images/main/mulesoft-runtime-monitoring/mulesoft-log-events-by-error-type.png?w=1100\u0026fit=max\u0026auto=format\u0026n=yNXlW51ZNuuaNNHr\u0026q=85\u0026s=8c7c3e4fa4d52600449398627226b4c1 1100w, https://mintcdn.com/germain-ux/yNXlW51ZNuuaNNHr/images/main/mulesoft-runtime-monitoring/mulesoft-log-events-by-error-type.png?w=1650\u0026fit=max\u0026auto=format\u0026n=yNXlW51ZNuuaNNHr\u0026q=85\u0026s=650068f9f9da7b95978065e5312687ec 1650w, https://mintcdn.com/germain-ux/yNXlW51ZNuuaNNHr/images/main/mulesoft-runtime-monitoring/mulesoft-log-events-by-error-type.png?w=2500\u0026fit=max\u0026auto=format\u0026n=yNXlW51ZNuuaNNHr\u0026q=85\u0026s=f0c9768a2c7b28a70afcc20f53b08c56 2500w`})}),`\n`,_jsxs(_components.p,{children:[`The analysis of the `,_jsx(_components.strong,{children:`MuleSoft Log Event`}),` KPI shows the days with error spikes, and ranks the levels, applications and error types behind them.`]}),`\n`,_jsx(Frame,{caption:`Analysis of the MuleSoft Log Event KPI - GermainUX`,children:_jsx(OptimizedImage,{loading:`lazy`,src:`https://mintcdn.com/germain-ux/yNXlW51ZNuuaNNHr/images/main/mulesoft-runtime-monitoring/mulesoft-log-event-analysis.png?fit=max\u0026auto=format\u0026n=yNXlW51ZNuuaNNHr\u0026q=85\u0026s=6c42397fb2618404725210310f0f0df9`,alt:`Analysis Dashboard of the MuleSoft Log Event KPI with daily error counts and leading factors by system, level, Mule application and error type`,\"data-og-width\":`1756`,width:`1756`,\"data-og-height\":`1115`,height:`1115`,\"data-path\":`images/main/mulesoft-runtime-monitoring/mulesoft-log-event-analysis.png`,\"data-optimize\":`true`,\"data-opv\":`3`,srcset:`https://mintcdn.com/germain-ux/yNXlW51ZNuuaNNHr/images/main/mulesoft-runtime-monitoring/mulesoft-log-event-analysis.png?w=280\u0026fit=max\u0026auto=format\u0026n=yNXlW51ZNuuaNNHr\u0026q=85\u0026s=12b845658cbdffb00e5bca4f3e1a58ef 280w, https://mintcdn.com/germain-ux/yNXlW51ZNuuaNNHr/images/main/mulesoft-runtime-monitoring/mulesoft-log-event-analysis.png?w=560\u0026fit=max\u0026auto=format\u0026n=yNXlW51ZNuuaNNHr\u0026q=85\u0026s=9aeaa362103bcf15268f252673072630 560w, https://mintcdn.com/germain-ux/yNXlW51ZNuuaNNHr/images/main/mulesoft-runtime-monitoring/mulesoft-log-event-analysis.png?w=840\u0026fit=max\u0026auto=format\u0026n=yNXlW51ZNuuaNNHr\u0026q=85\u0026s=2440e22c9066a68144e379970e522bab 840w, https://mintcdn.com/germain-ux/yNXlW51ZNuuaNNHr/images/main/mulesoft-runtime-monitoring/mulesoft-log-event-analysis.png?w=1100\u0026fit=max\u0026auto=format\u0026n=yNXlW51ZNuuaNNHr\u0026q=85\u0026s=2d3a48e5251430e809f13de4db265361 1100w, https://mintcdn.com/germain-ux/yNXlW51ZNuuaNNHr/images/main/mulesoft-runtime-monitoring/mulesoft-log-event-analysis.png?w=1650\u0026fit=max\u0026auto=format\u0026n=yNXlW51ZNuuaNNHr\u0026q=85\u0026s=9cbbfc5705acad35792c86490e81dc81 1650w, https://mintcdn.com/germain-ux/yNXlW51ZNuuaNNHr/images/main/mulesoft-runtime-monitoring/mulesoft-log-event-analysis.png?w=2500\u0026fit=max\u0026auto=format\u0026n=yNXlW51ZNuuaNNHr\u0026q=85\u0026s=935508d5fc5ffe576b3e4e6de0c626cc 2500w`})}),`\n`,_jsx(Frame,{caption:`Heap usage of a Mule runtime JVM - GermainUX`,children:_jsx(OptimizedImage,{loading:`lazy`,src:`https://mintcdn.com/germain-ux/yNXlW51ZNuuaNNHr/images/main/mulesoft-runtime-monitoring/mule-runtime-jvm-heap.png?fit=max\u0026auto=format\u0026n=yNXlW51ZNuuaNNHr\u0026q=85\u0026s=f293ea7f9052dd137eb1424796e6157a`,alt:`Java Heap Usage drillthrough showing the heap usage of a Mule runtime JVM per hour over four days`,\"data-og-width\":`2230`,width:`2230`,\"data-og-height\":`337`,height:`337`,\"data-path\":`images/main/mulesoft-runtime-monitoring/mule-runtime-jvm-heap.png`,\"data-optimize\":`true`,\"data-opv\":`3`,srcset:`https://mintcdn.com/germain-ux/yNXlW51ZNuuaNNHr/images/main/mulesoft-runtime-monitoring/mule-runtime-jvm-heap.png?w=280\u0026fit=max\u0026auto=format\u0026n=yNXlW51ZNuuaNNHr\u0026q=85\u0026s=51e86c7e810288f35b864739387a509e 280w, https://mintcdn.com/germain-ux/yNXlW51ZNuuaNNHr/images/main/mulesoft-runtime-monitoring/mule-runtime-jvm-heap.png?w=560\u0026fit=max\u0026auto=format\u0026n=yNXlW51ZNuuaNNHr\u0026q=85\u0026s=8869400870a925746b36a370d700a5a1 560w, https://mintcdn.com/germain-ux/yNXlW51ZNuuaNNHr/images/main/mulesoft-runtime-monitoring/mule-runtime-jvm-heap.png?w=840\u0026fit=max\u0026auto=format\u0026n=yNXlW51ZNuuaNNHr\u0026q=85\u0026s=5512ff8340720f1a0b8fc8cc07a8bcac 840w, https://mintcdn.com/germain-ux/yNXlW51ZNuuaNNHr/images/main/mulesoft-runtime-monitoring/mule-runtime-jvm-heap.png?w=1100\u0026fit=max\u0026auto=format\u0026n=yNXlW51ZNuuaNNHr\u0026q=85\u0026s=4d2fa9d42638e42550234b50f900a734 1100w, https://mintcdn.com/germain-ux/yNXlW51ZNuuaNNHr/images/main/mulesoft-runtime-monitoring/mule-runtime-jvm-heap.png?w=1650\u0026fit=max\u0026auto=format\u0026n=yNXlW51ZNuuaNNHr\u0026q=85\u0026s=323a6037f352ddc1a9dbb6a9b69db787 1650w, https://mintcdn.com/germain-ux/yNXlW51ZNuuaNNHr/images/main/mulesoft-runtime-monitoring/mule-runtime-jvm-heap.png?w=2500\u0026fit=max\u0026auto=format\u0026n=yNXlW51ZNuuaNNHr\u0026q=85\u0026s=4d35e72b6d0db66e9c08e939f21009d4 2500w`})}),`\n`,_jsx(Heading,{level:`2`,id:`how-it-works`,children:`How It Works`}),`\n`,_jsxs(Table,{children:[_jsx(_components.thead,{children:_jsxs(_components.tr,{children:[_jsx(_components.th,{children:`Component`}),_jsx(_components.th,{children:`What it does`})]})}),_jsxs(_components.tbody,{children:[_jsxs(_components.tr,{children:[_jsx(_components.td,{children:_jsx(_components.strong,{children:`MuleSoft Runtime Log Directory Monitor`})}),_jsxs(_components.td,{children:[`Runs on a GermainUX Engine with access to the Mule log directory. It watches the `,_jsx(_components.code,{children:`.log`}),` files in that directory, and reads existing files when it starts.`]})]}),_jsxs(_components.tr,{children:[_jsx(_components.td,{children:_jsx(_components.strong,{children:`MuleSoft Runtime Log Parser`})}),_jsxs(_components.td,{children:[`Parses each entry, keeps the ERROR, FATAL and WARN entries with their multi-line error blocks, and records each one as a `,_jsx(_components.strong,{children:`MuleSoft Log Event`})]})]}),_jsxs(_components.tr,{children:[_jsx(_components.td,{children:_jsx(_components.strong,{children:`JVM JMX Monitor`})}),_jsx(_components.td,{children:`Connects to the runtime’s JMX port and reads memory, CPU, thread, class-loading and garbage-collection values. It records them as the same Java KPIs that the GermainUX Java agent produces.`})]})]})]}),`\n`,_jsxs(_components.p,{children:[`The `,_jsx(_components.strong,{children:`MuleSoft Runtime`}),` server profile deploys the log directory monitor and the log parser together on the host.`]}),`\n`,_jsxs(_components.p,{children:[`The parser reads the default Mule 4 log formats: the runtime format of `,_jsx(_components.code,{children:`mule_ee.log`}),`, the application format with processor path and event ID, and the format of the Mule tracing module. It skips INFO and DEBUG entries.`]}),`\n`,_jsx(_components.p,{children:`For each event, GermainUX takes:`}),`\n`,_jsxs(Table,{children:[_jsx(_components.thead,{children:_jsxs(_components.tr,{children:[_jsx(_components.th,{children:`Field`}),_jsx(_components.th,{children:`Taken from`})]})}),_jsxs(_components.tbody,{children:[_jsxs(_components.tr,{children:[_jsx(_components.td,{children:_jsx(_components.strong,{children:`Error Type / Logger`})}),_jsxs(_components.td,{children:[`The `,_jsx(_components.code,{children:`Error type`}),` line of the Mule error block, or the logger name when there is none`]})]}),_jsxs(_components.tr,{children:[_jsx(_components.td,{children:_jsx(_components.strong,{children:`Level`})}),_jsxs(_components.td,{children:[_jsx(_components.code,{children:`ERROR`}),`, `,_jsx(_components.code,{children:`FATAL`}),` or `,_jsx(_components.code,{children:`WARN`})]})]}),_jsxs(_components.tr,{children:[_jsx(_components.td,{children:_jsx(_components.strong,{children:`Flow`})}),_jsx(_components.td,{children:`The processor path, or the flow in the thread name`})]}),_jsxs(_components.tr,{children:[_jsx(_components.td,{children:_jsx(_components.strong,{children:`Mule Application`})}),_jsxs(_components.td,{children:[`The application in the thread name, or the log file name (`,_jsx(_components.code,{children:`orders-api.log`}),`)`]})]}),_jsxs(_components.tr,{children:[_jsx(_components.td,{children:_jsx(_components.strong,{children:`Correlation ID`})}),_jsxs(_components.td,{children:[`The event ID or `,_jsx(_components.code,{children:`correlationId`}),` of the entry`]})]}),_jsxs(_components.tr,{children:[_jsx(_components.td,{children:_jsx(_components.strong,{children:`Details`})}),_jsx(_components.td,{children:`The whole entry, including the error block and stack trace`})]})]})]}),`\n`,_jsxs(_components.p,{children:[`CloudHub 1.0, CloudHub 2.0 and Runtime Fabric applications don’t write log files you can reach. GermainUX reads their errors through Anypoint Platform instead, into the same `,_jsx(_components.strong,{children:`MuleSoft Log Event`}),` KPI. See `,_jsx(_components.a,{href:`/integrations/mulesoft-monitoring/mulesoft-anypoint-platform-monitoring`,children:`Anypoint Platform Monitoring for MuleSoft`}),`.`]}),`\n`,_jsx(Heading,{level:`2`,id:`before-you-start`,children:`Before You Start`}),`\n`,_jsx(`div`,{className:`gx-list`,children:_jsxs(_components.ul,{children:[`\n`,_jsx(_components.li,{children:`A Mule 4 runtime that you host, on a server or VM`}),`\n`,_jsxs(_components.li,{children:[`A GermainUX Engine on the runtime host, or on a host that can read the Mule log directory, associated with the host in GermainUX. See `,_jsx(_components.a,{href:`/deploy/germain-ux-engine`,children:`GermainUX Engine`}),` and `,_jsx(_components.a,{href:`/management/profiles-to-deploy-at-scale`,children:`Profiles to Deploy at Scale`}),`.`]}),`\n`,_jsxs(_components.li,{children:[`The path of the Mule log directory, usually `,_jsx(_components.code,{children:`$MULE_HOME/logs`})]}),`\n`,_jsx(_components.li,{children:`For JVM metrics: remote JMX turned on in the Mule runtime JVM, and the JMX port open to the Engine`}),`\n`]})}),`\n`,_jsx(Heading,{level:`2`,id:`set-it-up`,children:`Set It Up`}),`\n`,_jsx(Heading,{level:`3`,id:`enable-log-monitoring`,children:`Enable Log Monitoring`}),`\n`,_jsxs(Steps,{children:[_jsx(Step,{title:`Select the Mule runtime host`,children:_jsxs(_components.p,{children:[`In the left menu, go to `,_jsx(_components.strong,{children:`Settings > Data Sources`}),`, and open the `,_jsx(_components.strong,{children:`Hosts`}),` tab. Select the host that runs the Mule runtime.`]})}),_jsxs(Step,{title:`Select the MuleSoft Runtime profile`,children:[_jsxs(_components.p,{children:[`Click `,_jsx(_components.strong,{children:`Apply Profile`}),`, select `,_jsx(_components.strong,{children:`MuleSoft Runtime`}),`, and click `,_jsx(_components.strong,{children:`Apply`}),`.`]}),_jsx(Frame,{caption:`MuleSoft Runtime profile in the Apply Profile dialog - GermainUX`,children:_jsx(OptimizedImage,{loading:`lazy`,src:`https://mintcdn.com/germain-ux/yNXlW51ZNuuaNNHr/images/main/mulesoft-runtime-monitoring/apply-mulesoft-runtime-profile.png?fit=max\u0026auto=format\u0026n=yNXlW51ZNuuaNNHr\u0026q=85\u0026s=1070cb94a18406c701600ae669114bf5`,alt:`Apply Profile dialog with the MuleSoft Runtime profile selected and the Apply button`,\"data-og-width\":`552`,width:`552`,\"data-og-height\":`247`,height:`247`,\"data-path\":`images/main/mulesoft-runtime-monitoring/apply-mulesoft-runtime-profile.png`,\"data-optimize\":`true`,\"data-opv\":`3`,srcset:`https://mintcdn.com/germain-ux/yNXlW51ZNuuaNNHr/images/main/mulesoft-runtime-monitoring/apply-mulesoft-runtime-profile.png?w=280\u0026fit=max\u0026auto=format\u0026n=yNXlW51ZNuuaNNHr\u0026q=85\u0026s=4d694fc4b679daafd2783c525da4ea7f 280w, https://mintcdn.com/germain-ux/yNXlW51ZNuuaNNHr/images/main/mulesoft-runtime-monitoring/apply-mulesoft-runtime-profile.png?w=560\u0026fit=max\u0026auto=format\u0026n=yNXlW51ZNuuaNNHr\u0026q=85\u0026s=6361ebac40f458bf765723157c604fb2 560w, https://mintcdn.com/germain-ux/yNXlW51ZNuuaNNHr/images/main/mulesoft-runtime-monitoring/apply-mulesoft-runtime-profile.png?w=840\u0026fit=max\u0026auto=format\u0026n=yNXlW51ZNuuaNNHr\u0026q=85\u0026s=91ac04a85834f9dfe529b4297b6345ea 840w, https://mintcdn.com/germain-ux/yNXlW51ZNuuaNNHr/images/main/mulesoft-runtime-monitoring/apply-mulesoft-runtime-profile.png?w=1100\u0026fit=max\u0026auto=format\u0026n=yNXlW51ZNuuaNNHr\u0026q=85\u0026s=ba377d19b309d5e326491781e04f0538 1100w, https://mintcdn.com/germain-ux/yNXlW51ZNuuaNNHr/images/main/mulesoft-runtime-monitoring/apply-mulesoft-runtime-profile.png?w=1650\u0026fit=max\u0026auto=format\u0026n=yNXlW51ZNuuaNNHr\u0026q=85\u0026s=db0d8b6edd45939bb1b37a5afb3ca63f 1650w, https://mintcdn.com/germain-ux/yNXlW51ZNuuaNNHr/images/main/mulesoft-runtime-monitoring/apply-mulesoft-runtime-profile.png?w=2500\u0026fit=max\u0026auto=format\u0026n=yNXlW51ZNuuaNNHr\u0026q=85\u0026s=10eb2e5aa21f133ac6efd773ee461f69 2500w`})})]}),_jsxs(Step,{title:`Enter the profile values`,children:[_jsx(_components.p,{children:`GermainUX opens a wizard with the fields of the profile:`}),_jsxs(Table,{children:[_jsx(_components.thead,{children:_jsxs(_components.tr,{children:[_jsx(_components.th,{children:`Field`}),_jsx(_components.th,{children:`Value`})]})}),_jsxs(_components.tbody,{children:[_jsxs(_components.tr,{children:[_jsx(_components.td,{children:_jsx(_components.strong,{children:`Application`})}),_jsxs(_components.td,{children:[`The monitored application the events belong to. The default is `,_jsx(_components.code,{children:`MuleSoft`}),`.`]})]}),_jsxs(_components.tr,{children:[_jsx(_components.td,{children:_jsx(_components.strong,{children:`Mule Log Directory`})}),_jsxs(_components.td,{children:[`The directory that holds `,_jsx(_components.code,{children:`mule_ee.log`}),` and the application logs, usually `,_jsx(_components.code,{children:`$MULE_HOME/logs`}),`. Select an existing file path data source, or create one.`]})]})]})]})]}),_jsx(Step,{title:`Finish the wizard`,children:_jsxs(_components.p,{children:[`Finish the wizard. GermainUX deploys the `,_jsx(_components.strong,{children:`MuleSoft Runtime Log Directory Monitor`}),` and the `,_jsx(_components.strong,{children:`MuleSoft Runtime Log Parser`}),` on the host’s Engine.`]})})]}),`\n`,_jsx(_components.p,{children:`Repeat these steps for each host that runs a Mule runtime.`}),`\n`,_jsx(Heading,{level:`3`,id:`enable-jvm-monitoring-optional`,children:`Enable JVM Monitoring (Optional)`}),`\n`,_jsxs(_components.p,{children:[`The GermainUX team sets up the `,_jsx(_components.strong,{children:`JVM JMX Monitor`}),` component for your runtimes. Before you contact them:`]}),`\n`,_jsxs(Steps,{children:[_jsx(Step,{title:`Turn on remote JMX`,children:_jsxs(_components.p,{children:[`Turn on remote JMX for the Mule runtime JVM, in `,_jsx(_components.code,{children:`$MULE_HOME/conf/wrapper.conf`}),`, and restart the runtime. Follow your organization’s rules for JMX authentication and TLS.`]})}),_jsx(Step,{title:`Open the JMX port to the Engine`,children:_jsx(_components.p,{children:`Allow the GermainUX Engine to reach the JMX port on the runtime host.`})}),_jsx(Step,{title:`Send the connection details to GermainUX support`,children:_jsxs(_components.p,{children:[`Send the host, the JMX port and the JMX credentials, if any, to `,_jsx(_components.a,{href:`/getting-started/support`,children:`GermainUX Support`}),`. Share credentials through a secure channel.`]})})]}),`\n`,_jsxs(_components.p,{children:[`For deeper data, such as database (JDBC) and JMS calls, add the GermainUX Java agent to the runtime instead. See `,_jsx(_components.a,{href:`/integrations/java-monitoring`,children:`Java Operational Experience Intelligence`}),`.`]}),`\n`,_jsx(Heading,{level:`3`,id:`disable-monitoring`,children:`Disable Monitoring`}),`\n`,_jsxs(Steps,{children:[_jsx(Step,{title:`Find the components`,children:_jsxs(_components.p,{children:[`In the left menu, go to `,_jsx(_components.strong,{children:`Settings > Germain > State`}),`, open `,_jsx(_components.strong,{children:`Components`}),`, and search for `,_jsx(_components.strong,{children:`MuleSoft Runtime`}),`.`]})}),_jsx(Step,{title:`Turn them off`,children:_jsxs(_components.p,{children:[`Turn off `,_jsx(_components.strong,{children:`Enabled`}),` for the `,_jsx(_components.strong,{children:`MuleSoft Runtime Log Directory Monitor`}),` and the `,_jsx(_components.strong,{children:`MuleSoft Runtime Log Parser`}),` of the host.`]})})]}),`\n`,_jsx(Heading,{level:`2`,id:`validate`,children:`Validate`}),`\n`,_jsx(_components.p,{children:`Cause a test error in a non-production application, for example by calling an API whose backend is unreachable. Within a few minutes:`}),`\n`,_jsx(`div`,{className:`gx-list`,children:_jsxs(_components.ul,{children:[`\n`,_jsxs(_components.li,{children:[`The `,_jsx(_components.strong,{children:`Runtime Errors`}),` chart on the `,_jsx(_components.strong,{children:`MuleSoft Overview`}),` dashboard counts the error`]}),`\n`,_jsxs(_components.li,{children:[`The `,_jsx(_components.strong,{children:`MuleSoft Log Event`}),` KPI shows it with its Mule error type, application and flow`]}),`\n`,_jsxs(_components.li,{children:[_jsx(_components.strong,{children:`Details`}),` holds the whole error block`]}),`\n`]})}),`\n`,_jsxs(_components.p,{children:[`For JVM monitoring, check that the `,_jsx(_components.strong,{children:`Java Heap Usage`}),` KPI has values for the runtime JVM.`]}),`\n`,_jsx(Heading,{level:`2`,id:`troubleshooting`,children:`Troubleshooting`}),`\n`,_jsxs(AccordionGroup,{children:[_jsx(Accordion,{title:`No log events arrive`,id:`no-log-events-arrive`,children:_jsxs(_components.p,{children:[`Check that the `,_jsx(_components.strong,{children:`Mule Log Directory`}),` points to the directory that holds `,_jsx(_components.code,{children:`mule_ee.log`}),`, not to a single file, and that the Engine’s user can read the files. The directory monitor doesn’t read subdirectories.`]})}),_jsx(Accordion,{title:`Some errors are missing`,id:`some-errors-are-missing`,children:_jsxs(_components.p,{children:[`The parser reads the default Mule 4 log formats. If your `,_jsx(_components.code,{children:`log4j2.xml`}),` uses a custom pattern, the entries don’t match and GermainUX skips them. Use the default pattern for the application logs, or contact GermainUX support to adapt the parser.`]})}),_jsx(Accordion,{title:`Events have no application or flow`,id:`events-have-no-application-or-flow`,children:_jsxs(_components.p,{children:[`GermainUX takes the application and flow from the thread name, the processor path or the log file name. Entries the runtime writes outside a flow, such as startup errors in `,_jsx(_components.code,{children:`mule_ee.log`}),`, have no flow.`]})}),_jsx(Accordion,{title:`No JVM metrics arrive`,id:`no-jvm-metrics-arrive`,children:_jsxs(_components.p,{children:[`Check that remote JMX is on in `,_jsx(_components.code,{children:`wrapper.conf`}),`, that the runtime was restarted afterwards, and that the Engine reaches the JMX port.`]})})]}),`\n`,_jsx(Heading,{level:`2`,id:`security-and-privacy`,children:`Security and Privacy`}),`\n`,_jsx(_components.p,{children:`Runtime log data includes personal data:`}),`\n`,_jsx(`div`,{className:`gx-list`,children:_jsxs(_components.ul,{children:[`\n`,_jsxs(_components.li,{children:[_jsx(_components.strong,{children:`Log messages`}),`: `,_jsx(_components.strong,{children:`Details`}),` holds the full log entry, including error messages, element definitions and stack traces, which can include URLs, customer identifiers and payload fragments`]}),`\n`,_jsxs(_components.li,{children:[_jsx(_components.strong,{children:`Infrastructure data`}),`: the log file path and the application, flow and host names`]}),`\n`,_jsxs(_components.li,{children:[_jsx(_components.strong,{children:`Free text`}),`: log messages contain whatever your applications write into them, so treat them as possibly containing personal or customer data`]}),`\n`]})}),`\n`,_jsxs(_components.p,{children:[`To mask, anonymize or exclude this data, see `,_jsx(_components.a,{href:`/management/compliance-privacy-and-security/data-privacy`,children:`Data Privacy`}),`.`]}),`\n`,_jsx(Heading,{level:`2`,id:`kpis`,children:`KPIs`}),`\n`,_jsxs(Table,{children:[_jsx(_components.thead,{children:_jsxs(_components.tr,{children:[_jsx(_components.th,{children:`KPI`}),_jsx(_components.th,{children:`What it measures`}),_jsx(_components.th,{children:`Fields`})]})}),_jsxs(_components.tbody,{children:[_jsxs(_components.tr,{children:[_jsx(_components.td,{children:_jsx(_components.strong,{children:`MuleSoft Log Event`})}),_jsx(_components.td,{children:`ERROR, FATAL and WARN entries of the runtime and application logs`}),_jsx(_components.td,{children:`Error Type / Logger, Level, Flow, Mule Application, Environment, Correlation ID, Details`})]}),_jsxs(_components.tr,{children:[_jsxs(_components.td,{children:[_jsx(_components.strong,{children:`Java Heap Usage`}),`, `,_jsx(_components.strong,{children:`Java Heap Available`}),`, `,_jsx(_components.strong,{children:`Java Heap Space Size`}),`, `,_jsx(_components.strong,{children:`Java Heap Space Allocated`})]}),_jsx(_components.td,{children:`Heap memory of the runtime JVM`}),_jsx(_components.td,{children:`—`})]}),_jsxs(_components.tr,{children:[_jsxs(_components.td,{children:[_jsx(_components.strong,{children:`Java Non-Heap Size`}),`, `,_jsx(_components.strong,{children:`Java Non-Heap Available`})]}),_jsx(_components.td,{children:`Non-heap memory of the runtime JVM`}),_jsx(_components.td,{children:`—`})]}),_jsxs(_components.tr,{children:[_jsxs(_components.td,{children:[_jsx(_components.strong,{children:`Java Process CPU Load`}),`, `,_jsx(_components.strong,{children:`Java Thread Count`})]}),_jsx(_components.td,{children:`CPU and threads of the runtime JVM`}),_jsx(_components.td,{children:`—`})]}),_jsxs(_components.tr,{children:[_jsxs(_components.td,{children:[_jsx(_components.strong,{children:`Java Loaded Class Count`}),`, `,_jsx(_components.strong,{children:`Java Unloaded Class Count`}),`, `,_jsx(_components.strong,{children:`Java Total Loaded Class Count`})]}),_jsx(_components.td,{children:`Class loading`}),_jsx(_components.td,{children:`—`})]}),_jsxs(_components.tr,{children:[_jsxs(_components.td,{children:[_jsx(_components.strong,{children:`Java GC Count`}),`, `,_jsx(_components.strong,{children:`Java GC Time`})]}),_jsx(_components.td,{children:`Garbage collection`}),_jsx(_components.td,{children:`—`})]})]})]}),`\n`,_jsx(_components.p,{children:`Default SLA:`}),`\n`,_jsxs(Table,{children:[_jsx(_components.thead,{children:_jsxs(_components.tr,{children:[_jsx(_components.th,{children:`SLA`}),_jsx(_components.th,{children:`KPI`}),_jsx(_components.th,{children:`Severity`}),_jsx(_components.th,{children:`Breached when`})]})}),_jsx(_components.tbody,{children:_jsxs(_components.tr,{children:[_jsx(_components.td,{children:_jsx(_components.strong,{children:`Error Spike`})}),_jsx(_components.td,{children:`MuleSoft Log Event`}),_jsx(_components.td,{children:`Medium`}),_jsx(_components.td,{children:`Every 15 minutes, per error type: ERROR and FATAL entries changed by more than 200% compared with the same 15 minutes a week earlier, with at least 20 entries`})]})})]}),`\n`,_jsxs(_components.p,{children:[`For all MuleSoft KPIs, see `,_jsx(_components.a,{href:`/integrations/mulesoft-monitoring#kpis`,children:`KPIs`}),` on the MuleSoft overview.`]}),`\n`,_jsx(Heading,{level:`2`,id:`related-documentation`,children:`Related Documentation`}),`\n`,_jsxs(CardGroup,{cols:3,children:[_jsx(Card,{title:`Anypoint Platform Monitoring for MuleSoft`,icon:`cloud`,href:`/integrations/mulesoft-monitoring/mulesoft-anypoint-platform-monitoring`,children:_jsx(_components.p,{children:`Availability, metrics and cloud logs`})}),_jsx(Card,{title:`Files / Logs Observability`,icon:`file-lines`,href:`/integrations/file-log-monitoring`,children:_jsx(_components.p,{children:`How GermainUX reads log files`})}),_jsx(Card,{title:`Analytics`,icon:`chart-simple`,href:`/analytics`,children:_jsx(_components.p,{children:`More Analytics Features`})})]}),`\n`,_jsx(Heading,{level:`2`,id:`get-help`,children:`Get Help`}),`\n`,_jsxs(CardGroup,{cols:2,children:[_jsx(Card,{title:`Contact GermainUX Support`,icon:`headset`,href:`/getting-started/support`,children:_jsx(_components.p,{children:`The GermainUX team helps you get up and running faster, empower your team, turn data into actionable insights, and optimize performance to deliver measurable business outcomes.`})}),_jsx(Card,{title:`Can't Find What You Need?`,icon:`magnifying-glass`,children:_jsxs(_components.p,{children:[`Search all GermainUX docs with `,_jsx(_components.strong,{children:`Ctrl + K`}),`, or use the feedback buttons at the bottom of this page to tell us what is missing.`]})})]}),`\n`,_jsx(_MdxComponentBoundary,{name:`GxFooter`,children:_jsx(GxFooter,{})}),`\n`,_jsx(_MdxComponentBoundary,{name:`GxStyle`,children:_jsx(GxStyle,{})})]})}function MDXContent(props={}){const{wrapper:MDXLayout}={..._provideComponents(),...props.components};return MDXLayout?_jsx(MDXLayout,{...props,children:_jsx(_createMdxContent,{...props})}):_createMdxContent(props)}return{GxFooter,GxStyle,default:MDXContent};function _missingMdxReference(id,component){throw new Error(`Expected `+(component?`component`:`object`)+\" `\"+id+\"` to be defined: you likely forgot to import, pass, or provide it.\")}","frontmatter":{},"scope":{"config":{},"pageMetadata":{"title":"Runtime Monitoring for MuleSoft","sidebarTitle":"Runtime Monitoring","description":"Turn the errors in your Mule runtime logs, and the health of the runtime's JVM, into KPIs and alerts for the runtimes you host.","icon":"server","keywords":["Mule runtime","mule_ee.log","MuleSoft logs","MuleSoft log parsing","Mule error type","hybrid runtime","Mule JVM","JMX"],"href":"/integrations/mulesoft-monitoring/mulesoft-runtime-monitoring"}}},"mdxSourceWithNoJs":null,"noJsSplices":[[136,153,"Style=()=>null;const GxFooter=()=>_jsx(`"],[255,12837,""],[44579,44599,"Style,GxFooter,defau"]]},"mdxExtracts":{"tableOfContents":[{"title":"Overview","slug":"overview","depth":2,"children":[{"title":"Questions It Answers","slug":"questions-it-answers","depth":3,"children":[]},{"title":"How It Connects to Other Data","slug":"how-it-connects-to-other-data","depth":3,"children":[]},{"title":"See It on the Dashboard","slug":"see-it-on-the-dashboard","depth":3,"children":[]}]},{"title":"How It Works","slug":"how-it-works","depth":2,"children":[]},{"title":"Before You Start","slug":"before-you-start","depth":2,"children":[]},{"title":"Set It Up","slug":"set-it-up","depth":2,"children":[{"title":"Enable Log Monitoring","slug":"enable-log-monitoring","depth":3,"children":[]},{"title":"Enable JVM Monitoring (Optional)","slug":"enable-jvm-monitoring-optional","depth":3,"children":[]},{"title":"Disable Monitoring","slug":"disable-monitoring","depth":3,"children":[]}]},{"title":"Validate","slug":"validate","depth":2,"children":[]},{"title":"Troubleshooting","slug":"troubleshooting","depth":2,"children":[]},{"title":"Security and Privacy","slug":"security-and-privacy","depth":2,"children":[]},{"title":"KPIs","slug":"kpis","depth":2,"children":[]},{"title":"Related Documentation","slug":"related-documentation","depth":2,"children":[]},{"title":"Get Help","slug":"get-help","depth":2,"children":[]}],"codeExamples":{}},"jsLinks":[],"subdomain":"germain-ux","siteName":"GermainUX Docs","title":"Runtime Monitoring for MuleSoft - GermainUX Docs","navMaps":{"firstHrefInVersion":{},"firstHrefInLanguage":{}},"lastModified":"2026-11-11T13:22:57.455Z","originalFileLocation":"integrations/mulesoft-monitoring/mulesoft-runtime-monitoring.mdx"},"headHtml":"\u003cscript data-mint-head>(function(){var d=document.documentElement,p=null;if(!p){try{p=localStorage.getItem(\"isDarkMode\")}catch(e){}if(p==='true')p='dark';else if(p==='false')p='light';if(p!=='light'\u0026\u0026p!=='dark'\u0026\u0026p!=='system')p=\"light\"}var r=p==='system'?(matchMedia(\"(prefers-color-scheme: dark)\").matches?'dark':'light'):p;d.classList.remove(r==='dark'?'light':'dark');d.classList.add(r);d.setAttribute(\"data-theme-preference\",p)})();\u003c/script>\u003cmeta data-mint-head name=\"description\" content=\"Turn the errors in your Mule runtime logs, and the health of the runtime\u0026#x27;s JVM, into KPIs and alerts for the runtimes you host.\">\u003cmeta data-mint-head name=\"application-name\" content=\"GermainUX Docs\">\u003cmeta data-mint-head name=\"generator\" content=\"Mintlify\">\u003clink data-mint-head rel=\"icon\" type=\"image/png\" sizes=\"192x192\" href=\"/mintlify-assets/_mintlify/favicons/germain-ux/_Kw8Od9IpYFcCZNX/_generated/favicon/android-chrome-192x192.png\" media=\"(prefers-color-scheme: light)\">\u003clink data-mint-head rel=\"apple-touch-icon\" type=\"image/png\" sizes=\"180x180\" href=\"/mintlify-assets/_mintlify/favicons/germain-ux/_Kw8Od9IpYFcCZNX/_generated/favicon/apple-touch-icon.png\">\u003clink data-mint-head rel=\"icon\" type=\"image/png\" sizes=\"16x16\" href=\"/mintlify-assets/_mintlify/favicons/germain-ux/_Kw8Od9IpYFcCZNX/_generated/favicon/favicon-16x16.png\" media=\"(prefers-color-scheme: light)\">\u003clink data-mint-head rel=\"icon\" type=\"image/png\" sizes=\"32x32\" href=\"/mintlify-assets/_mintlify/favicons/germain-ux/_Kw8Od9IpYFcCZNX/_generated/favicon/favicon-32x32.png\" media=\"(prefers-color-scheme: light)\">\u003clink data-mint-head rel=\"shortcut icon\" type=\"image/x-icon\" href=\"/mintlify-assets/_mintlify/favicons/germain-ux/_Kw8Od9IpYFcCZNX/_generated/favicon/favicon.ico\" media=\"(prefers-color-scheme: light)\">\u003clink data-mint-head rel=\"icon\" type=\"image/png\" sizes=\"192x192\" href=\"/mintlify-assets/_mintlify/favicons/germain-ux/_Kw8Od9IpYFcCZNX/_generated/favicon-dark/android-chrome-192x192.png\" media=\"(prefers-color-scheme: dark)\">\u003clink data-mint-head rel=\"icon\" type=\"image/png\" sizes=\"16x16\" href=\"/mintlify-assets/_mintlify/favicons/germain-ux/_Kw8Od9IpYFcCZNX/_generated/favicon-dark/favicon-16x16.png\" media=\"(prefers-color-scheme: dark)\">\u003clink data-mint-head rel=\"icon\" type=\"image/png\" sizes=\"32x32\" href=\"/mintlify-assets/_mintlify/favicons/germain-ux/_Kw8Od9IpYFcCZNX/_generated/favicon-dark/favicon-32x32.png\" media=\"(prefers-color-scheme: dark)\">\u003clink data-mint-head rel=\"shortcut icon\" type=\"image/x-icon\" href=\"/mintlify-assets/_mintlify/favicons/germain-ux/_Kw8Od9IpYFcCZNX/_generated/favicon-dark/favicon.ico\" media=\"(prefers-color-scheme: dark)\">\u003cmeta data-mint-head property=\"og:title\" content=\"Runtime Monitoring for MuleSoft - GermainUX Docs\">\u003cmeta data-mint-head property=\"og:description\" content=\"Turn the errors in your Mule runtime logs, and the health of the runtime\u0026#x27;s JVM, into KPIs and alerts for the runtimes you host.\">\u003cmeta data-mint-head property=\"og:site_name\" content=\"GermainUX Docs\">\u003cmeta data-mint-head property=\"og:url\" content=\"https://docs.germainux.com/integrations/mulesoft-monitoring/mulesoft-runtime-monitoring\">\u003cmeta data-mint-head property=\"og:type\" content=\"website\">\u003cmeta data-mint-head property=\"og:image\" content=\"https://germain-ux.mintlify.site/_mintlify/api/og/v2?division=MuleSoft+Observability\u0026amp;title=Runtime+Monitoring+for+MuleSoft\u0026amp;description=Turn+the+errors+in+your+Mule+runtime+logs%2C+and+the+health+of+the+runtime%27s+JVM%2C+into+KPIs+and+alerts+for+the+runtimes+you+host.\u0026amp;theme=f29cc06a49affea3bfdf77b7\u0026amp;signature=38ff8b9c267f8f7a13b2bc682810fb2b70ed3e2d1a5ee5e20196ef931325884c\">\u003cmeta data-mint-head property=\"og:image:width\" content=\"1200\">\u003cmeta data-mint-head property=\"og:image:height\" content=\"630\">\u003cmeta data-mint-head name=\"twitter:card\" content=\"summary_large_image\">\u003cmeta data-mint-head name=\"twitter:title\" content=\"Runtime Monitoring for MuleSoft - GermainUX Docs\">\u003cmeta data-mint-head name=\"twitter:description\" content=\"Turn the errors in your Mule runtime logs, and the health of the runtime\u0026#x27;s JVM, into KPIs and alerts for the runtimes you host.\">\u003cmeta data-mint-head name=\"twitter:image\" content=\"https://germain-ux.mintlify.site/_mintlify/api/og/v2?division=MuleSoft+Observability\u0026amp;title=Runtime+Monitoring+for+MuleSoft\u0026amp;description=Turn+the+errors+in+your+Mule+runtime+logs%2C+and+the+health+of+the+runtime%27s+JVM%2C+into+KPIs+and+alerts+for+the+runtimes+you+host.\u0026amp;theme=f29cc06a49affea3bfdf77b7\u0026amp;signature=38ff8b9c267f8f7a13b2bc682810fb2b70ed3e2d1a5ee5e20196ef931325884c\">\u003cmeta data-mint-head name=\"twitter:image:width\" content=\"1200\">\u003cmeta data-mint-head name=\"twitter:image:height\" content=\"630\">\u003cmeta data-mint-head name=\"msapplication-config\" content=\"/mintlify-assets/_mintlify/favicons/germain-ux/_Kw8Od9IpYFcCZNX/_generated/favicon/browserconfig.xml\">\u003cmeta data-mint-head name=\"apple-mobile-web-app-title\" content=\"GermainUX Docs\">\u003cmeta data-mint-head name=\"msapplication-TileColor\" content=\"#2E7DF2\">\u003cmeta data-mint-head name=\"og:locale\" content=\"en_US\">\u003clink data-mint-head rel=\"canonical\" href=\"https://docs.germainux.com/integrations/mulesoft-monitoring/mulesoft-runtime-monitoring\">\u003clink data-mint-head rel=\"alternate\" type=\"application/xml\" href=\"/sitemap.xml\">\u003clink data-mint-head rel=\"alternate\" type=\"text/markdown\" href=\"/integrations/mulesoft-monitoring/mulesoft-runtime-monitoring.md\">\u003cscript data-mint-head type=\"application/ld+json\">{\"@context\":\"https://schema.org\",\"@graph\":[{\"@type\":\"Organization\",\"@id\":\"https://docs.germainux.com/#organization\",\"name\":\"GermainUX Docs\",\"url\":\"https://docs.germainux.com\",\"logo\":{\"@type\":\"ImageObject\",\"url\":\"https://mintcdn.com/germain-ux/ok7-BbqwVV0uk3t8/images/logo-light.png?fit=max\u0026auto=format\u0026n=ok7-BbqwVV0uk3t8\u0026q=85\u0026s=3cfe3238ac55802e43da3e4da5806f0d\"}},{\"@type\":\"WebSite\",\"@id\":\"https://docs.germainux.com#website\",\"name\":\"GermainUX Docs\",\"url\":\"https://docs.germainux.com\",\"publisher\":{\"@id\":\"https://docs.germainux.com/#organization\"}},{\"@type\":\"WebPage\",\"@id\":\"https://docs.germainux.com/integrations/mulesoft-monitoring/mulesoft-runtime-monitoring#webpage\",\"url\":\"https://docs.germainux.com/integrations/mulesoft-monitoring/mulesoft-runtime-monitoring\",\"name\":\"Runtime Monitoring for MuleSoft\",\"description\":\"Turn the errors in your Mule runtime logs, and the health of the runtime's JVM, into KPIs and alerts for the runtimes you host.\",\"dateModified\":\"2026-11-11T13:22:57.455Z\",\"isPartOf\":{\"@id\":\"https://docs.germainux.com#website\"},\"breadcrumb\":{\"@id\":\"https://docs.germainux.com/integrations/mulesoft-monitoring/mulesoft-runtime-monitoring#breadcrumb\"}},{\"@type\":\"BreadcrumbList\",\"@id\":\"https://docs.germainux.com/integrations/mulesoft-monitoring/mulesoft-runtime-monitoring#breadcrumb\",\"itemListElement\":[{\"@type\":\"ListItem\",\"position\":1,\"name\":\"GermainUX Documentation\",\"item\":\"https://docs.germainux.com\"},{\"@type\":\"ListItem\",\"position\":2,\"name\":\"Integrations\",\"item\":\"https://docs.germainux.com/integrations/monitoring\"},{\"@type\":\"ListItem\",\"position\":3,\"name\":\"MuleSoft Observability\",\"item\":\"https://docs.germainux.com/integrations/mulesoft-monitoring\"},{\"@type\":\"ListItem\",\"position\":4,\"name\":\"Runtime Monitoring for MuleSoft\",\"item\":\"https://docs.germainux.com/integrations/mulesoft-monitoring/mulesoft-runtime-monitoring\"}]},{\"@type\":[\"Article\",\"TechArticle\"],\"@id\":\"https://docs.germainux.com/integrations/mulesoft-monitoring/mulesoft-runtime-monitoring#article\",\"headline\":\"Runtime Monitoring for MuleSoft\",\"name\":\"Runtime Monitoring for MuleSoft\",\"description\":\"Turn the errors in your Mule runtime logs, and the health of the runtime's JVM, into KPIs and alerts for the runtimes you host.\",\"url\":\"https://docs.germainux.com/integrations/mulesoft-monitoring/mulesoft-runtime-monitoring\",\"mainEntityOfPage\":{\"@id\":\"https://docs.germainux.com/integrations/mulesoft-monitoring/mulesoft-runtime-monitoring#webpage\"},\"dateModified\":\"2026-11-11T13:22:57.455Z\",\"keywords\":\"Mule runtime, mule_ee.log, MuleSoft logs, MuleSoft log parsing, Mule error type, hybrid runtime, Mule JVM, JMX\",\"publisher\":{\"@id\":\"https://docs.germainux.com/#organization\"},\"isPartOf\":{\"@id\":\"https://docs.germainux.com#website\"}}]}\u003c/script>\u003cscript data-mint-head type=\"application/ld+json\">{\"@context\":\"https://schema.org\",\"@type\":\"WebSite\",\"name\":\"GermainUX Docs\",\"publisher\":{\"@type\":\"Organization\",\"name\":\"GermainUX Docs\"},\"provider\":{\"@type\":\"Organization\",\"name\":\"Mintlify\",\"url\":\"https://mintlify.com\"}}\u003c/script>","agentPointerHref":"/integrations/mulesoft-monitoring/mulesoft-runtime-monitoring.md","siteName":"GermainUX Docs","nav":{"global":null,"tabs":[{"tab":"Documentation","groups":[{"group":"GermainUX Documentation","pages":[{"title":"GermainUX Documentation","sidebarTitle":"Overview","icon":"book-open","href":""},{"group":"Getting Started","pages":[{"title":"GermainUX Overview","sidebarTitle":"At a Glance","icon":"flag","href":"/getting-started/germain-ux-getting-started"},{"title":"Overview \u0026 Key Benefits","sidebarTitle":"Overview \u0026 Key Benefits","icon":"lightbulb","href":"/getting-started/key-benefits-features"},{"title":"How GermainUX Works","sidebarTitle":"How GermainUX Works","icon":"diagram-project","href":"/getting-started/strategy-architecture"},{"title":"GermainUX Components","sidebarTitle":"Components","icon":"lightbulb","href":"/getting-started/components"},{"title":"Concepts \u0026 Terminologies","sidebarTitle":"Concepts \u0026 Terminologies","href":"/getting-started/concepts-terminologies"},{"title":"Sizing and Deployment Impact Analysis","sidebarTitle":"Sizing and Deployment Impact Analysis","href":"/getting-started/impact-analysis"},{"title":"Support and Contact","sidebarTitle":"Support and Contact","icon":"headset","href":"/getting-started/support"}]},{"group":"Deploy GermainUX","icon":"rocket","pages":[{"title":"Deploy GermainUX","sidebarTitle":"Overview","icon":"rocket","href":"/deploy/install-on-premise-or-cloud"},{"group":"GermainUX Agent","pages":[{"title":"GermainUX Agent","sidebarTitle":"Overview","icon":"lightbulb","href":"/deploy/germainux-agent/index"},{"title":"Setup \u0026 Configuration","sidebarTitle":"Setup \u0026 Configuration","icon":"rocket","href":"/deploy/germainux-agent/setup-configuration"},{"title":"Agent Installation","sidebarTitle":"Agent Installation","icon":"rocket","href":"/deploy/germainux-agent/agent-installation"},{"title":"Agent Settings(Registry)","sidebarTitle":"Agent Settings(Registry)","href":"/deploy/germainux-agent/agent-settings-registry"},{"title":"Monitoring Config Reference","sidebarTitle":"Monitoring Config Reference","icon":"lightbulb","href":"/deploy/germainux-agent/monitoring-config-reference"}]},{"title":"GermainUX Enterprise On Cloud","sidebarTitle":"GermainUX-Enterprise - On Cloud","icon":"lightbulb","href":"/deploy/deployment-on-our-cloud"},{"group":"GermainUX Enterprise On Premise","pages":[{"title":"GermainUX Enterprise On Premise","sidebarTitle":"Overview","icon":"lightbulb","href":"/deploy/deployment-on-premise/index"},{"group":"Requirements","pages":[{"title":"Requirements","sidebarTitle":"Overview","icon":"book","href":"/deploy/deployment-on-premise/requirements"},{"title":"Hardware Requirements","sidebarTitle":"Hardware Requirements","icon":"book","href":"/deploy/deployment-on-premise/hardware-requirements"},{"title":"Network Requirements","sidebarTitle":"Network Requirements","href":"/deploy/deployment-on-premise/network-requirements"},{"title":"Software Requirements","sidebarTitle":"Software Requirements","href":"/deploy/deployment-on-premise/software-requirements"},{"group":"Storage Requirements","pages":[{"title":"Storage Requirements","sidebarTitle":"Overview","icon":"book","href":"/deploy/deployment-on-premise/storage-requirements"},{"title":"Datastore Recommendation and Benchmark","sidebarTitle":"Datastore Recommendation and Benchmark","icon":"lightbulb","href":"/deploy/deployment-on-premise/datastore-which-to-choose"}]}]},{"title":"Package and License","sidebarTitle":"Package and License","icon":"lightbulb","href":"/deploy/deployment-on-premise/prerequisites"},{"group":"Installation","pages":[{"title":"Installation","sidebarTitle":"Overview","icon":"rocket","href":"/deploy/deployment-on-premise/installation"},{"title":"Quick Start Setup","sidebarTitle":"Quick Start Setup","icon":"rocket","href":"/deploy/deployment-on-premise/quick-start-setup"},{"group":"GermainUX Datastore","pages":[{"title":"GermainUX Datastore","sidebarTitle":"Overview","icon":"lightbulb","href":"/deploy/deployment-on-premise/germain-ux-datastore"},{"group":"Elasticsearch On Premise (Preferred)","pages":[{"title":"Elasticsearch On Premise (Preferred)","sidebarTitle":"Overview","icon":"lightbulb","href":"/deploy/deployment-on-premise/elasticsearch-database-preferred"},{"title":"Secure Elasticsearch and Kibana","sidebarTitle":"Secure Elasticsearch and Kibana","icon":"lightbulb","href":"/deploy/deployment-on-premise/securing-elastic-search-and-kibana"}]},{"title":"Elasticsearch On Cloud","sidebarTitle":"Elasticsearch - On Cloud","icon":"lightbulb","href":"/deploy/deployment-on-premise/elasticsearch-saas"},{"title":"MySQL Database Setup","sidebarTitle":"MySQL Database Setup","icon":"rocket","href":"/deploy/deployment-on-premise/mysql-database"},{"group":"Oracle Database Setup","pages":[{"title":"Oracle Database Setup","sidebarTitle":"Overview","icon":"rocket","href":"/deploy/deployment-on-premise/oracle-database"},{"title":"Oracle Database Troubleshooting","sidebarTitle":"Troubleshooting","icon":"wrench","href":"/deploy/deployment-on-premise/oracle-database-troubleshooting"}]},{"title":"PostgreSQL Database Setup","sidebarTitle":"PostgreSQL Database Setup","icon":"rocket","href":"/deploy/deployment-on-premise/postgresql-database"},{"title":"Other Databases","sidebarTitle":"Other Databases","icon":"lightbulb","href":"/deploy/deployment-on-premise/other-databases"}]},{"group":"GermainUX Enterprise (on Tomcat)","pages":[{"title":"GermainUX Enterprise (on Tomcat)","sidebarTitle":"Overview","icon":"lightbulb","href":"/deploy/deployment-on-premise/germain-ux-enterprise-on-tomcat"},{"group":"Apache ActiveMQ Setup","pages":[{"title":"Apache ActiveMQ Setup","sidebarTitle":"Overview","icon":"rocket","href":"/deploy/deployment-on-premise/apache-activemq-setup"},{"title":"Apache ActiveMQ Troubleshooting","sidebarTitle":"Apache ActiveMQ Troubleshooting","icon":"wrench","href":"/deploy/deployment-on-premise/apache-activemq-troubleshooting"}]},{"title":"Apache Kafka Setup","sidebarTitle":"Apache Kafka Setup","icon":"rocket","href":"/deploy/deployment-on-premise/apache-kafka-setup"},{"title":"Hazelcast Setup","sidebarTitle":"Hazelcast Setup","href":"/deploy/deployment-on-premise/hazelcast-setup"},{"title":"ZooKeeper Setup","sidebarTitle":"ZooKeeper Setup","href":"/deploy/deployment-on-premise/zookeeper-setup"},{"title":"GermainUX Services","sidebarTitle":"GermainUX Services","icon":"lightbulb","href":"/deploy/deployment-on-premise/germain-ux-services"},{"title":"GermainUX Init Configuration","sidebarTitle":"GermainUX Init Configuration","icon":"lightbulb","href":"/deploy/deployment-on-premise/germain-ux-init-configuration"},{"title":"GermainUX Enterprise Troubleshooting","sidebarTitle":"Troubleshooting","icon":"wrench","href":"/deploy/deployment-on-premise/germain-enterprise-troubleshooting"}]},{"title":"Kubernetes Setup","sidebarTitle":"Kubernetes Setup","icon":"rocket","href":"/deploy/deployment-on-premise/kubernetes-setup"},{"title":"OpenShift Setup","sidebarTitle":"OpenShift Setup","href":"/deploy/deployment-on-premise/openshift-setup"},{"title":"Validate Customizations","sidebarTitle":"Validate Customizations","icon":"lightbulb","href":"/deploy/deployment-on-premise/customizations"},{"title":"Sentinel: GermainUX Self-Monitoring","sidebarTitle":"Sentinel: GermainUX Self-Monitoring","icon":"lightbulb","href":"/deploy/deployment-on-premise/sentinel"}]}]},{"group":"GermainUX Engine","pages":[{"title":"GermainUX Engine","sidebarTitle":"Overview","icon":"lightbulb","href":"/deploy/germain-ux-engine/index"},{"group":"Engine Deployment","pages":[{"title":"Engine Deployment","sidebarTitle":"Overview","icon":"rocket","href":"/deploy/germain-ux-engine/engine-deployment"},{"title":"Deploy at Scale","sidebarTitle":"Deploy at Scale","icon":"rocket","href":"/deploy/germain-ux-engine/deploy-at-scale-using-profiles"}]},{"group":"Engine Configuration","pages":[{"title":"Engine Configuration","sidebarTitle":"Overview","icon":"lightbulb","href":"/deploy/germain-ux-engine/engine-configuration"},{"title":"Engine Memory Configuration","sidebarTitle":"Engine Memory Configuration","icon":"lightbulb","href":"/deploy/germain-ux-engine/engine-memory-configuration"},{"title":"Engine Proxy Configuration","sidebarTitle":"Engine Proxy Configuration","icon":"lightbulb","href":"/deploy/germain-ux-engine/engine-proxy-configuration"}]}]},{"title":"GermainUX Mobile App","sidebarTitle":"GermainUX-Mobile App","icon":"lightbulb","href":"/deploy/germain-ux-mobile-app"},{"title":"GermainUX Code Profiler","sidebarTitle":"GermainUX-Code Profiler","icon":"lightbulb","href":"/deploy/germain-ux-code-profiler"},{"title":"GermainUX JS Profiler","sidebarTitle":"GermainUX-JS Profiler","icon":"lightbulb","href":"/deploy/germain-ux-js-profiler"},{"title":"GermainUX RPA Bot Recorder","sidebarTitle":"GermainUX-RPA Bot Recorder","icon":"lightbulb","href":"/deploy/germain-ux-rpa-bot-recorder"},{"title":"GermainUX RUM Extension","sidebarTitle":"GermainUX-RUM Extension","icon":"lightbulb","href":"/deploy/germain-ux-rum-extension"},{"group":"GermainUX RUM JS","pages":[{"title":"GermainUX RUM JS","sidebarTitle":"Overview","icon":"lightbulb","href":"/deploy/germain-ux-rum-js/index"},{"title":"Deploy RUM JS (Google Tag Manager)","sidebarTitle":"Deploy RUM JS (Google Tag Manager)","icon":"rocket","href":"/deploy/germain-ux-rum-js/deploy-rum-js-google-tag-manager"}]},{"title":"GermainUX RUM Windows","sidebarTitle":"GermainUX-RUM Windows","icon":"lightbulb","href":"/deploy/germainux-rum-windows"}]},{"group":"Analytics","icon":"chart-simple","pages":[{"title":"Analytics","sidebarTitle":"Overview","icon":"chart-simple","href":"/analytics/index"},{"title":"Adoption Insights","sidebarTitle":"Adoption Insights","icon":"lightbulb","href":"/analytics/adoption-insights"},{"group":"AI Insights \u0026 Recommendations","pages":[{"title":"AI Insights \u0026 Recommendations","sidebarTitle":"Overview","icon":"lightbulb","href":"/analytics/ai-driven-insights/index"},{"title":"Configure AI Services \u0026 Prompts","sidebarTitle":"Configure AI Services \u0026 Prompts","icon":"list-check","href":"/analytics/ai-driven-insights/configure-ai-services-prompts"}]},{"title":"Averages vs Percentiles","sidebarTitle":"Averages vs Percentiles","icon":"lightbulb","href":"/analytics/averages-vs-percentiles"},{"title":"Impact at Scale for Any Issue","sidebarTitle":"Impact at Scale for Any Issue","icon":"lightbulb","href":"/analytics/business-impact-at-scale-for-any-issue"},{"title":"Behavior Analysis","sidebarTitle":"Behavior Analysis","icon":"lightbulb","href":"/analytics/behavior-analysis"},{"group":"Business Process and Workflow Mining","pages":[{"title":"Business Process and Workflow Mining","sidebarTitle":"Overview","icon":"lightbulb","href":"/analytics/business-process-workflow-monitoring/index"},{"title":"Configure a Business Process or Workflow","sidebarTitle":"Configure a Business Process or Workflow","icon":"list-check","href":"/analytics/business-process-workflow-monitoring/configure-a-business-process"}]},{"group":"Campaign","pages":[{"title":"Campaign","sidebarTitle":"Overview","icon":"lightbulb","href":"/analytics/marketing-campaign-monitoring/index"},{"title":"Configure Campaign Monitoring","sidebarTitle":"Configure Campaign Monitoring","icon":"list-check","href":"/analytics/marketing-campaign-monitoring/configure-campaign-monitoring"}]},{"group":"Categorization","pages":[{"title":"Categorization","sidebarTitle":"Overview","icon":"lightbulb","href":"/analytics/data-categorization/index"},{"title":"Configure Categorization","sidebarTitle":"Configure Categorization","icon":"list-check","href":"/analytics/data-categorization/configure-categorization"}]},{"title":"Code Profiling","sidebarTitle":"Code Profiling","icon":"lightbulb","href":"/analytics/code-profiling"},{"title":"Chat Analysis","sidebarTitle":"Chat Analysis","icon":"lightbulb","href":"/analytics/conversation-analysis"},{"title":"Conversion Insights","sidebarTitle":"Conversion Insights","icon":"lightbulb","href":"/analytics/conversion-analysis"},{"title":"Document Audit","sidebarTitle":"Document Audit","icon":"lightbulb","href":"/analytics/document-audit"},{"title":"Drop-Offs","sidebarTitle":"Drop-Offs","icon":"lightbulb","href":"/analytics/drop-offs"},{"group":"Error Analysis","pages":[{"title":"Error Analysis","sidebarTitle":"Overview","icon":"lightbulb","href":"/analytics/errors-analysis-ai-powered/index"},{"title":"Configure User Error Monitoring","sidebarTitle":"Configure User Error Monitoring","icon":"list-check","href":"/analytics/errors-analysis-ai-powered/configure-user-error-monitoring"}]},{"title":"Heatmaps","sidebarTitle":"Heatmaps","icon":"lightbulb","href":"/analytics/heatmaps"},{"title":"Insights (Automate Your Own)","sidebarTitle":"Insights (Automate Your Own)","icon":"lightbulb","href":"/analytics/custom-insights"},{"title":"Insights (Automated \u0026 Preconfigured)","sidebarTitle":"Insights (Automated \u0026 Preconfigured)","icon":"lightbulb","href":"/analytics/insights-to-boost-ux"},{"title":"Journey","sidebarTitle":"Journey","icon":"lightbulb","href":"/analytics/customer-journey"},{"group":"KPIs, Pivots \u0026 Measures","pages":[{"title":"AI KPIs, Pivots, Measures","sidebarTitle":"AI KPIs, Pivots, Measures","icon":"brain","href":"/analytics/kpis/ai-kpis-pivots-measures"},{"title":"KPIs, Pivots \u0026 Measures","sidebarTitle":"Overview","icon":"gauge","href":"/analytics/kpis/index"},{"title":"Business Process/Workflow KPIs, Pivots \u0026 Measures","sidebarTitle":"Business Process/Workflow KPIs, Pivots \u0026 Measures","icon":"gauge","href":"/analytics/kpis/kpis-business-process"},{"title":"Marketing KPIs, Pivots \u0026 Measures","sidebarTitle":"Marketing KPIs, Pivots \u0026 Measures","icon":"gauge","href":"/analytics/kpis/marketing-kpis-pivots-measures"},{"title":"Technologies KPIs, Pivots \u0026 Measures","sidebarTitle":"Technologies KPIs, Pivots \u0026 Measures","href":"/analytics/kpis/kpis-technologies-availability-performance-mobile"},{"title":"User Experience KPIs, Pivots \u0026 Measures","sidebarTitle":"User Experience KPIs, Pivots \u0026 Measures","href":"/analytics/kpis/kpis-user-monitoring-and-replay"},{"title":"Web Analytics KPIs, Pivots \u0026 Measures","sidebarTitle":"Web Analytics KPIs, Pivots \u0026 Measures","icon":"gauge","href":"/analytics/kpis/kpis-web-analytics"},{"title":"Display Name for KPIs, Pivots \u0026 Measures","sidebarTitle":"Display Name for KPIs, Pivots \u0026 Measures","icon":"gauge","href":"/analytics/kpis/display-name-for-kpi-field"},{"title":"KPI Relationships","sidebarTitle":"KPI Relationships","icon":"gauge","href":"/analytics/kpis/kpi-relationships"}]},{"title":"Outlier and Anomaly Detection","sidebarTitle":"Outlier and Anomaly Detection","icon":"lightbulb","href":"/analytics/outlier-detection"},{"title":"Preconfigured Analytics by Technology","sidebarTitle":"Preconfigured Analytics by Technology","href":"/analytics/plugins-that-use-these-analytics-features"},{"group":"Rules: Advanced Automated Analytics","pages":[{"title":"Rules: Advanced Automated Analytics","sidebarTitle":"Overview","icon":"lightbulb","href":"/analytics/rules-advanced-automated-analytics/index"},{"title":"Configure a Rule for Advanced Analytics","sidebarTitle":"Configure a Rule for Advanced Analytics","icon":"list-check","href":"/analytics/rules-advanced-automated-analytics/configure-a-rule-for-advanced-analytics"}]},{"title":"Sentiment Analysis","sidebarTitle":"Sentiment Analysis","icon":"lightbulb","href":"/analytics/sentiment-analysis-ai-driven"},{"group":"SLAs","pages":[{"title":"SLAs","sidebarTitle":"Overview","icon":"lightbulb","href":"/analytics/slas/index"},{"title":"Configure SLA","sidebarTitle":"Configure SLA","icon":"list-check","href":"/analytics/slas/configure-sla"}]},{"title":"SQL Query","sidebarTitle":"SQL Query","icon":"lightbulb","href":"/analytics/query-monitoring"},{"title":"Story Beat","sidebarTitle":"Story Beat","icon":"lightbulb","href":"/analytics/story-beat"},{"title":"Transaction Insights","sidebarTitle":"Transaction Insights","href":"/analytics/transaction-insights"},{"title":"User Role Lookup","sidebarTitle":"User Role Lookup","href":"/analytics/user-role-lookup"},{"group":"User Session Monitoring, Replay \u0026 6 Heatmaps","pages":[{"title":"User Session Monitoring, Replay \u0026 6 Heatmaps","sidebarTitle":"Overview","icon":"lightbulb","href":"/analytics/user-monitoring-and-replay/index"},{"title":"Deploy User Monitoring and Session Replay","sidebarTitle":"Deploy User Monitoring and Session Replay","icon":"rocket","href":"/analytics/user-monitoring-and-replay/user-monitoring-and-replay-deployment"},{"title":"Configure User Monitoring and Session Replay","sidebarTitle":"Configure User Monitoring and Session Replay","icon":"list-check","href":"/analytics/user-monitoring-and-replay/user-monitoring-and-replay-configuration"},{"group":"Session Replay Player","pages":[{"title":"Session Replay Player","sidebarTitle":"Overview","icon":"lightbulb","href":"/analytics/user-monitoring-and-replay/session-replay-player"},{"title":"Configure Session Replay Player","sidebarTitle":"Configure Session Replay Player","icon":"list-check","href":"/analytics/user-monitoring-and-replay/configure-session-replay-player"}]},{"title":"KPIs for User Monitoring and Session Replay","sidebarTitle":"KPIs for User Monitoring and Session Replay","icon":"gauge","href":"/analytics/user-monitoring-and-replay/user-monitoring-and-replay-kpis"},{"title":"APIs for User Monitoring and Session Replay","sidebarTitle":"APIs for User Monitoring and Session Replay","icon":"code","href":"/analytics/user-monitoring-and-replay/user-monitoring-and-replay-apis"}]},{"title":"Work Time Insights","sidebarTitle":"Work Time Insights","icon":"lightbulb","href":"/analytics/work-time-insights"},{"title":"Root-Cause Analysis","sidebarTitle":"Root-Cause Analysis","href":"/analytics/root-cause-analysis"}]},{"group":"Automation","icon":"robot","pages":[{"title":"Automation","sidebarTitle":"Overview","icon":"robot","href":"/automation/index"},{"group":"Automated Actions","pages":[{"title":"Automated Actions","sidebarTitle":"Overview","icon":"lightbulb","href":"/automation/automated-actions/index"},{"title":"Configure AI Services \u0026 Prompts (Automated Actions)","sidebarTitle":"Configure AI Services \u0026 Prompts (Automated Actions)","icon":"list-check","href":"/automation/automated-actions/configure-ai-services-prompts-automated-actions"},{"title":"Scheduling of an Action","sidebarTitle":"Scheduling of an Action","icon":"lightbulb","href":"/automation/automated-actions/component-scheduling"}]},{"group":"Correlation or Tracing","pages":[{"title":"Correlation or Tracing","sidebarTitle":"Overview","icon":"lightbulb","href":"/analytics/correlation-and-tracing/index"},{"title":"Exact-Match Correlation","sidebarTitle":"Exact-Match Correlation","icon":"lightbulb","href":"/analytics/correlation-and-tracing/exact-match-correlation"},{"title":"Id-Based Correlation","sidebarTitle":"Id-Based Correlation","icon":"lightbulb","href":"/analytics/correlation-and-tracing/id-based-correlation"},{"title":"Stream Correlation","sidebarTitle":"Stream Correlation","icon":"lightbulb","href":"/analytics/correlation-and-tracing/stream-correlation"}]},{"title":"File Archiving","sidebarTitle":"File Archiving","icon":"lightbulb","href":"/automation/file-archiving"},{"title":"File Deletion/Purge","sidebarTitle":"File Deletion/Purge","icon":"lightbulb","href":"/automation/automatic-delete-purge-of-files"},{"title":"File Download","sidebarTitle":"File Download","icon":"lightbulb","href":"/automation/file-download"},{"group":"HTTP and HTTPS Execution","pages":[{"title":"HTTP and HTTPS Execution","sidebarTitle":"Overview","icon":"lightbulb","href":"/automation/synthetic-http-execution/index"},{"title":".Har File (Import/Export)","sidebarTitle":".Har File (Import/Export)","icon":"lightbulb","href":"/automation/synthetic-http-execution/har-file-import-export"},{"title":"Configure Execution of Http Request","sidebarTitle":"Configure Execution of Http Request","icon":"list-check","href":"/automation/synthetic-http-execution/configure-execution-of-http-request"}]},{"title":"Log File Analysis","sidebarTitle":"Log File Analysis","icon":"file-lines","href":"/automation/log-file-analysis"},{"title":"Log Level Auto-Setting","sidebarTitle":"Log Level Auto-Setting","icon":"lightbulb","href":"/automation/log-level-auto-setting"},{"title":"Monitoring","sidebarTitle":"Monitoring","icon":"lightbulb","href":"/automation/monitoring"},{"title":"Moogsoft","sidebarTitle":"Moogsoft","icon":"lightbulb","href":"/automation/moogsoft"},{"group":"Notifications","pages":[{"title":"Notifications","sidebarTitle":"Overview","icon":"lightbulb","href":"/automation/notifications/index"},{"group":"Alert (email and sms)","pages":[{"title":"Alert (Email and Sms)","sidebarTitle":"Overview","icon":"lightbulb","href":"/automation/notifications/alert-email-and-sms"},{"title":"Create an Alert","sidebarTitle":"Create an Alert","icon":"list-check","href":"/automation/notifications/create-an-alert"}]},{"title":"Quiet Times","sidebarTitle":"Quiet Times","icon":"lightbulb","href":"/automation/notifications/quiet-times"},{"title":"Microsoft Teams Notification","sidebarTitle":"Microsoft Teams","icon":"lightbulb","href":"/automation/notifications/microsoft-teams-notification"},{"group":"Reports (Automatic, Scheduled)","pages":[{"title":"Reports (Automatic, Scheduled)","sidebarTitle":"Overview","icon":"lightbulb","href":"/automation/notifications/reporting-automatic"},{"title":"Create a Report","sidebarTitle":"Create a Report","icon":"list-check","href":"/automation/notifications/create-a-automatic-report"}]},{"title":"Slack","sidebarTitle":"Slack","icon":"lightbulb","href":"/automation/notifications/slack"},{"title":"Watch \u0026 Be Notified","sidebarTitle":"Watch \u0026 Be Notified","icon":"lightbulb","href":"/automation/notifications/watch"}]},{"title":"Plugins (That Use These Automation Features)","sidebarTitle":"Plugins (That Use These Automation Features)","href":"/automation/plugins-that-use-these-automation-features"},{"title":"Program Execution (RPA Bots)","sidebarTitle":"Program Execution (RPA Bots)","icon":"lightbulb","href":"/automation/local-program-execution"},{"group":"Rules: Advanced Automation","pages":[{"title":"Rules: Advanced Automation","sidebarTitle":"Overview","icon":"lightbulb","href":"/automation/rules/index"},{"title":"Create a Rule for Advanced Automation","sidebarTitle":"Create a Rule for Advanced Automation","icon":"list-check","href":"/automation/rules/create-a-rule-for-advanced-automation"}]},{"group":"Script Execution","pages":[{"title":"Script Execution","sidebarTitle":"Overview","icon":"lightbulb","href":"/automation/script/index"},{"title":"Configure Script Execution","sidebarTitle":"Configure Script Execution","icon":"list-check","href":"/automation/script/configure-script-execution"}]},{"title":"ServiceNow","sidebarTitle":"ServiceNow","icon":"lightbulb","href":"/automation/servicenow"},{"title":"SQL Execution","sidebarTitle":"SQL Execution","icon":"lightbulb","href":"/automation/sql-execution"},{"title":"SSH Execution","sidebarTitle":"SSH Execution","icon":"lightbulb","href":"/automation/ssh-execution"},{"group":"Synthetic/User Click Scenario","pages":[{"title":"Synthetic/User Click Scenario","sidebarTitle":"Overview","icon":"lightbulb","href":"/automation/user-click-synthetic-user-scenario/index"},{"title":"Record a Synthetic Scenario","sidebarTitle":"Record a Synthetic Scenario","icon":"list-check","href":"/automation/user-click-synthetic-user-scenario/record-a-synthetic-scenario"},{"title":"Configure a Synthetic Scenario","sidebarTitle":"Configure a Synthetic Scenario","icon":"list-check","href":"/automation/user-click-synthetic-user-scenario/configure-a-synthetic-scenario"},{"title":"Deploy Synthetic Scenario","sidebarTitle":"Deploy Synthetic Scenario","icon":"rocket","href":"/automation/user-click-synthetic-user-scenario/deploy-synthetic-scenario"},{"title":"Troubleshoot Synthetic Scenario","sidebarTitle":"Troubleshoot Synthetic Scenario","href":"/automation/user-click-synthetic-user-scenario/troubleshoot-synthetic-scenario"},{"title":"Monitor a Synthetic Scenario","sidebarTitle":"Monitor a Synthetic Scenario","icon":"list-check","href":"/automation/user-click-synthetic-user-scenario/monitor-a-synthetic-scenario"}]},{"group":"User Feedback","pages":[{"title":"User Feedback","sidebarTitle":"Overview","icon":"lightbulb","href":"/automation/user-feedback/index"},{"title":"Configure User Feedback","sidebarTitle":"Configure User Feedback","icon":"list-check","href":"/automation/user-feedback/configure-user-feedback"}]},{"title":"Web Driver Auto-Update","sidebarTitle":"Web Driver Auto-Update","icon":"lightbulb","href":"/automation/browser-auto-update"},{"title":"Website Audit and SEO","sidebarTitle":"Website Audit and SEO","icon":"lightbulb","href":"/automation/website-audit-seo"},{"title":"Website Crawler","sidebarTitle":"Website Crawler","icon":"lightbulb","href":"/automation/crawler"},{"title":"WMI Execution","sidebarTitle":"WMI Execution","icon":"lightbulb","href":"/automation/wmi-execution"}]},{"group":"Integrations","icon":"plug","pages":[{"title":"Integrations","sidebarTitle":"Overview","icon":"plug","href":"/integrations/monitoring"},{"group":".NET Operational Experience Intelligence","pages":[{"title":".NET Operational Experience Intelligence","sidebarTitle":"Overview","icon":"plug","href":"/integrations/net-monitoring/index"},{"title":"Deployment and Configuration of Monitoring and Automation for .NET Application","sidebarTitle":"Deployment and Configuration of Monitoring and Automation for .NET Application","icon":"rocket","href":"/integrations/net-monitoring/deploy-and-configure-monitoring-for-net"},{"title":"KPIs for .NET Monitoring, Automation \u0026 Session Replay","sidebarTitle":"KPIs for .NET Monitoring, Automation \u0026 Session Replay","icon":"gauge","href":"/integrations/net-monitoring/kpis-for-net-monitoring-automation-session-replay"}]},{"title":"ActiveMQ Observability","sidebarTitle":"ActiveMQ Observability","icon":"plug","href":"/integrations/apache-activemq-monitoring"},{"title":"AIX Observability","sidebarTitle":"AIX Observability","icon":"plug","href":"/integrations/aix-monitoring"},{"group":"Amazon EC2 Observability","pages":[{"title":"Amazon EC2 Observability","sidebarTitle":"Overview","icon":"plug","href":"/integrations/amazon-ec2-observability/index"},{"title":"Configure Monitoring for Amazon EC2","sidebarTitle":"Configure Monitoring for Amazon EC2","icon":"list-check","href":"/integrations/amazon-ec2-observability/amazon-ec2-monitoring-configuration"}]},{"group":"Android Application Observability","pages":[{"title":"Android Application Observability","sidebarTitle":"Overview","icon":"plug","href":"/integrations/android-application-observability/index"},{"title":"Deploy Monitoring for Android App","sidebarTitle":"Deploy Monitoring for Android App","icon":"rocket","href":"/integrations/android-application-observability/android-app-monitoring-deployment"},{"group":"Configure Monitoring for Android App","pages":[{"title":"Configure Monitoring for Android App","sidebarTitle":"Overview","icon":"list-check","href":"/integrations/android-application-observability/android-app-monitoring-configuration"},{"title":"Error and Exception Monitoring for Android App","sidebarTitle":"Error and Exception Monitoring for Android App","icon":"lightbulb","href":"/integrations/android-application-observability/android-app-error-and-exception-monitoring"},{"title":"Event Monitoring for Android App","sidebarTitle":"Event Monitoring for Android App","icon":"lightbulb","href":"/integrations/android-application-observability/android-app-event-monitoring"},{"title":"Session Monitoring for Android App","sidebarTitle":"Session Monitoring for Android App","icon":"lightbulb","href":"/integrations/android-application-observability/android-app-session-monitoring"},{"title":"Transaction Monitoring for Android App","sidebarTitle":"Transaction Monitoring for Android App","icon":"lightbulb","href":"/integrations/android-application-observability/android-app-transaction-monitoring"},{"title":"Fragment and View Monitoring for Android App","sidebarTitle":"Fragment and View Monitoring for Android App","icon":"lightbulb","href":"/integrations/android-application-observability/android-app-fragment-and-view-monitoring"}]},{"title":"KPIs for Android App Monitoring","sidebarTitle":"KPIs for Android App Monitoring","icon":"gauge","href":"/integrations/android-application-observability/android-app-monitoring-kpis"}]},{"title":"Android Device Observability","sidebarTitle":"Android Device Observability","icon":"plug","href":"/integrations/android-mobile-device-monitoring"},{"group":"Angular Operational Experience Intelligence","pages":[{"title":"Angular Operational Experience Intelligence","sidebarTitle":"Overview","icon":"plug","href":"/integrations/angular-monitoring/index"},{"title":"Deploy Monitoring for Angular","sidebarTitle":"Deploy Monitoring for Angular","icon":"rocket","href":"/integrations/angular-monitoring/deploy-monitoring-for-angular"}]},{"group":"BigCommerce Operational Experience Intelligence","pages":[{"title":"BigCommerce Operational Experience Intelligence","sidebarTitle":"Overview","icon":"plug","href":"/integrations/bigcommerce-monitoring/index"},{"title":"Deploy Monitoring for BigCommerce","sidebarTitle":"Deploy Monitoring for BigCommerce","icon":"rocket","href":"/integrations/bigcommerce-monitoring/deploy-monitoring-for-bigcommerce"}]},{"group":"BigPanda Incident Intelligence","pages":[{"title":"BigPanda Incident Intelligence","sidebarTitle":"Overview","icon":"plug","href":"/integrations/bigpanda-incident-intelligence/index"},{"title":"Deploy Incident Intelligence for BigPanda","sidebarTitle":"Deploy Incident Intelligence for BigPanda","icon":"rocket","href":"/integrations/bigpanda-incident-intelligence/deploy-incident-intelligence-for-bigpanda"}]},{"group":"Browser Observability","pages":[{"title":"Browser Observability","sidebarTitle":"Overview","icon":"plug","href":"/integrations/browser-monitoring/index"},{"title":"Deploy Monitoring of Browser","sidebarTitle":"Deploy Monitoring of Browser","href":"/integrations/browser-monitoring/deployment-for-browser-monitoring"},{"group":"Configure Monitoring of Browser","pages":[{"title":"Configure Monitoring of Browser","sidebarTitle":"Overview","icon":"list-check","href":"/integrations/browser-monitoring/configuration-for-browser-monitoring"},{"title":"Battery Level Monitoring","sidebarTitle":"Battery Level Monitoring","icon":"lightbulb","href":"/integrations/browser-monitoring/battery-level-monitoring"},{"title":"Browser Crash Monitoring","sidebarTitle":"Browser Crash Monitoring","icon":"lightbulb","href":"/integrations/browser-monitoring/browser-crash-monitoring"},{"title":"Browser Deprecated Features and Policy Violations Monitoring","sidebarTitle":"Browser Deprecated Features and Policy Violations Monitoring","icon":"lightbulb","href":"/integrations/browser-monitoring/deprecated-features-and-policy-violations-monitoring"},{"title":"Chat/CTI Monitoring","sidebarTitle":"Chat/CTI Monitoring","icon":"lightbulb","href":"/integrations/browser-monitoring/chat-cti-monitoring"},{"title":"Core Web Vitals","sidebarTitle":"Core Web Vitals","icon":"lightbulb","href":"/integrations/browser-monitoring/core-web-vitals"},{"title":"Dead, Error and Rage Click Monitoring","sidebarTitle":"Dead, Error and Rage Click Monitoring","icon":"lightbulb","href":"/integrations/browser-monitoring/dead-error-and-rage-click-monitoring"},{"title":"Element and Mark Performance Monitoring","sidebarTitle":"Element and Mark Performance Monitoring","icon":"lightbulb","href":"/integrations/browser-monitoring/element-and-mark-performance-monitoring"},{"title":"JavaScript and Page Memory Monitoring","sidebarTitle":"JavaScript and Page Memory Monitoring","icon":"lightbulb","href":"/integrations/browser-monitoring/javascript-and-page-memory-monitoring"},{"title":"JavaScript Console and Error Monitoring","sidebarTitle":"JavaScript Console and Error Monitoring","icon":"lightbulb","href":"/integrations/browser-monitoring/javascript-console-and-error-monitoring"},{"title":"JavaScript Long Task or Browser Freeze Detection Configuration","sidebarTitle":"JavaScript Long Task or Browser Freeze Detection Configuration","icon":"lightbulb","href":"/integrations/browser-monitoring/javascript-long-task-monitoring"},{"title":"Metadata Extractors","sidebarTitle":"Metadata Extractors","icon":"lightbulb","href":"/integrations/browser-monitoring/metadata-extractors"},{"title":"Network Requests Monitoring","sidebarTitle":"Network Requests Monitoring","icon":"lightbulb","href":"/integrations/browser-monitoring/network-requests-monitoring"},{"title":"Popup Dialog Monitoring","sidebarTitle":"Popup Dialog Monitoring","icon":"lightbulb","href":"/integrations/browser-monitoring/popup-dialog-monitoring"},{"title":"Server Timing Monitoring","sidebarTitle":"Server Timing Monitoring","icon":"lightbulb","href":"/integrations/browser-monitoring/server-timing-monitoring"},{"title":"Unhandled Promise Rejection Monitoring","sidebarTitle":"Unhandled Promise Rejection Monitoring","icon":"lightbulb","href":"/integrations/browser-monitoring/unhandled-promise-rejection-monitoring"},{"title":"Video Monitoring (Vimeo, ...)","sidebarTitle":"Video Monitoring (Vimeo, ...)","icon":"lightbulb","href":"/integrations/browser-monitoring/video-monitoring-vimeo"},{"title":"WebMCP Monitoring","sidebarTitle":"WebMCP Monitoring","icon":"lightbulb","href":"/integrations/browser-monitoring/webmcp-monitoring"},{"title":"WebSocket Monitoring","sidebarTitle":"WebSocket Monitoring","icon":"lightbulb","href":"/integrations/browser-monitoring/websocket-monitoring"}]},{"title":"KPIs for Browser Monitoring","sidebarTitle":"KPIs for Browser Monitoring","icon":"gauge","href":"/integrations/browser-monitoring/kpis-for-browser-monitoring"},{"title":"APIs for Browser Monitoring","sidebarTitle":"APIs for Browser Monitoring","icon":"code","href":"/integrations/browser-monitoring/apis-for-browser-monitoring"}]},{"title":"Channel Talk Observability","sidebarTitle":"Channel Talk Observability","icon":"plug","href":"/integrations/channel-talk-monitoring"},{"title":"Chatbot Observability","sidebarTitle":"Chatbot Observability","icon":"plug","href":"/integrations/chat-monitoring"},{"title":"Citrix Observability","sidebarTitle":"Citrix Observability","icon":"plug","href":"/integrations/citrix-user-monitoring"},{"title":"DB2 UDB Observability","sidebarTitle":"DB2 UDB Observability","icon":"plug","href":"/integrations/db2-udb-monitoring"},{"group":"Docker Observability","pages":[{"title":"Docker Observability","sidebarTitle":"Overview","icon":"plug","href":"/integrations/docker-monitoring/index"},{"title":"Deploy Monitoring for Docker","sidebarTitle":"Deploy Monitoring for Docker","icon":"rocket","href":"/integrations/docker-monitoring/deploy-monitoring-for-docker"}]},{"group":"Drupal Operational Experience Intelligence","pages":[{"title":"Drupal Operational Experience Intelligence","sidebarTitle":"Overview","icon":"plug","href":"/integrations/drupal-monitoring/index"},{"title":"Deploy Monitoring for Drupal","sidebarTitle":"Deploy Monitoring for Drupal","icon":"rocket","href":"/integrations/drupal-monitoring/deploy-monitoring-for-drupal"}]},{"title":"Files / Logs Observability","sidebarTitle":"Files / Logs Observability","icon":"plug","href":"/integrations/file-log-monitoring"},{"title":"Genesys Cloud Observability","sidebarTitle":"Genesys Cloud Observability","icon":"plug","href":"/integrations/genesys-cloud-desktop"},{"title":"Genesys CTI Observability","sidebarTitle":"Genesys CTI Observability","icon":"plug","href":"/integrations/genesys-monitoring"},{"group":"Go Observability","pages":[{"title":"Go Observability","sidebarTitle":"Overview","icon":"plug","href":"/integrations/golang-monitoring/index"},{"title":"Deploy Code Profiling \u0026 Usage Monitoring for GoLang","sidebarTitle":"Deploy Code Profiling \u0026 Usage Monitoring for GoLang","icon":"rocket","href":"/integrations/golang-monitoring/deploy-code-profiling-usage-monitoring-for-golang"},{"title":"Configure Analytics, Automation, Dashboard and Report for GoLang","sidebarTitle":"Configure Analytics, Automation, Dashboard and Report for GoLang","icon":"table-columns","href":"/integrations/golang-monitoring/configure-analytics-automation-dashboard-and-report-for-golang"}]},{"group":"HTML/JQuery Operational Experience Intelligence","pages":[{"title":"HTML/JQuery Operational Experience Intelligence","sidebarTitle":"Overview","icon":"plug","href":"/integrations/html-jquery-monitoring/index"},{"title":"Deploy Monitoring for HTML/JQuery","sidebarTitle":"Deploy Monitoring for HTML/JQuery","icon":"rocket","href":"/integrations/html-jquery-monitoring/deploy-monitoring-for-html-jquery"}]},{"title":"HPUX Observability","sidebarTitle":"HPUX Observability","icon":"plug","href":"/integrations/hpux-monitoring"},{"title":"IIS / Internet Information Services Observability","sidebarTitle":"IIS / Internet Information Services Observability","icon":"plug","href":"/integrations/iis-log-parsing-monitoring"},{"title":"IMAP Observability","sidebarTitle":"IMAP Observability","icon":"plug","href":"/integrations/imap-monitoring"},{"group":"Java Operational Experience Intelligence","pages":[{"title":"Java Operational Experience Intelligence","sidebarTitle":"Overview","icon":"plug","href":"/integrations/java-monitoring/index"},{"title":"Deploy Monitoring \u0026 Automation for Java with GermainUX","sidebarTitle":"Deploy Monitoring \u0026 Automation for Java with GermainUX","icon":"rocket","href":"/integrations/java-monitoring/deploy-monitoring-automation-for-java-with-germainux"},{"title":"Configuring Monitoring and Automation for Java with GermainUX","sidebarTitle":"Configuring Monitoring and Automation for Java with GermainUX","icon":"list-check","href":"/integrations/java-monitoring/configuring-monitoring-and-automation-for-java-with-germainux"}]},{"group":"JavaScript Observability","pages":[{"title":"JavaScript Observability","sidebarTitle":"Overview","icon":"plug","href":"/integrations/javascript-profiling/index"},{"title":"Deploy Monitoring for JavaScript","sidebarTitle":"Deploy Monitoring for JavaScript","icon":"rocket","href":"/integrations/javascript-profiling/deploy-monitoring-for-javascript"},{"title":"Configure Monitoring for JavaScript","sidebarTitle":"Configure Monitoring for JavaScript","icon":"list-check","href":"/integrations/javascript-profiling/configure-monitoring-for-javascript"}]},{"title":"Kafka Observability","sidebarTitle":"Kafka Observability","icon":"plug","href":"/integrations/apache-kafka-monitoring"},{"group":"Kubernetes Observability","pages":[{"title":"Kubernetes Observability","sidebarTitle":"Overview","icon":"plug","href":"/integrations/kubernetes-monitoring/index"},{"title":"Deploy Monitoring for Kubernetes","sidebarTitle":"Deploy Monitoring for Kubernetes","icon":"rocket","href":"/integrations/kubernetes-monitoring/deploy-monitoring-for-kubernetes"},{"title":"Kubernetes KPIs","sidebarTitle":"Kubernetes KPIs","icon":"gauge","href":"/integrations/kubernetes-monitoring/kubernetes-kpis"}]},{"group":"Linux (RedHat, SUSE) Observability","pages":[{"title":"Linux (RedHat, SUSE) Observability","sidebarTitle":"Overview","icon":"plug","href":"/integrations/linux-redhat-suse-monitoring/index"},{"title":"Deploying Linux Monitoring with GermainUX Engine: Local and Remote Configuration Guide","sidebarTitle":"Deploying Linux Monitoring with GermainUX Engine: Local and Remote Configuration Guide","icon":"rocket","href":"/integrations/linux-redhat-suse-monitoring/deploy-monitoring-for-linux"}]},{"group":"Magento Operational Experience Intelligence","pages":[{"title":"Magento Operational Experience Intelligence","sidebarTitle":"Overview","icon":"plug","href":"/integrations/magento-monitoring/index"},{"title":"Deploy Monitoring for Magento","sidebarTitle":"Deploy Monitoring for Magento","icon":"rocket","href":"/integrations/magento-monitoring/deploy-monitoring-for-magento"},{"title":"Configure Error Monitoring for Magento","sidebarTitle":"Configure Error Monitoring for Magento","icon":"list-check","href":"/integrations/magento-monitoring/deploy-critical-user-error-monitoring-for-magento"}]},{"group":"Marko Operational Experience Intelligence","pages":[{"title":"Marko Operational Experience Intelligence","sidebarTitle":"Overview","icon":"plug","href":"/integrations/markojs-monitoring/index"},{"title":"Deploy Monitoring for MarkoJS","sidebarTitle":"Deploy Monitoring for MarkoJS","icon":"rocket","href":"/integrations/markojs-monitoring/deploy-monitoring-for-marko"},{"title":"Configuring GermainUX Monitoring for MarkoJS Applications: Session Replay, Errors, and Performance Management","sidebarTitle":"Configuring GermainUX Monitoring for MarkoJS Applications: Session Replay, Errors, and Performance Management","icon":"list-check","href":"/integrations/markojs-monitoring/configure-monitoring-for-markojs"}]},{"title":"GermainUX MCP Server","sidebarTitle":"MCP Server","icon":"plug","href":"/integrations/mcp-server"},{"group":"Microsoft Dynamics 365 Operational Experience Intelligence","pages":[{"title":"Microsoft Dynamics 365 Operational Experience Intelligence","sidebarTitle":"Overview","icon":"plug","href":"/integrations/microsoft-dynamics-365-monitoring/index"},{"title":"Deploy Monitoring for Microsoft Dynamics 365","sidebarTitle":"Deploy Monitoring for Microsoft Dynamics 365","icon":"rocket","href":"/integrations/microsoft-dynamics-365-monitoring/deploy-monitoring-for-microsoft-dynamics-365"}]},{"group":"Microsoft Power BI Operational Experience Intelligence","pages":[{"title":"Microsoft Power BI Operational Experience Intelligence","sidebarTitle":"Overview","icon":"plug","href":"/integrations/microsoft-power-bi-monitoring/index"},{"title":"Deploying GermainUX Monitoring for Microsoft Power BI: RUM JS and Browser Extension Options","sidebarTitle":"Deploying GermainUX Monitoring for Microsoft Power BI: RUM JS and Browser Extension Options","icon":"rocket","href":"/integrations/microsoft-power-bi-monitoring/deploy-monitoring-for-microsoft-power-bi"},{"title":"Configuring GermainUX Monitoring for Microsoft Power BI: User Experience, Performance, and Error Analysis","sidebarTitle":"Configuring GermainUX Monitoring for Microsoft Power BI: User Experience, Performance, and Error Analysis","icon":"list-check","href":"/integrations/microsoft-power-bi-monitoring/configure-monitoring-for-microsoft-power-bi"}]},{"group":"Microsoft SQL Server Observability","pages":[{"title":"Microsoft SQL Server Observability","sidebarTitle":"Overview","icon":"plug","href":"/integrations/sql-server-monitoring/index"},{"title":"Deploying GermainUX Monitoring for Microsoft SQL Server: Setup, Permissions, and Configuration Steps","sidebarTitle":"Deploying GermainUX Monitoring for Microsoft SQL Server: Setup, Permissions, and Configuration Steps","icon":"rocket","href":"/integrations/sql-server-monitoring/deploy-monitoring-for-microsoft-sql-server"},{"title":"Configuring Monitoring for Microsoft SQL Server with GermainUX: Queries, KPIs, SLAs, and Alerts","sidebarTitle":"Configuring Monitoring for Microsoft SQL Server with GermainUX: Queries, KPIs, SLAs, and Alerts","icon":"gauge","href":"/integrations/sql-server-monitoring/configure-monitoring-for-microsoft-sql-server"}]},{"title":"Microsoft Teams","icon":"lightbulb","href":"/integrations/microsoft-teams-notifications"},{"group":"Mobile Operational Experience Intelligence","pages":[{"title":"Mobile Operational Experience Intelligence","sidebarTitle":"Overview","icon":"plug","href":"/integrations/mobile-monitoring/index"},{"title":"Deploying GermainUX Monitoring for Mobile Applications and Devices","sidebarTitle":"Deploying GermainUX Monitoring for Mobile Applications and Devices","icon":"rocket","href":"/integrations/mobile-monitoring/deploying-germainux-monitoring-for-mobile-applications-and-devices"},{"title":"Configuring Monitoring for Mobile Applications with GermainUX","sidebarTitle":"Configuring Monitoring for Mobile Applications with GermainUX","icon":"list-check","href":"/integrations/mobile-monitoring/configuring-monitoring-for-mobile-applications-with-germainux"}]},{"title":"Moogsoft Incident Intelligence","icon":"lightbulb","href":"/integrations/moogsoft-incident-intelligence"},{"group":"MuleSoft Observability","pages":[{"title":"MuleSoft Observability","sidebarTitle":"Overview","icon":"plug","href":"/integrations/mulesoft-monitoring/index"},{"title":"Deploy GermainUX Monitoring for MuleSoft","sidebarTitle":"Deploy Monitoring for MuleSoft","icon":"rocket","href":"/integrations/mulesoft-monitoring/deploying-germainux-monitoring-for-mulesoft-a-step-by-step-guide"},{"title":"Configure GermainUX Monitoring for MuleSoft","sidebarTitle":"Configure Monitoring for MuleSoft","icon":"gauge","href":"/integrations/mulesoft-monitoring/configure-monitoring-for-mulesoft"},{"title":"Anypoint Platform Monitoring for MuleSoft","sidebarTitle":"Anypoint Platform Monitoring","description":"See which Mule applications, replicas, servers and flows are down, and how their traffic and errors change, straight from Anypoint Platform.","icon":"cloud","href":"/integrations/mulesoft-monitoring/mulesoft-anypoint-platform-monitoring"},{"title":"Runtime Monitoring for MuleSoft","sidebarTitle":"Runtime Monitoring","icon":"server","href":"/integrations/mulesoft-monitoring/mulesoft-runtime-monitoring"}]},{"group":"MySQL Observability","pages":[{"title":"MySQL Observability","sidebarTitle":"Overview","description":"GermainUX provides real-time Observability, Performance Monitoring, Analytics, Alerting, and Automation for MySQL databases.","icon":"plug","href":"/integrations/mysql-monitoring/index"},{"title":"Deploy Monitoring for MySQL with GermainUX","sidebarTitle":"Deploy Monitoring for MySQL with GermainUX","icon":"rocket","href":"/integrations/mysql-monitoring/deploy-monitoring-for-mysql-with-germainux"},{"title":"Configuring MySQL Monitoring with GermainUX: Queries, KPIs, SLAs, and Alerts","sidebarTitle":"Configuring MySQL Monitoring with GermainUX: Queries, KPIs, SLAs, and Alerts","icon":"gauge","href":"/integrations/mysql-monitoring/configure-monitoring-for-mysql"}]},{"group":"Network Observability","pages":[{"title":"Network Observability","sidebarTitle":"Overview","icon":"plug","href":"/integrations/network-monitoring/index"},{"title":"Deploy GermainUX for Network Monitoring: Engine and User-Side Approaches","sidebarTitle":"Deploy GermainUX for Network Monitoring: Engine and User-Side Approaches","icon":"rocket","href":"/integrations/network-monitoring/deploy-monitoring-for-network"},{"title":"Configuring GermainUX Network Monitoring: Response Times, User Quality, and Alerts","sidebarTitle":"Configuring GermainUX Network Monitoring: Response Times, User Quality, and Alerts","icon":"list-check","href":"/integrations/network-monitoring/configure-monitoring-for-network"}]},{"group":"Node.js Observability","pages":[{"title":"Node.js Observability","sidebarTitle":"Overview","icon":"plug","href":"/integrations/node-js-monitoring/index"},{"title":"Deploy Monitoring for Node.js","sidebarTitle":"Deploy Monitoring for Node.js","icon":"rocket","href":"/integrations/node-js-monitoring/node-js-monitoring-deployment"},{"group":"Configure Monitoring for Node.js","pages":[{"title":"Configure Monitoring for Node.js","sidebarTitle":"Overview","icon":"list-check","href":"/integrations/node-js-monitoring/node-js-monitoring-configuration"},{"title":"Node.js Error and Exception Monitoring","sidebarTitle":"Node.js Error and Exception Monitoring","icon":"lightbulb","href":"/integrations/node-js-monitoring/node-js-error-and-exception-monitoring"},{"title":"Node.js Network Monitoring","sidebarTitle":"Node.js Network Monitoring","href":"/integrations/node-js-monitoring/node-js-network-monitoring"}]}]},{"group":"OBIEE Observability","pages":[{"title":"OBIEE Observability","sidebarTitle":"Overview","icon":"plug","href":"/integrations/obiee-monitoring/index"},{"title":"Deploying Monitoring \u0026 Automation for Oracle Business Intelligence Enterprise Edition (OBIEE)","sidebarTitle":"Deploying Monitoring \u0026 Automation for Oracle Business Intelligence Enterprise Edition (OBIEE)","icon":"rocket","href":"/integrations/obiee-monitoring/deploy-monitoring-for-obiee"},{"title":"Configuring Monitoring \u0026 Automation for OBIEE","sidebarTitle":"Configuring Monitoring \u0026 Automation for OBIEE","icon":"list-check","href":"/integrations/obiee-monitoring/configuring-monitoring-automation-for-obiee"}]},{"group":"Olark Operational Experience Intelligence","pages":[{"title":"Olark Operational Experience Intelligence","sidebarTitle":"Overview","icon":"plug","href":"/integrations/olark-monitoring/index"},{"title":"Deploying GermainUX Monitoring for Olark","sidebarTitle":"Deploying GermainUX Monitoring for Olark","icon":"rocket","href":"/integrations/olark-monitoring/deploying-germainux-monitoring-for-olark"},{"title":"Configuring Monitoring for Olark: Analyzing Chat Events, Agent Availability, and Response Times","sidebarTitle":"Configuring Monitoring for Olark: Analyzing Chat Events, Agent Availability, and Response Times","icon":"list-check","href":"/integrations/olark-monitoring/configure-monitoring-for-olark"}]},{"group":"Oracle Analytics Cloud Observability","pages":[{"title":"Oracle Analytics Cloud Observability","sidebarTitle":"Overview","icon":"plug","href":"/integrations/oracle-analytics-cloud-observability/index"},{"title":"Deploy Monitoring for Oracle Analytics Cloud","sidebarTitle":"Deploy Monitoring for Oracle Analytics Cloud","icon":"rocket","href":"/integrations/oracle-analytics-cloud-observability/deploy-monitoring-for-oracle-analytics-cloud"},{"title":"Configure Monitoring for Oracle Analytics Cloud","sidebarTitle":"Configure Monitoring for Oracle Analytics Cloud","icon":"list-check","href":"/integrations/oracle-analytics-cloud-observability/configure-monitoring-for-oracle-analytics-cloud"}]},{"group":"Oracle DB Observability","pages":[{"title":"Oracle DB Observability","sidebarTitle":"Overview","icon":"plug","href":"/integrations/oracle-db-observability/index"},{"title":"Configure Monitoring for Oracle Database","sidebarTitle":"Configure Monitoring for Oracle Database","icon":"list-check","href":"/integrations/oracle-db-observability/configure-monitoring-for-oracle-database"},{"title":"Deploying GermainUX Monitoring for Oracle Database: Steps and Configuration","sidebarTitle":"Deploying GermainUX Monitoring for Oracle Database: Steps and Configuration","icon":"rocket","href":"/integrations/oracle-db-observability/deploy-monitoring-for-oracle-database"}]},{"group":"Oracle Siebel CRM Operational Experience Intelligence","pages":[{"title":"Oracle Siebel CRM Operational Experience Intelligence","sidebarTitle":"Overview","icon":"plug","href":"/integrations/oracle-siebel-crm/index"},{"group":"Deploy Monitoring \u0026 Automation for Oracle Siebel CRM","pages":[{"title":"Deploy Monitoring \u0026 Automation for Oracle Siebel CRM","sidebarTitle":"Overview","icon":"rocket","href":"/integrations/oracle-siebel-crm/oracle-siebel-crm-monitoring-deployment"},{"title":"Engine Deployment for Oracle Siebel CRM","sidebarTitle":"Engine Deployment for Oracle Siebel CRM","icon":"rocket","href":"/integrations/oracle-siebel-crm/engine-deployment-for-oracle-siebel-crm"},{"title":"JS Profiler Deployment for Oracle Siebel CRM","sidebarTitle":"JS Profiler Deployment for Oracle Siebel CRM","icon":"rocket","href":"/integrations/oracle-siebel-crm/js-profiler-deployment-for-oracle-siebel-crm"},{"title":"RPA Bot Recorder Deployment for Oracle Siebel CRM","sidebarTitle":"RPA Bot Recorder Deployment for Oracle Siebel CRM","icon":"rocket","href":"/integrations/oracle-siebel-crm/rpa-bot-recorder-deployment-for-oracle-siebel-crm"},{"title":"RUM JS Deployment for Oracle Siebel CRM","sidebarTitle":"RUM JS Deployment for Oracle Siebel CRM","icon":"rocket","href":"/integrations/oracle-siebel-crm/deploy-rum-js-siebel-openui"}]},{"group":"Configure Monitoring \u0026 Automation for Oracle Siebel CRM","pages":[{"title":"Configure Monitoring \u0026 Automation for Oracle Siebel CRM","sidebarTitle":"Overview","icon":"list-check","href":"/integrations/oracle-siebel-crm/oracle-siebel-crm-monitoring-configuration"},{"title":"Application Monitoring for Oracle Siebel CRM (Configure)","sidebarTitle":"Application Monitoring for Oracle Siebel CRM (Configure)","icon":"list-check","href":"/integrations/oracle-siebel-crm/siebel-application-monitoring-configuration"},{"title":"Business Process Monitoring for Oracle Siebel CRM (Configure)","sidebarTitle":"Business Process Monitoring for Oracle Siebel CRM (Configure)","icon":"list-check","href":"/integrations/oracle-siebel-crm/siebel-business-process-monitoring-configuration"},{"title":"Crash Monitoring for Oracle Siebel CRM (Configure)","sidebarTitle":"Crash Monitoring for Oracle Siebel CRM (Configure)","icon":"list-check","href":"/integrations/oracle-siebel-crm/siebel-crash-monitoring-configuration"},{"title":"Error Monitoring for Oracle Siebel CRM (Configure)","sidebarTitle":"Error Monitoring for Oracle Siebel CRM (Configure)","icon":"list-check","href":"/integrations/oracle-siebel-crm/siebel-error-monitoring-configuration"},{"title":"eScript \u0026 Browser Real-Time Debugger for Oracle Siebel CRM (Configure)","sidebarTitle":"eScript \u0026 Browser Real-Time Debugger for Oracle Siebel CRM (Configure)","icon":"list-check","href":"/integrations/oracle-siebel-crm/siebel-escript-real-time-debugger-configuration"},{"title":"Outlier Detection for Oracle Siebel CRM (Configuration)","sidebarTitle":"Outlier Detection for Oracle Siebel CRM (Configuration)","icon":"list-check","href":"/integrations/oracle-siebel-crm/outlier-detection-for-oracle-siebel-crm-configuration"},{"title":"RPA Bots for Proactive Issue Detection and Resolution (Configure)","sidebarTitle":"RPA Bots for Proactive Issue Detection and Resolution (Configure)","icon":"list-check","href":"/integrations/oracle-siebel-crm/rpa-bots-for-proactive-issue-detection-and-resolution"},{"title":"Synthetic User Scenario for Oracle Siebel CRM (Recording)","sidebarTitle":"Synthetic User Scenario for Oracle Siebel CRM (Recording)","icon":"list-check","href":"/integrations/oracle-siebel-crm/synthetic-user-scenario-recording"},{"title":"User Feedback for Oracle Siebel CRM (Configure)","sidebarTitle":"User Feedback for Oracle Siebel CRM (Configure)","icon":"list-check","href":"/integrations/oracle-siebel-crm/siebel-user-feedback-configuration"},{"title":"User Monitoring and Session Replay for Oracle Siebel CRM (Configure)","sidebarTitle":"User Monitoring and Session Replay for Oracle Siebel CRM (Configure)","icon":"list-check","href":"/integrations/oracle-siebel-crm/siebel-user-monitoring-and-replay-configuration"}]},{"title":"KPIs for Oracle Siebel CRM Monitoring","sidebarTitle":"KPIs","icon":"gauge","href":"/integrations/oracle-siebel-crm/oracle-siebel-crm-monitoring-kpis"}]},{"group":"PHP Observability","pages":[{"title":"PHP Observability","sidebarTitle":"Overview","icon":"plug","href":"/integrations/php-monitoring/index"},{"title":"Deploy Monitoring for PHP","sidebarTitle":"Deploy Monitoring for PHP","icon":"rocket","href":"/integrations/php-monitoring/deploy-monitoring-for-php"},{"title":"Configure Monitoring for PHP","sidebarTitle":"Configure Monitoring for PHP","icon":"list-check","href":"/integrations/php-monitoring/configure-monitoring-for-php"}]},{"title":"Plugins (Integrate to Other Technologies)","sidebarTitle":"Plugins (Integrate to Other Technologies)","icon":"lightbulb","href":"/integrations/other-plugins"},{"group":"POP3 Mailbox Observability","pages":[{"title":"POP3 Mailbox Observability","sidebarTitle":"Overview","icon":"plug","href":"/integrations/pop3-mailbox-monitoring/index"},{"title":"Configure POP3 Mailbox","sidebarTitle":"Configure POP3 Mailbox","icon":"list-check","href":"/integrations/pop3-mailbox-monitoring/configure-pop3-mailbox"},{"title":"Deploy Monitoring for POP3 Mailbox","sidebarTitle":"Deploy Monitoring for POP3 Mailbox","icon":"rocket","href":"/integrations/pop3-mailbox-monitoring/deploy-monitoring-for-pop3-mailbox"}]},{"group":"ReactJS Operational Experience Intelligence","pages":[{"title":"ReactJS Operational Experience Intelligence","sidebarTitle":"Overview","icon":"plug","href":"/integrations/react-js-monitoring/index"},{"title":"Deploy GermainUX Monitoring for ReactJS","sidebarTitle":"Deploy Monitoring for ReactJS","icon":"rocket","href":"/integrations/react-js-monitoring/deploy-monitoring-for-reactjs"},{"title":"Configure GermainUX Monitoring for ReactJS","sidebarTitle":"Configure Monitoring for ReactJS","icon":"list-check","href":"/integrations/react-js-monitoring/configuring-germainux-monitoring-for-reactjs-applications"}]},{"group":"RingCentral Operational Experience Intelligence","pages":[{"title":"RingCentral Operational Experience Intelligence","sidebarTitle":"Overview","icon":"plug","href":"/integrations/ringcentral-monitoring/index"},{"title":"Deploy Monitoring for RingCentral","sidebarTitle":"Deploy Monitoring for RingCentral","icon":"rocket","href":"/integrations/ringcentral-monitoring/deploy-monitoring-for-ringcentral"},{"title":"Configure Monitoring for RingCentral","sidebarTitle":"Configure Monitoring for RingCentral","icon":"list-check","href":"/integrations/ringcentral-monitoring/configure-monitoring-for-ringcentral"}]},{"group":"Salesforce Experience Cloud Operational Experience Intelligence","pages":[{"title":"Salesforce Experience Cloud Operational Experience Intelligence","sidebarTitle":"Overview","icon":"plug","href":"/integrations/salesforce-experience-cloud-monitoring/index"},{"title":"Deploy Monitoring for Salesforce Experience Cloud","sidebarTitle":"Deploy Monitoring for Salesforce Experience Cloud","icon":"rocket","href":"/integrations/salesforce-experience-cloud-monitoring/deploy-monitoring-for-sfdc-experience-cloud"},{"group":"Configure Monitoring for Salesforce Experience Cloud","pages":[{"title":"Configure Monitoring for Salesforce Experience Cloud","sidebarTitle":"Overview","icon":"list-check","href":"/integrations/salesforce-experience-cloud-monitoring/configure-monitoring-for-salesforce-experience-cloud"},{"title":"User Feedback for Salesforce Experience Cloud (Configure)","sidebarTitle":"User Feedback for Salesforce Experience Cloud (Configure)","icon":"list-check","href":"/integrations/salesforce-experience-cloud-monitoring/user-feedback-for-salesforce-experience-cloud-configure"},{"title":"User Monitoring for Salesforce Experience Cloud (Configure)","sidebarTitle":"User Monitoring for Salesforce Experience Cloud (Configure)","icon":"list-check","href":"/integrations/salesforce-experience-cloud-monitoring/user-monitoring-for-salesforce-experience-cloud-configure"}]},{"title":"KPIs for Salesforce Experience Cloud Monitoring","sidebarTitle":"KPIs for Salesforce Experience Cloud Monitoring","icon":"gauge","href":"/integrations/salesforce-experience-cloud-monitoring/kpis-for-salesforce-experience-cloud-monitoring"}]},{"group":"Salesforce Operational Experience Intelligence","pages":[{"title":"Salesforce Operational Experience Intelligence","sidebarTitle":"Overview","icon":"plug","href":"/integrations/salesforce-monitoring/index"},{"title":"Deploy Monitoring for Salesforce","sidebarTitle":"Deploy Monitoring for Salesforce","icon":"rocket","href":"/integrations/salesforce-monitoring/salesforce-monitoring-deployment"},{"group":"Configure Monitoring for Salesforce","pages":[{"title":"Configure Monitoring for Salesforce","sidebarTitle":"Overview","icon":"list-check","href":"/integrations/salesforce-monitoring/salesforce-monitoring-configuration"},{"title":"Agentforce Monitoring for Salesforce","sidebarTitle":"Agentforce Monitoring for Salesforce","icon":"list-check","href":"/integrations/salesforce-monitoring/salesforce-agentforce-monitoring"},{"title":"Apex Code Monitoring for Salesforce Cloud (Configure)","sidebarTitle":"Apex Code Monitoring for Salesforce Cloud (Configure)","icon":"list-check","href":"/integrations/salesforce-monitoring/salesforce-code-monitoring"},{"title":"Apex Exception Monitoring for Salesforce Cloud (Configure)","sidebarTitle":"Apex Exception Monitoring for Salesforce Cloud (Configure)","icon":"list-check","href":"/integrations/salesforce-monitoring/apex-exception-monitoring-for-salesforce-cloud-configure"},{"title":"Audit Monitoring for Salesforce Cloud (Configuration)","sidebarTitle":"Audit Monitoring for Salesforce Cloud (Configuration)","icon":"list-check","href":"/integrations/salesforce-monitoring/salesforce-audit-monitoring"},{"title":"Debug Log Monitoring for Salesforce Cloud (Configure)","sidebarTitle":"Debug Log Monitoring for Salesforce Cloud (Configure)","icon":"list-check","href":"/integrations/salesforce-monitoring/salesforce-debug-log-monitoring"},{"title":"Error Monitoring for Salesforce Cloud (Configure)","sidebarTitle":"Error Monitoring for Salesforce Cloud (Configure)","icon":"list-check","href":"/integrations/salesforce-monitoring/error-monitoring-for-salesforce-cloud-configure"},{"title":"Instance Status Monitoring for Salesforce Cloud (Configure)","sidebarTitle":"Instance Status Monitoring for Salesforce Cloud (Configure)","icon":"list-check","href":"/integrations/salesforce-monitoring/salesforce-instance-status-monitoring"},{"title":"Log Monitoring for Salesforce Cloud (Configure)","sidebarTitle":"Log Monitoring for Salesforce Cloud (Configure)","icon":"list-check","href":"/integrations/salesforce-monitoring/salesforce-log-monitoring"},{"title":"Omni-Channel Monitoring for Salesforce Cloud (Configure)","sidebarTitle":"Omni-Channel Monitoring for Salesforce Cloud (Configure)","icon":"list-check","href":"/integrations/salesforce-monitoring/omni-channel-monitoring-for-salesforce-cloud-configure"},{"title":"Real-Time Event Monitoring for Salesforce Cloud (Configure)","sidebarTitle":"Real-Time Event Monitoring for Salesforce Cloud (Configure)","icon":"list-check","href":"/integrations/salesforce-monitoring/salesforce-real-time-event-monitoring"},{"title":"Stats Monitoring for Salesforce Cloud (Configure)","sidebarTitle":"Stats Monitoring for Salesforce Cloud (Configure)","icon":"list-check","href":"/integrations/salesforce-monitoring/salesforce-stats-monitoring"},{"title":"User Click Analysis for Salesforce Cloud (Configure)","sidebarTitle":"User Click Analysis for Salesforce Cloud (Configure)","icon":"list-check","href":"/integrations/salesforce-monitoring/salesforce-user-click-analysis"},{"title":"User Feedback for Salesforce (Configure)","sidebarTitle":"User Feedback for Salesforce (Configure)","icon":"list-check","href":"/integrations/salesforce-monitoring/user-feedback-for-salesforce-configure"},{"title":"User Monitoring and Session Replay for Salesforce Cloud (Configure)","sidebarTitle":"User Monitoring and Session Replay for Salesforce Cloud (Configure)","icon":"list-check","href":"/integrations/salesforce-monitoring/salesforce-user-monitoring-and-replay"}]},{"title":"KPIs for Salesforce Monitoring","sidebarTitle":"KPIs for Salesforce Monitoring","icon":"gauge","href":"/integrations/salesforce-monitoring/salesforce-monitoring-kpis"},{"title":"APIs for Salesforce (Classic, Lightning)","sidebarTitle":"APIs for Salesforce (Classic, Lightning)","icon":"code","href":"/integrations/salesforce-monitoring/apis-for-salesforce-classic-lightning"}]},{"group":"SAP Commerce Cloud Operational Experience Intelligence","icon":"cubes","pages":[{"title":"SAP Commerce Cloud Operational Experience Intelligence","sidebarTitle":"Overview","href":"/integrations/sap-commerce-cloud/index"},{"group":"Deploy Monitoring for SAP Commerce Cloud","pages":[{"title":"Deploy Monitoring for SAP Commerce Cloud","sidebarTitle":"Overview","href":"/integrations/sap-commerce-cloud/deploy-monitoring-for-sap"},{"title":"Engine Deployment for SAP Commerce Cloud","href":"/integrations/sap-commerce-cloud/engine-deployment-for-sap"},{"title":"JS Profiler Deployment for SAP Commerce Cloud","href":"/integrations/sap-commerce-cloud/js-profiler-deployment-for-sap"},{"title":"RPA Bot Recorder Deployment for SAP Commerce Cloud","href":"/integrations/sap-commerce-cloud/rpa-bot-recorder-deployment-for-sap"},{"title":"RUM JS Deployment for SAP Commerce Cloud","href":"/integrations/sap-commerce-cloud/rum-js-deployment-for-sap"}]},{"group":"Configure Monitoring for SAP Commerce Cloud","pages":[{"title":"Configure Monitoring for SAP Commerce Cloud","sidebarTitle":"Overview","href":"/integrations/sap-commerce-cloud/configure-monitoring-for-sap"},{"title":"Browser Real-Time Debugger for SAP Commerce Cloud (Configure)","href":"/integrations/sap-commerce-cloud/abap-browser-real-time-debugger-for-sap-configure"},{"title":"Application Monitoring for SAP Commerce Cloud (Configure)","href":"/integrations/sap-commerce-cloud/application-monitoring-for-sap-configure"},{"title":"Business Process Monitoring for SAP Commerce Cloud (Configure)","href":"/integrations/sap-commerce-cloud/business-process-monitoring-for-sap-configure"},{"title":"Crash and Diagnostic-File Monitoring for SAP Commerce Cloud (Configure)","href":"/integrations/sap-commerce-cloud/crash-monitoring-for-sap-configure"},{"title":"Error Monitoring for SAP Commerce Cloud (Configure)","href":"/integrations/sap-commerce-cloud/error-monitoring-for-sap-configure"},{"title":"Outlier Detection for SAP Commerce Cloud (Configuration)","href":"/integrations/sap-commerce-cloud/outlier-detection-for-sap-configuration"},{"title":"RPA Bots for Proactive Issue Detection and Resolution for SAP Commerce Cloud (Configure)","href":"/integrations/sap-commerce-cloud/rpa-bots-for-proactive-issue-detection-and-resolution"},{"title":"User Feedback for SAP Commerce Cloud (Configure)","href":"/integrations/sap-commerce-cloud/user-feedback-for-sap-configure"},{"title":"User Monitoring and Session Replay for SAP Commerce Cloud (Configure)","href":"/integrations/sap-commerce-cloud/user-monitoring-and-session-replay-for-sap-configure"}]},{"title":"KPIs for SAP Commerce Cloud","href":"/integrations/sap-commerce-cloud/kpis-for-sap"}]},{"group":"SAP ERP Operational Experience Intelligence","icon":"cubes","pages":[{"title":"SAP ERP Operational Experience Intelligence","sidebarTitle":"Overview","icon":"plug","href":"/integrations/sap-erp/index"}]},{"group":"Shopify Operational Experience Intelligence","pages":[{"title":"Shopify Operational Experience Intelligence","sidebarTitle":"Overview","icon":"plug","href":"/integrations/shopify/index"},{"title":"Deploy Monitoring \u0026 Automation for Shopify","sidebarTitle":"Deploy Monitoring \u0026 Automation for Shopify","icon":"rocket","href":"/integrations/shopify/deploy-monitoring-for-shopify"},{"group":"Configure Monitoring for Shopify","pages":[{"title":"Configure Monitoring for Shopify","sidebarTitle":"Overview","icon":"list-check","href":"/integrations/shopify/configure-monitoring-for-shopify"},{"title":"3rd-Party Checkouts Monitoring for Shopify (Configure)","sidebarTitle":"3rd-Party Checkouts Monitoring for Shopify (Configure)","icon":"list-check","href":"/integrations/shopify/3rd-party-checkouts-monitoring-for-shopify-configure"},{"title":"Error Monitoring for Shopify (Configure)","sidebarTitle":"Error Monitoring for Shopify (Configure)","icon":"list-check","href":"/integrations/shopify/error-monitoring-for-shopify-configure"},{"title":"Shopify Events (Configure)","sidebarTitle":"Shopify Events (Configure)","icon":"list-check","href":"/integrations/shopify/configure-shopify-events-add-to-cart-remove-from-cart"},{"title":"User Feedback for Shopify (Configure)","sidebarTitle":"User Feedback for Shopify (Configure)","icon":"list-check","href":"/integrations/shopify/user-feedback-for-shopify-configure"}]},{"title":"KPIs for Shopify Monitoring","sidebarTitle":"KPIs for Shopify Monitoring","icon":"gauge","href":"/integrations/shopify/kpis-for-shopify-monitoring"}]},{"title":"ServiceNow Incident Intelligence","icon":"lightbulb","href":"/integrations/service-now-incident-intelligence"},{"title":"SnapLogic Operational Experience Intelligence","sidebarTitle":"SnapLogic Operational Experience Intelligence","icon":"plug","href":"/integrations/snaplogic-operational-experience-intelligence"},{"title":"Slack Notifications","icon":"lightbulb","href":"/integrations/slack-notifications"},{"group":"Soap Observability","pages":[{"title":"SOAP Observability","sidebarTitle":"Overview","icon":"plug","href":"/integrations/soap-monitoring/index"},{"title":"Deploy Monitoring for SOAP","sidebarTitle":"Deploy Monitoring for SOAP","icon":"rocket","href":"/integrations/soap-monitoring/deploy-monitoring-for-soap"},{"title":"Configure Monitoring for SOAP","sidebarTitle":"Configure Monitoring for SOAP","icon":"list-check","href":"/integrations/soap-monitoring/configure-monitoring-for-soap"}]},{"group":"Solaris Observability","pages":[{"title":"Solaris Observability","sidebarTitle":"Overview","icon":"plug","href":"/integrations/solaris-monitoring/index"},{"title":"Deploy Monitoring for Solaris","sidebarTitle":"Deploy Monitoring for Solaris","icon":"rocket","href":"/integrations/solaris-monitoring/deploy-monitoring-for-solaris"},{"title":"Configure Monitoring for Solaris","sidebarTitle":"Configure Monitoring for Solaris","icon":"list-check","href":"/integrations/solaris-monitoring/configure-monitoring-for-solaris"}]},{"group":"Squarespace Operational Experience Intelligence","pages":[{"title":"Squarespace Operational Experience Intelligence","sidebarTitle":"Overview","icon":"plug","href":"/integrations/squarespace-monitoring/index"},{"title":"Deploy Monitoring for Squarespace","sidebarTitle":"Deploy Monitoring for Squarespace","icon":"rocket","href":"/integrations/squarespace-monitoring/deploy-monitoring-for-squarespace"},{"title":"Configure Monitoring for Squarespace","sidebarTitle":"Configure Monitoring for Squarespace","icon":"list-check","href":"/integrations/squarespace-monitoring/configure-monitoring-for-squarespace"}]},{"group":"Tibco Observability","pages":[{"title":"Tibco Observability","sidebarTitle":"Overview","icon":"plug","href":"/integrations/tibco-monitoring/index"},{"title":"Deploy Monitoring for TIBCO","sidebarTitle":"Deploy Monitoring for TIBCO","href":"/integrations/tibco-monitoring/deploy-monitoring-for-tibco"},{"title":"Configure Monitoring for TIBCO","sidebarTitle":"Configure Monitoring for TIBCO","icon":"list-check","href":"/integrations/tibco-monitoring/configure-monitoring-for-tibco"}]},{"group":"Tomcat Observability","pages":[{"title":"Tomcat Observability","sidebarTitle":"Overview","icon":"plug","href":"/integrations/apache-tomcat-monitoring/index"},{"title":"Deploy Monitoring for Apache Tomcat","sidebarTitle":"Deploy Monitoring for Apache Tomcat","icon":"rocket","href":"/integrations/apache-tomcat-monitoring/deploy-monitoring-for-apache-tomcat"},{"title":"Configure Monitoring for Apache Tomcat","sidebarTitle":"Configure Monitoring for Apache Tomcat","icon":"list-check","href":"/integrations/apache-tomcat-monitoring/configure-monitoring-for-apache-tomcat"}]},{"title":"Vercel (AI Chat)","icon":"plug","href":"/integrations/vercel"},{"group":"Vue.js Operational Experience Intelligence","pages":[{"title":"Vue.js Operational Experience Intelligence","sidebarTitle":"Overview","icon":"plug","href":"/integrations/vue-js-monitoring/index"},{"title":"Deploy Monitoring for VueJS","sidebarTitle":"Deploy Monitoring for VueJS","icon":"rocket","href":"/integrations/vue-js-monitoring/deploy-monitoring-for-vuejs"},{"title":"Configure Monitoring for Vue.js","sidebarTitle":"Configure Monitoring for Vue.js","icon":"list-check","href":"/integrations/vue-js-monitoring/configure-monitoring-for-vue-js"}]},{"group":"Webflow Observability","pages":[{"title":"Webflow Observability","sidebarTitle":"Overview","icon":"plug","href":"/integrations/webflow-monitoring/index"},{"title":"Deploy Monitoring for Webflow","sidebarTitle":"Deploy Monitoring for Webflow","icon":"rocket","href":"/integrations/webflow-monitoring/deploy-monitoring-for-webflow"},{"title":"Configure Monitoring for Webflow","sidebarTitle":"Configure Monitoring for Webflow","icon":"list-check","href":"/integrations/webflow-monitoring/configure-monitoring-for-webflow"}]},{"group":"WebSphere MQ Observability","pages":[{"title":"WebSphere MQ Observability","sidebarTitle":"Overview","icon":"plug","href":"/integrations/websphere-mq-monitoring/index"},{"title":"Deploy GermainUX Monitoring for IBM WebSphere MQ","sidebarTitle":"Deploy Monitoring for IBM WebSphere MQ","icon":"rocket","href":"/integrations/websphere-mq-monitoring/deploy-monitoring-for-ibm-websphere-mq"},{"title":"Configure Monitoring for IBM WebSphere MQ","sidebarTitle":"Configure Monitoring for IBM WebSphere MQ","icon":"list-check","href":"/integrations/websphere-mq-monitoring/configure-monitoring-for-ibm-websphere-mq"}]},{"group":"Windows Application Operational Experience Intelligence","pages":[{"title":"Windows Application Operational Experience Intelligence","sidebarTitle":"Overview","icon":"plug","href":"/integrations/windows-monitoring/index"},{"group":"Deploy Monitoring or Automation for Windows Application","pages":[{"title":"Deploy Monitoring or Automation for Windows Application","sidebarTitle":"Overview","icon":"rocket","href":"/integrations/windows-monitoring/deploy-monitoring-or-automation-for-windows-application"},{"title":"GermainUX Agent Installation","sidebarTitle":"GermainUX-Agent Installation","icon":"rocket","href":"/integrations/windows-monitoring/germainux-agent-installation"},{"title":"GermainUX Agent Settings (Registry)","sidebarTitle":"GermainUX-Agent Settings (Registry)","icon":"lightbulb","href":"/integrations/windows-monitoring/germainux-agent-settings-registry"}]},{"title":"Configure Monitoring or Automation for Windows Application","sidebarTitle":"Configure Monitoring or Automation for Windows Application","icon":"list-check","href":"/integrations/windows-monitoring/configure-monitoring-or-automation-for-windows-application"},{"title":"KPIs for Windows Application Monitoring, Automation \u0026 Session Replay","sidebarTitle":"KPIs for Windows Application Monitoring, Automation \u0026 Session Replay","icon":"gauge","href":"/integrations/windows-monitoring/kpis-for-windows-application-monitoring-automation-session-replay"},{"title":"GermainUX Agent Troubleshooting","sidebarTitle":"GermainUX Agent Troubleshooting","icon":"wrench","href":"/integrations/windows-monitoring/germainux-agent-troubleshooting"}]},{"group":"Wix Operational Experience Intelligence","pages":[{"title":"Wix Operational Experience Intelligence","sidebarTitle":"Overview","icon":"plug","href":"/integrations/wix-monitoring/index"},{"title":"Deploy Monitoring for Wix","sidebarTitle":"Deploy Monitoring for Wix","icon":"rocket","href":"/integrations/wix-monitoring/deploy-monitoring-for-wix"},{"title":"Configure Monitoring for Wix","sidebarTitle":"Configure Monitoring for Wix","icon":"list-check","href":"/integrations/wix-monitoring/configure-monitoring-for-wix"}]},{"group":"WooCommerce Operational Experience Intelligence","pages":[{"title":"WooCommerce Operational Experience Intelligence","sidebarTitle":"Overview","icon":"plug","href":"/integrations/woocommerce-monitoring/index"},{"title":"Deploy Monitoring for WooCommerce","sidebarTitle":"Deploy Monitoring for WooCommerce","icon":"rocket","href":"/integrations/woocommerce-monitoring/deploy-monitoring-for-woocommerce"},{"title":"Configure Monitoring for WooCommerce","sidebarTitle":"Configure Monitoring for WooCommerce","icon":"list-check","href":"/integrations/woocommerce-monitoring/configure-monitoring-for-woocommerce"}]},{"group":"WordPress Operational Experience Intelligence","pages":[{"title":"WordPress Operational Experience Intelligence","sidebarTitle":"Overview","icon":"plug","href":"/integrations/wordpress-monitoring/index"},{"title":"Deploy Monitoring for WordPress","sidebarTitle":"Deploy Monitoring for WordPress","icon":"rocket","href":"/integrations/wordpress-monitoring/deploy-monitoring-for-wordpress"},{"title":"Configure Monitoring for WordPress","sidebarTitle":"Configure Monitoring for WordPress","icon":"list-check","href":"/integrations/wordpress-monitoring/configure-monitoring-for-wordpress"}]},{"group":"Zookeeper Observability","pages":[{"title":"Zookeeper Observability","sidebarTitle":"Overview","icon":"plug","href":"/integrations/apache-zookeeper-monitoring/index"},{"title":"Deploy Monitoring for Apache ZooKeeper","sidebarTitle":"Deploy Monitoring for Apache ZooKeeper","icon":"rocket","href":"/integrations/apache-zookeeper-monitoring/deploy-monitoring-for-apache-zookeeper"},{"title":"Configure Monitoring for Apache ZooKeeper","sidebarTitle":"Configure Monitoring for Apache ZooKeeper","icon":"list-check","href":"/integrations/apache-zookeeper-monitoring/configure-monitoring-for-apache-zookeeper"}]}]},{"group":"Dashboards and Reports","icon":"table-columns","pages":[{"title":"Dashboards and Reports","sidebarTitle":"Overview","icon":"table-columns","href":"/dashboards/dashboard-and-report"},{"title":"AI Advice Dashboard","sidebarTitle":"AI Advice Dashboard","icon":"table-columns","href":"/dashboards/ai-advice-dashboard"},{"group":"Analytics Dashboard","pages":[{"title":"Analytics Dashboard","sidebarTitle":"Overview","icon":"table-columns","href":"/dashboards/analytics-dashboard/index"},{"group":"1-Aggregate Dashboard","pages":[{"title":"1-Aggregate Dashboard","sidebarTitle":"Overview","icon":"table-columns","href":"/dashboards/analytics-dashboard/1-aggregate-dashboard"},{"title":"Score Configuration (for \"Worst Instance..\")","sidebarTitle":"Score Configuration (for \"Worst Instance..\")","icon":"lightbulb","href":"/dashboards/analytics-dashboard/score-configuration-for-worst-instance"}]},{"title":"2-Pivot Dashboard","sidebarTitle":"2-Pivot Dashboard","icon":"table-columns","href":"/dashboards/analytics-dashboard/2-pivot-dashboard"},{"title":"3-Drill-Through Dashboard","sidebarTitle":"3-Drill-Through Dashboard","icon":"table-columns","href":"/dashboards/analytics-dashboard/3-drill-through-dashboard"},{"title":"4-Analysis Dashboard","sidebarTitle":"4-Analysis Dashboard","icon":"table-columns","href":"/dashboards/analytics-dashboard/4-analysis-dashboard"}]},{"title":"Configuration \u0026 Customization Dashboards","sidebarTitle":"Configuration \u0026 Customization Dashboards","icon":"table-columns","href":"/dashboards/management-dashboards"},{"title":"Frictions Dashboard","sidebarTitle":"Frictions Dashboard","icon":"table-columns","href":"/dashboards/frictions-dashboard"},{"title":"Notes and Tickets Dashboard","sidebarTitle":"Notes and Tickets Dashboard","icon":"table-columns","href":"/dashboards/note-ticket-dashboards"},{"group":"Operational Dashboard","pages":[{"title":"Operational Dashboard","sidebarTitle":"Overview","icon":"table-columns","href":"/dashboards/operational-dashboard/index"},{"title":"Adoption Tab","sidebarTitle":"Adoption Tab","icon":"table-columns","href":"/dashboards/operational-dashboard/adoption-tab"},{"title":"Conversion Tab","sidebarTitle":"Conversion Tab","icon":"table-columns","href":"/dashboards/operational-dashboard/conversion-tab"},{"title":"Productivity Tab","sidebarTitle":"Productivity Tab","icon":"table-columns","href":"/dashboards/operational-dashboard/productivity-tab"},{"title":"Experience Tab","sidebarTitle":"Experience Tab","icon":"table-columns","href":"/dashboards/operational-dashboard/experience-tab"},{"title":"Technology Health Tab","sidebarTitle":"Technology Health Tab","icon":"table-columns","href":"/dashboards/operational-dashboard/technology-health-tab"}]},{"title":"Reports (Manual)","sidebarTitle":"Reports (Manual)","icon":"lightbulb","href":"/dashboards/reports"},{"title":"Search and Filters","sidebarTitle":"Search and Filters","icon":"lightbulb","href":"/dashboards/search-and-filters"},{"title":"SLA Violation Dashboard","sidebarTitle":"SLA Violation Dashboard","icon":"gauge-high","href":"/dashboards/sla-violation-dashboard"}]},{"group":"Management","icon":"sliders","pages":[{"title":"Management","sidebarTitle":"Overview","icon":"sliders","href":"/management/index"},{"title":"AA Unit / Day","sidebarTitle":"AA Unit / Day","icon":"lightbulb","href":"/management/analytics-and-automation-unit-aa-unit"},{"title":"Access to Germain UI/Workspace","sidebarTitle":"Access to Germain UI/Workspace","icon":"lightbulb","href":"/management/request-access"},{"title":"AI Features Management","sidebarTitle":"AI Features Management","icon":"lightbulb","href":"/management/ai-settings"},{"title":"Configure GermainUX with WebMCP","sidebarTitle":"Configure with WebMCP","icon":"robot","href":"/management/configure-with-webmcp"},{"title":"Automation Management","sidebarTitle":"Automation Management","icon":"lightbulb","href":"/management/automation-management"},{"group":"Compliance, Data Privacy and Security","pages":[{"title":"Compliance, Data Privacy and Security","sidebarTitle":"Overview","icon":"lightbulb","href":"/management/compliance-privacy-and-security/index"},{"title":"AI Governance, Security, and Responsible Use","sidebarTitle":"AI Governance","icon":"scale-balanced","href":"/management/compliance-privacy-and-security/ai-governance"},{"title":"Certifications and Policies","sidebarTitle":"Certifications and Policies","icon":"lightbulb","href":"/management/compliance-privacy-and-security/compliance"},{"title":"Cookie Consent \u0026 User Privacy","sidebarTitle":"Cookie Consent \u0026 User Privacy","href":"/management/compliance-privacy-and-security/cookie-consent"},{"group":"Data Privacy","pages":[{"title":"Data Privacy","sidebarTitle":"Overview","icon":"lightbulb","href":"/management/compliance-privacy-and-security/data-privacy"},{"title":"AI Driven Detection","sidebarTitle":"AI Driven Detection","icon":"lightbulb","href":"/management/compliance-privacy-and-security/pii-detection-ai-driven"},{"title":"Exclusion Process","sidebarTitle":"Exclusion Process","icon":"lightbulb","href":"/management/compliance-privacy-and-security/exclusion-process"}]},{"title":"Data Security","sidebarTitle":"Data Security","icon":"lightbulb","href":"/management/compliance-privacy-and-security/data-security"},{"title":"Form Privacy and UX Monitoring Profile View","sidebarTitle":"Form Privacy and UX Monitoring Profile View","icon":"lightbulb","href":"/management/compliance-privacy-and-security/form-privacy-and-ux-monitoring-profile-view"}]},{"title":"Dashboard Management","sidebarTitle":"Dashboard Management","icon":"table-columns","href":"/management/dashboard-visibility-team-owners"},{"title":"Data Retention","sidebarTitle":"Data Retention","icon":"lightbulb","href":"/management/data-retention"},{"title":"Datasources","sidebarTitle":"Datasources","icon":"lightbulb","href":"/management/data-source"},{"group":"Data Warehouse","pages":[{"title":"Data Warehouse","sidebarTitle":"Overview","icon":"lightbulb","href":"/management/data-analysis/index"},{"title":"Data Model","sidebarTitle":"Data Model","icon":"lightbulb","href":"/management/data-analysis/data-model"},{"title":"Data Query API","sidebarTitle":"Data Query API","icon":"code","href":"/management/data-analysis/data-query-api"},{"title":"Data Ingestion API","sidebarTitle":"Data Ingestion API","icon":"code","href":"/management/data-analysis/data-ingestion-api"},{"title":"Dynamic Database Table Creation","sidebarTitle":"Dynamic Database Table Creation","icon":"lightbulb","href":"/management/data-analysis/dynamic-database-table-creation"},{"title":"Data Model Extensibility","sidebarTitle":"Data Model Extensibility","icon":"puzzle-piece","href":"/management/data-analysis/data-model-extensibility"}]},{"title":"Display Settings","sidebarTitle":"Display Settings","icon":"lightbulb","href":"/management/display-settings"},{"group":"Germain Health","pages":[{"title":"Germain Health","sidebarTitle":"Overview","icon":"lightbulb","href":"/management/germain-health/index"},{"title":"Disaster Recovery","sidebarTitle":"Disaster Recovery","icon":"lightbulb","href":"/management/germain-health/setting-up-disaster-recovery"},{"title":"Health Check Endpoint","sidebarTitle":"Health Check Endpoint","icon":"lightbulb","href":"/management/germain-health/health-check-endpoint"},{"title":"Prometheus Metrics","sidebarTitle":"Prometheus Metrics","href":"/management/germain-health/prometheus-metrics"}]},{"title":"KPIs Management","sidebarTitle":"KPIs Management","icon":"lightbulb","href":"/management/manage-kpis"},{"title":"License","sidebarTitle":"License","icon":"lightbulb","href":"/management/license"},{"title":"Maintenance Period","sidebarTitle":"Maintenance Period","icon":"lightbulb","href":"/management/maintenance-window"},{"title":"Monitoring Management","sidebarTitle":"Monitoring Management","href":"/management/monitoring-management"},{"title":"My Data: Save Insights for Later","sidebarTitle":"My Data: Save Insights for Later","icon":"lightbulb","href":"/management/my-data-save-this-for-later"},{"title":"MySQL Database Backup","sidebarTitle":"MySQL Database Backup","icon":"lightbulb","href":"/management/how-to-backup-mysql-databases"},{"title":"Note and Ticket Management","sidebarTitle":"Note and Ticket Management","icon":"lightbulb","href":"/management/note-ticket-management"},{"title":"Presentation Mode","sidebarTitle":"Presentation Mode","icon":"lightbulb","href":"/management/presentation-mode"},{"title":"Profiles: Monitoring and Automation Sets","sidebarTitle":"Profiles: Monitoring and Automation Sets","icon":"lightbulb","href":"/management/profiles-to-deploy-at-scale"},{"group":"Template Editor for Alerts and Reports","pages":[{"title":"Template Editor for Alerts and Reports","sidebarTitle":"Overview","icon":"lightbulb","href":"/management/templates/index"},{"title":"Edit a Template","sidebarTitle":"Edit a Template","icon":"list-check","href":"/management/templates/edit-a-template"},{"title":"Template Audit Trail","sidebarTitle":"Template Audit Trail","icon":"lightbulb","href":"/management/templates/audit-trail-of-a-template"}]},{"title":"Time Ranges","sidebarTitle":"Time Ranges","icon":"lightbulb","href":"/management/time-ranges"},{"group":"User Management","pages":[{"title":"User Management","sidebarTitle":"Overview","icon":"lightbulb","href":"/management/user-management/index"},{"group":"Users","pages":[{"title":"Users","sidebarTitle":"Overview","icon":"lightbulb","href":"/management/user-management/users"},{"title":"Database Users and Roles","sidebarTitle":"Database Users and Roles","icon":"lightbulb","href":"/management/user-management/database-user-management"},{"title":"LDAP User Management","sidebarTitle":"LDAP User Management","icon":"lightbulb","href":"/management/user-management/ldap-user-management"},{"group":"OAuth User Management","pages":[{"title":"OAuth User Management","sidebarTitle":"Overview","icon":"lightbulb","href":"/management/user-management/oauth-user-management"},{"title":"Okta User Management","sidebarTitle":"Okta User Management","icon":"lightbulb","href":"/management/user-management/okta-oauth-integration-with-germain"},{"title":"PingFederate OIDC","sidebarTitle":"PingFederate OIDC","icon":"lightbulb","href":"/management/user-management/ping-federated-oidc"},{"title":"PingID User Management","sidebarTitle":"PingID User Management","icon":"lightbulb","href":"/management/user-management/pingid"}]},{"title":"Password Reset","sidebarTitle":"Password Reset","icon":"lightbulb","href":"/management/user-management/password-reset"},{"title":"User Access Request","sidebarTitle":"User Access Request","icon":"lightbulb","href":"/management/user-management/user-access-request"},{"title":"Windows Active Directory User Management","sidebarTitle":"Windows Active Directory User Management","icon":"lightbulb","href":"/management/user-management/windows-active-directory-user-management"}]},{"title":"Roles","sidebarTitle":"Roles","icon":"lightbulb","href":"/management/user-management/users-roles"},{"title":"Teams","sidebarTitle":"Teams","icon":"lightbulb","href":"/management/user-management/teams"},{"title":"API Keys","sidebarTitle":"API Keys","icon":"code","href":"/management/user-management/api-keys"}]},{"title":"Wizard","sidebarTitle":"Wizard","icon":"lightbulb","href":"/management/wizard"},{"title":"Workspace","sidebarTitle":"Workspace","icon":"lightbulb","href":"/management/workspace"}]}]},{"group":"Editor Toolkit","icon":"toolbox","hidden":true,"pages":[{"title":"Gx brand","href":"/snippets/gx-brand"},{"title":"Template: Feature or concept page","sidebarTitle":"Feature or concept","icon":"lightbulb","href":"/templates/feature-page"},{"title":"Template: How-to or configuration guide","sidebarTitle":"How-to guide","icon":"list-check","href":"/templates/how-to-guide"},{"title":"Template: Deployment guide","sidebarTitle":"Deployment guide","icon":"rocket","href":"/templates/deployment-guide"},{"title":"Template: Integration overview","sidebarTitle":"Integration overview","icon":"plug","href":"/templates/integration-overview"},{"title":"Template: KPI reference","sidebarTitle":"KPI reference","icon":"gauge","href":"/templates/kpi-reference"},{"title":"Template: Dashboard guide","sidebarTitle":"Dashboard guide","icon":"table-columns","href":"/templates/dashboard-guide"},{"title":"Template: Release notes","sidebarTitle":"Release notes","icon":"rocket","href":"/templates/release-notes"},{"title":"Template: Section landing page","sidebarTitle":"Section landing page","icon":"folder-open","href":"/templates/section-landing"},{"title":"Template: Success story","sidebarTitle":"Success story","icon":"trophy","href":"/templates/success-story"},{"title":"Template: API reference","sidebarTitle":"API reference","icon":"code","href":"/templates/api-reference"},{"title":"Template: Reference or requirements","sidebarTitle":"Reference","icon":"book","href":"/templates/reference"},{"title":"Template: Troubleshooting guide","sidebarTitle":"Troubleshooting","icon":"wrench","href":"/templates/troubleshooting"},{"title":"Template: Release notes archive (2018 to 2022)","sidebarTitle":"Release notes archive","icon":"box-archive","href":"/templates/release-notes-archive"}]}]},{"tab":"Release Notes","pages":[{"title":"Release Notes","href":"/release-notes/overview"}]},{"tab":"Success Stories","pages":[{"title":"Success Stories","href":"/success-stories/overview"}]},{"tab":"Use Cases","pages":[{"title":"Use Cases","href":"/use-cases/overview"}]}]},"basePath":"","title":"Runtime Monitoring for MuleSoft - GermainUX Docs","buildId":"dpl_DqYu5MPb49gWBBbUGgpHQUmCHY3P","deploymentId":"dpl_DqYu5MPb49gWBBbUGgpHQUmCHY3P","dynamics":["07c022d89b","a74be98ba7"],"chunks":["Frame-u3J1-UOn.js","DynamicMarkdown-B-f2cqXQ.js","zoom-image-lightbox-DTFzvaXJ.js","lightbox-handle-r17bVUz3.js"]}