

How It Works
Before You Start
Set It Up
KPIs
Overview
GermainUX shows you which Mule applications are down or degraded in each Anypoint environment, without any change to your Mule flows. You see application, replica, server and flow availability for CloudHub 1.0, CloudHub 2.0, Runtime Fabric and hybrid runtimes, next to inbound request volume, server errors and response time from Anypoint Monitoring. Errors and warnings from your cloud applications’ logs, CloudHub alerts and Anypoint MQ queue depth arrive in the same place. Availability, traffic and error KPIs come with default SLAs, so your team hears about a crashed replica or a stopped flow before the connected applications do.Application and Replica Availability
Hybrid Servers and Stopped Flows
Requests and Response Time
Errors and Warnings from Cloud Logs
CloudHub Alerts
Anypoint MQ Queue Depth
Questions It Answers
- Which Mule applications are down right now, and in which environment?
- How many replicas of this application are running, and why did the others stop?
- Which flows stopped on our hybrid runtimes?
- Which application started returning 5xx errors, and since when?
- Did response time change after the last deployment?
- Is a queue backing up because its consumer stopped?
What Each Deployment Model Gives You
See It on the Dashboard
In the left menu, select Dashboards > All, and then open MuleSoft Overview in the MuleSoft folder under Application. The Anypoint Requests, Anypoint Server Errors, Anypoint Response Time and Anypoint Applications Down charts show the Anypoint data. Click a chart to open the KPI behind it and drill into an application, environment or check.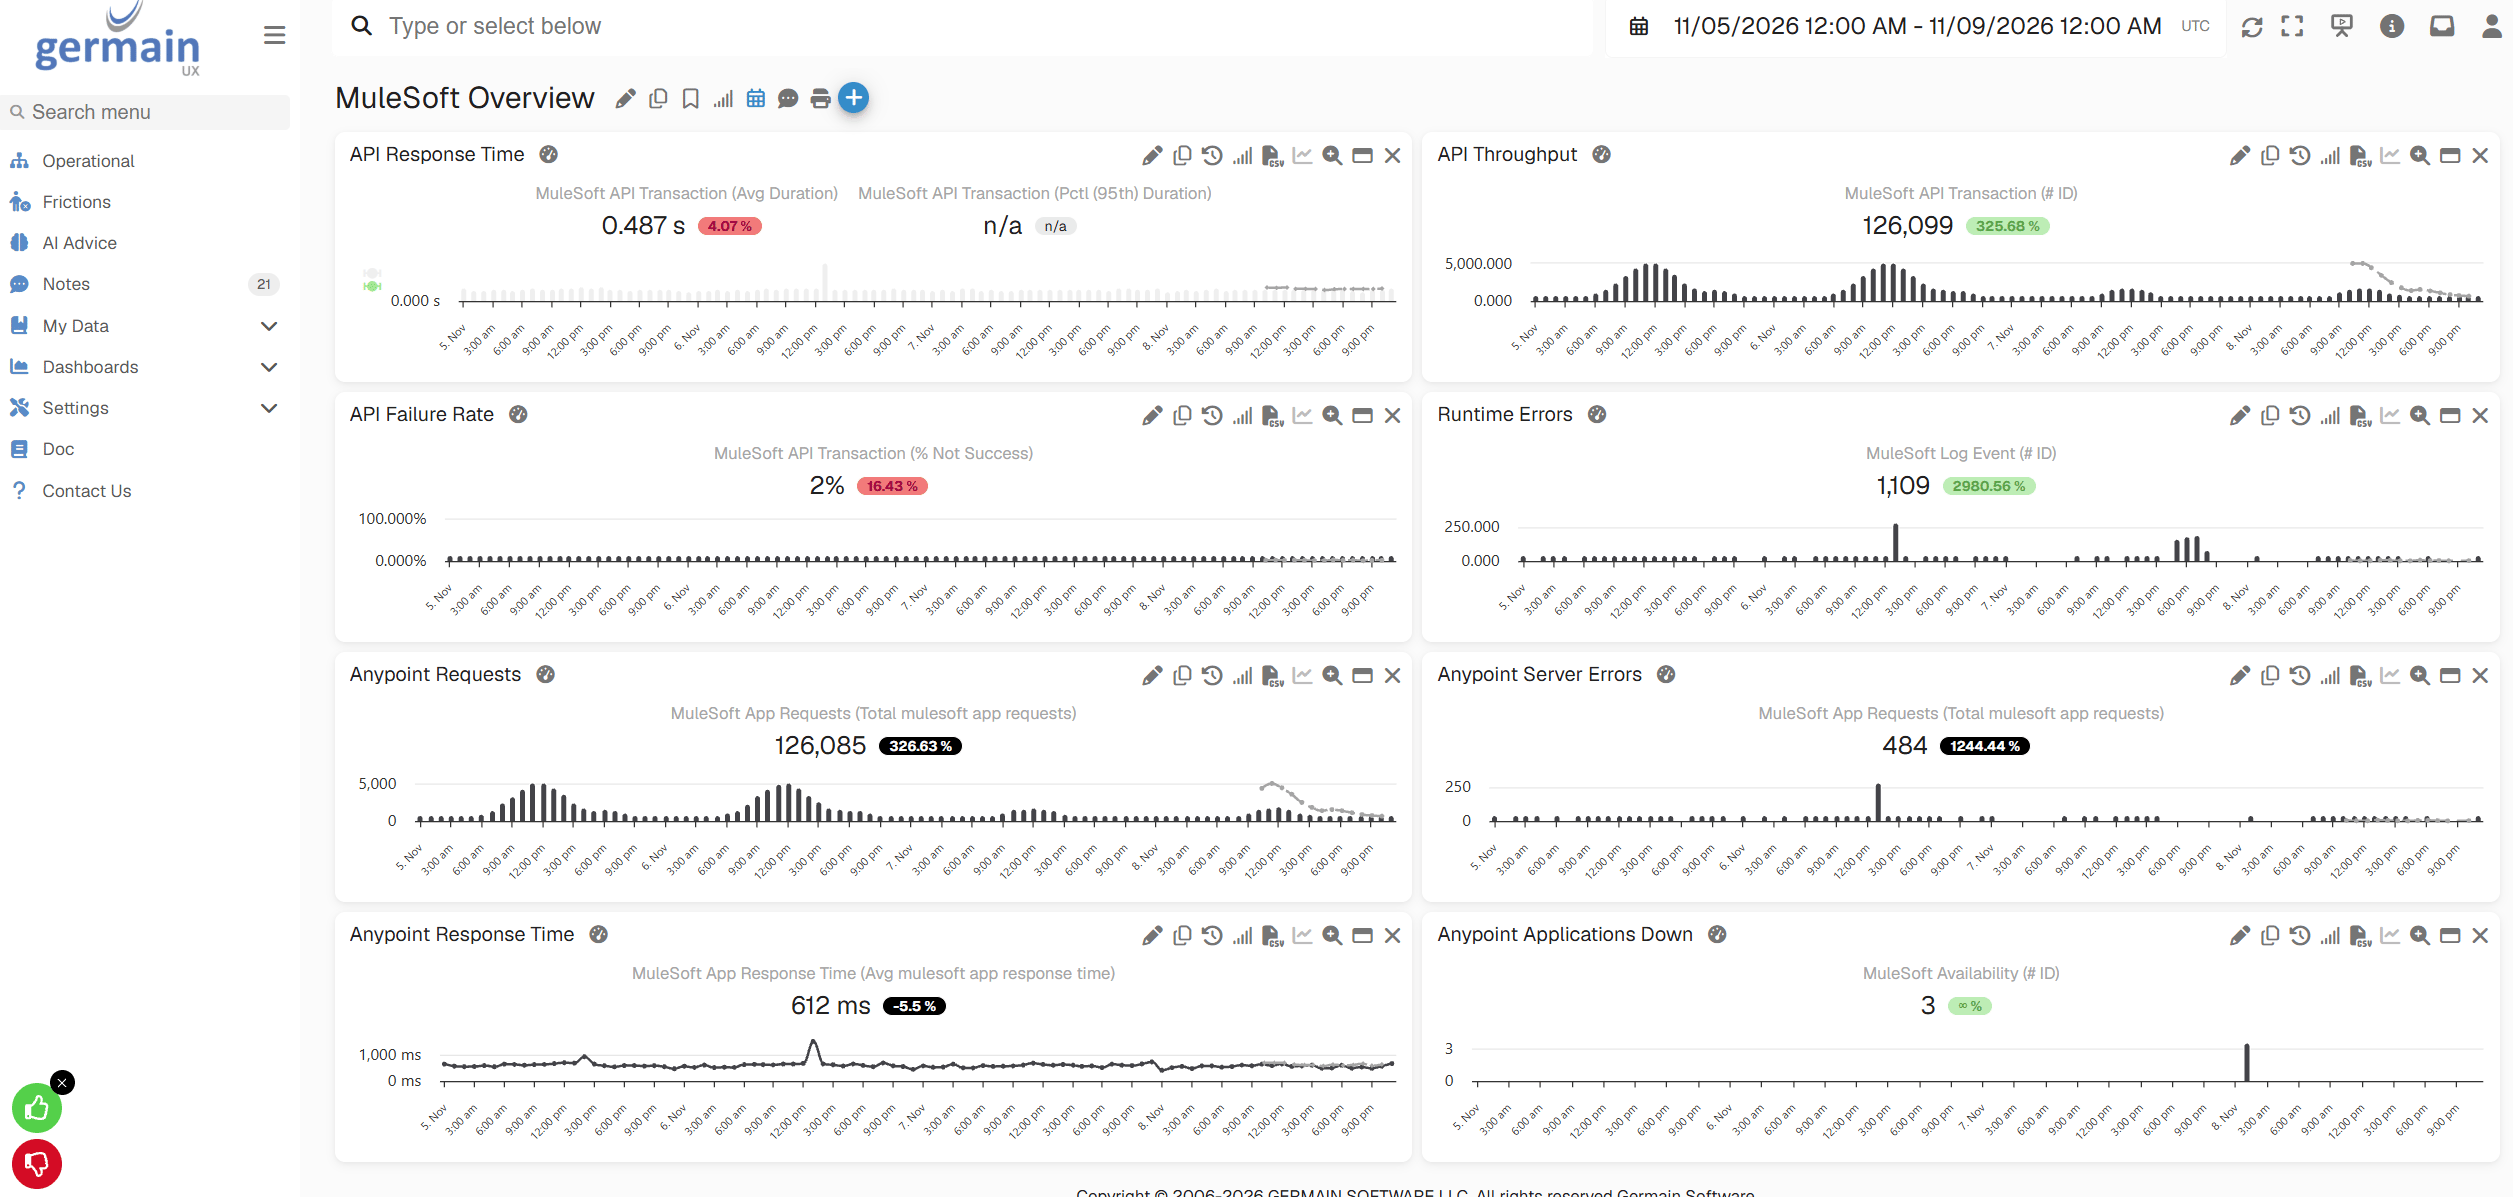
MuleSoft Overview dashboard - GermainUX
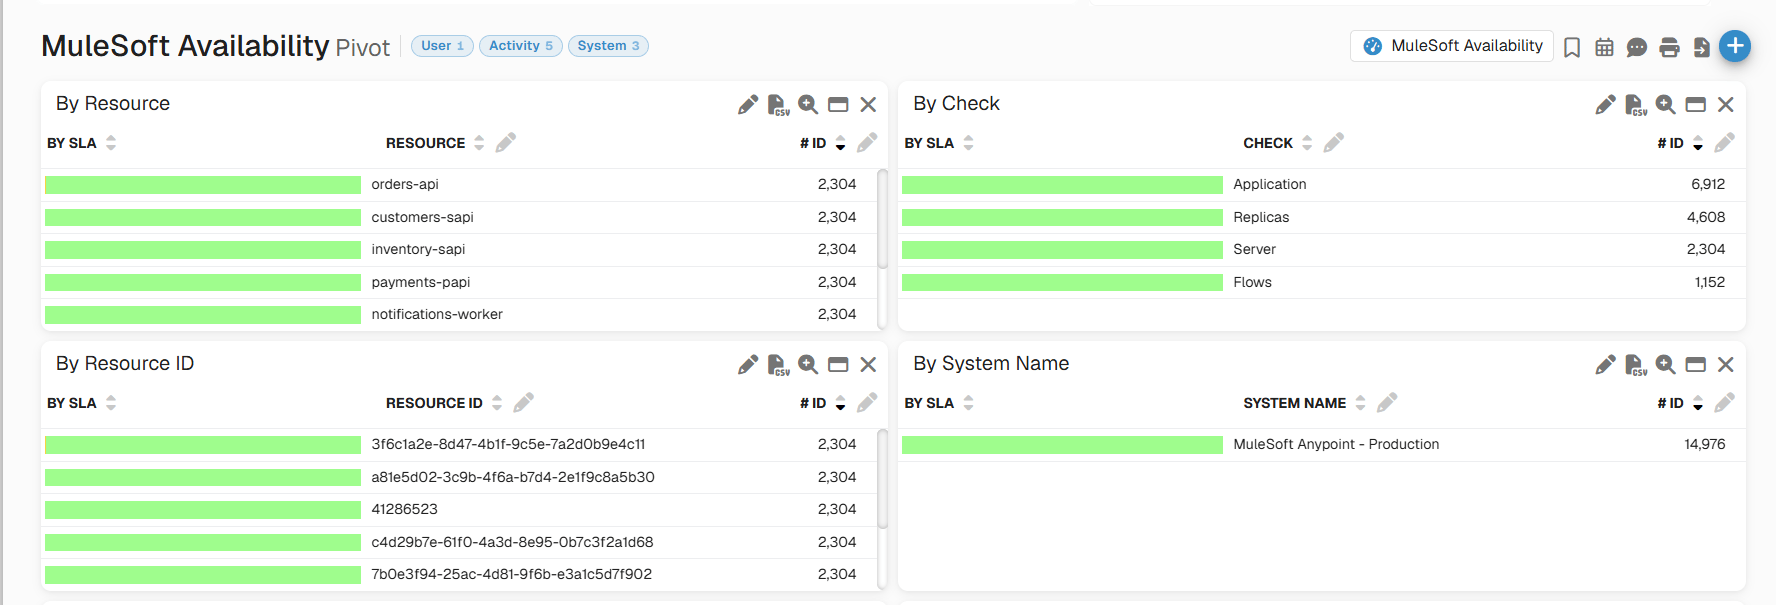
MuleSoft Availability by resource and check - GermainUX
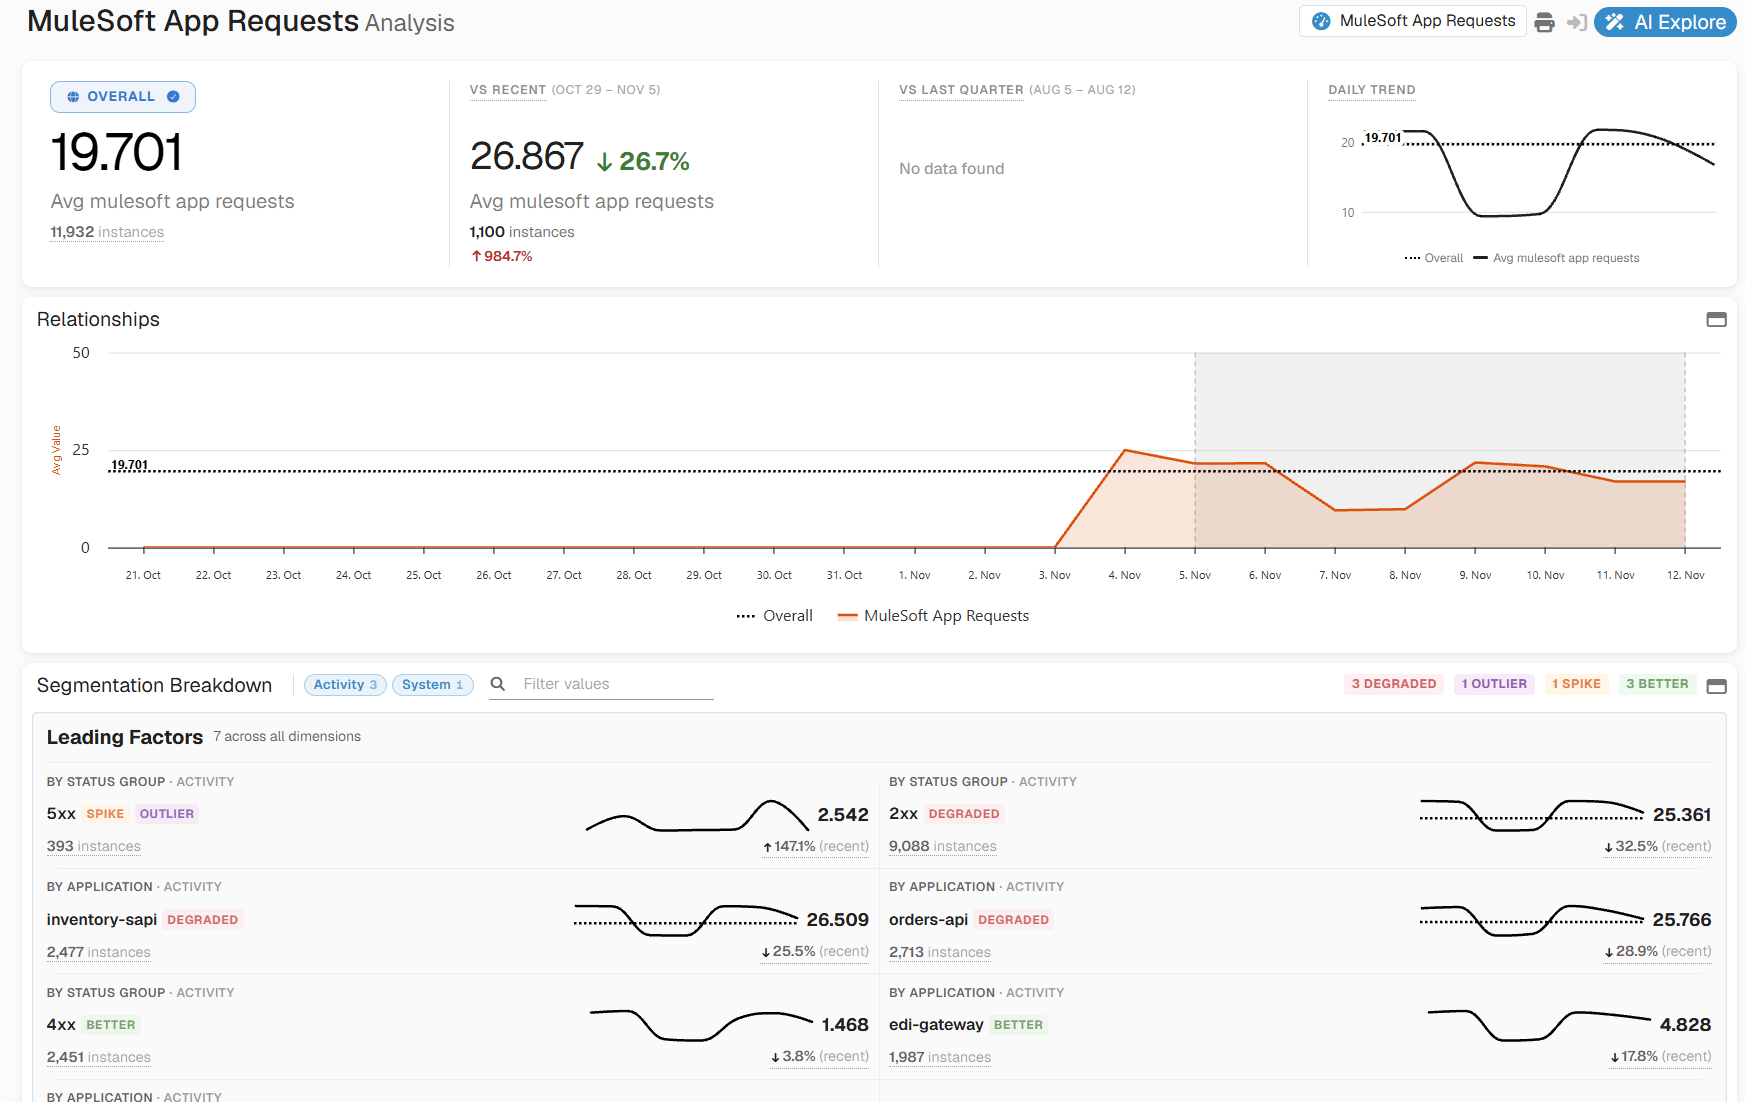
Analysis of the MuleSoft App Requests KPI - GermainUX
How It Connects to Other Data
Anypoint data tells you that an application is down or erroring. The transactions your Mule flows send, and the runtime logs, tell you which operation failed and why. With all three in GermainUX, you go from the alert to the failing call in one place.How It Works
Before You Start
- A GermainUX Engine that can reach your Anypoint Platform control plane over HTTPS, for example
anypoint.mulesoft.comoreu1.anypoint.mulesoft.com. See GermainUX Engine. - A connected app in Anypoint Platform that acts on its own behalf (client credentials), with read access to the applications in each environment you monitor
- Anypoint Monitoring in your organization, for request and response-time metrics
- Your organization ID and the ID and name of each environment to monitor
- The Anypoint MQ region, if you want queue depth
Set It Up
The MuleSoft Anypoint Platform wizard sets up monitoring for one Anypoint environment. It creates a MuleSoft Anypoint Monitor component on the Engine you choose, and optionally an HTTP action that restarts Runtime Fabric applications. Run it once for each environment you want to monitor.Enable Monitoring
Create the connected app
Open the wizard
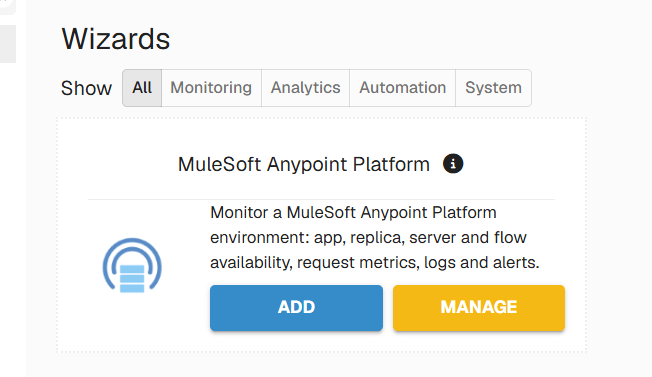
MuleSoft Anypoint Platform wizard card - GermainUX
Connect to Anypoint Platform
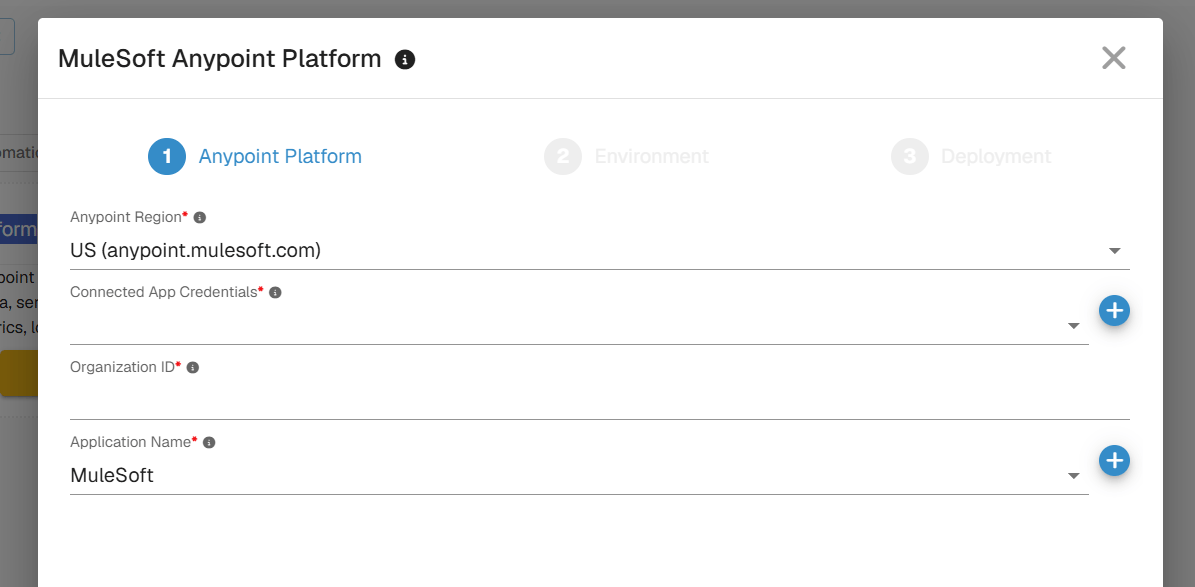
Anypoint Platform step of the wizard - GermainUX
Choose the environment
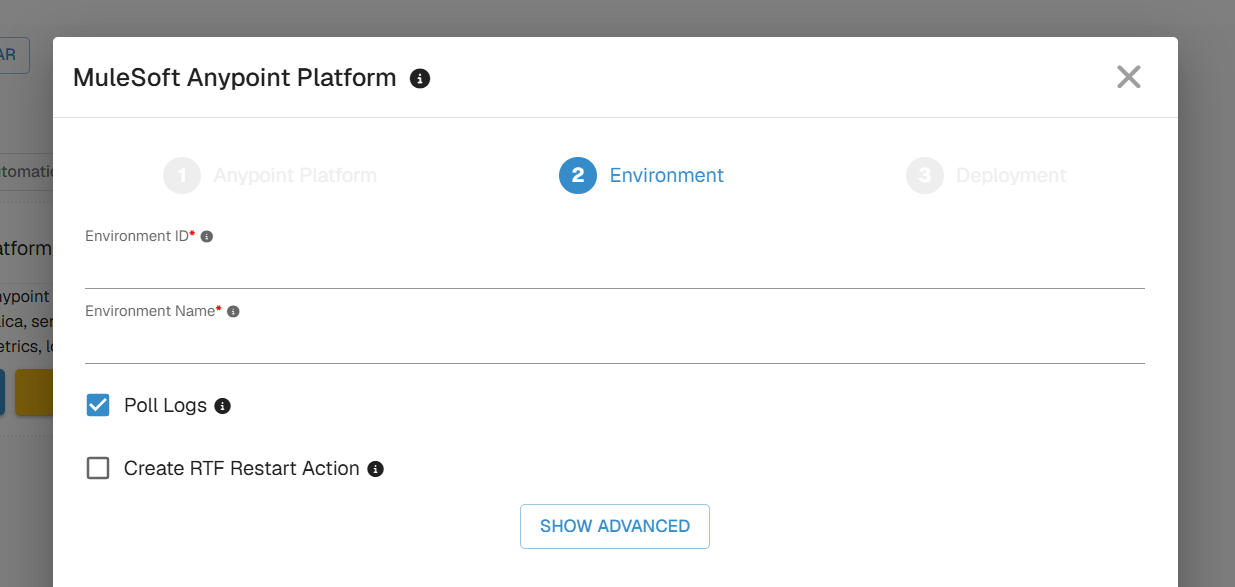
Environment step of the wizard - GermainUX
Choose where the monitor runs
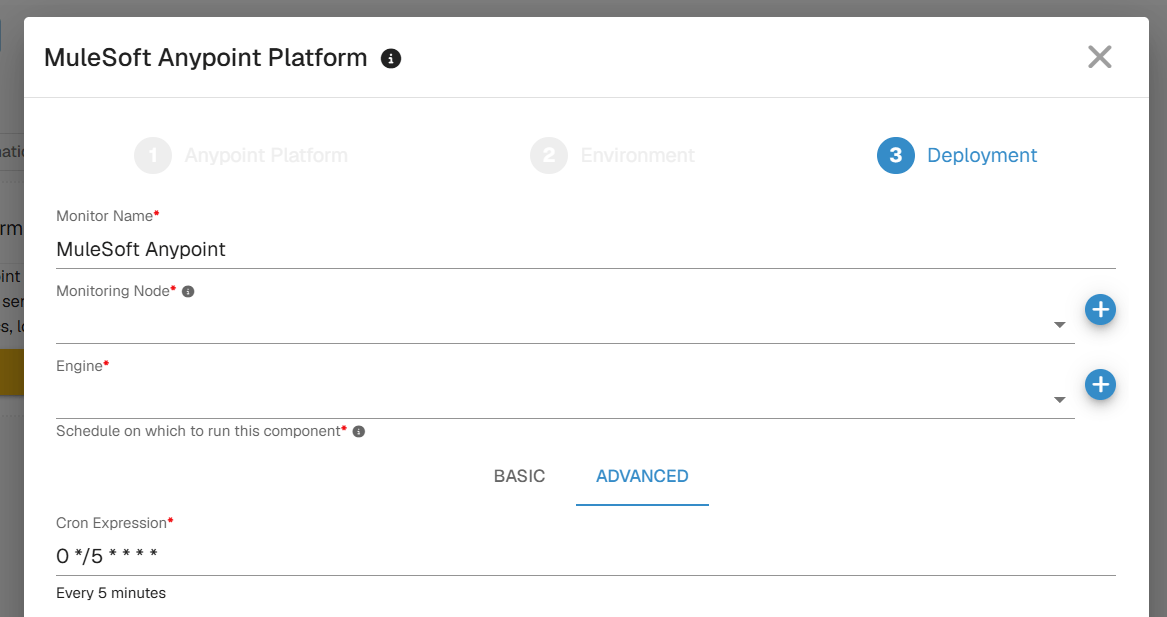
Deployment step of the wizard - GermainUX
Finish the wizard
Change the Monitoring Frequency
The wizard schedules the monitor every 5 minutes. Keep that interval: the request metrics cover a 5-minute window, so a longer interval leaves gaps, and a shorter one counts requests twice.Monitor Anypoint MQ Queues (Optional)
Queue monitoring is off by default. Ask the GermainUX team to turn it on, and give them the Anypoint MQ region of your queues, such asus-east-1. GermainUX then records the messages waiting and in flight in every queue of the environment, at each poll. The Anypoint MQ API allows 100 requests per minute, so GermainUX asks for the statistics of up to 50 queues per request.
The analysis of the MuleSoft MQ Messages KPI shows which queue is backing up, such as a notifications queue whose consumer stopped.
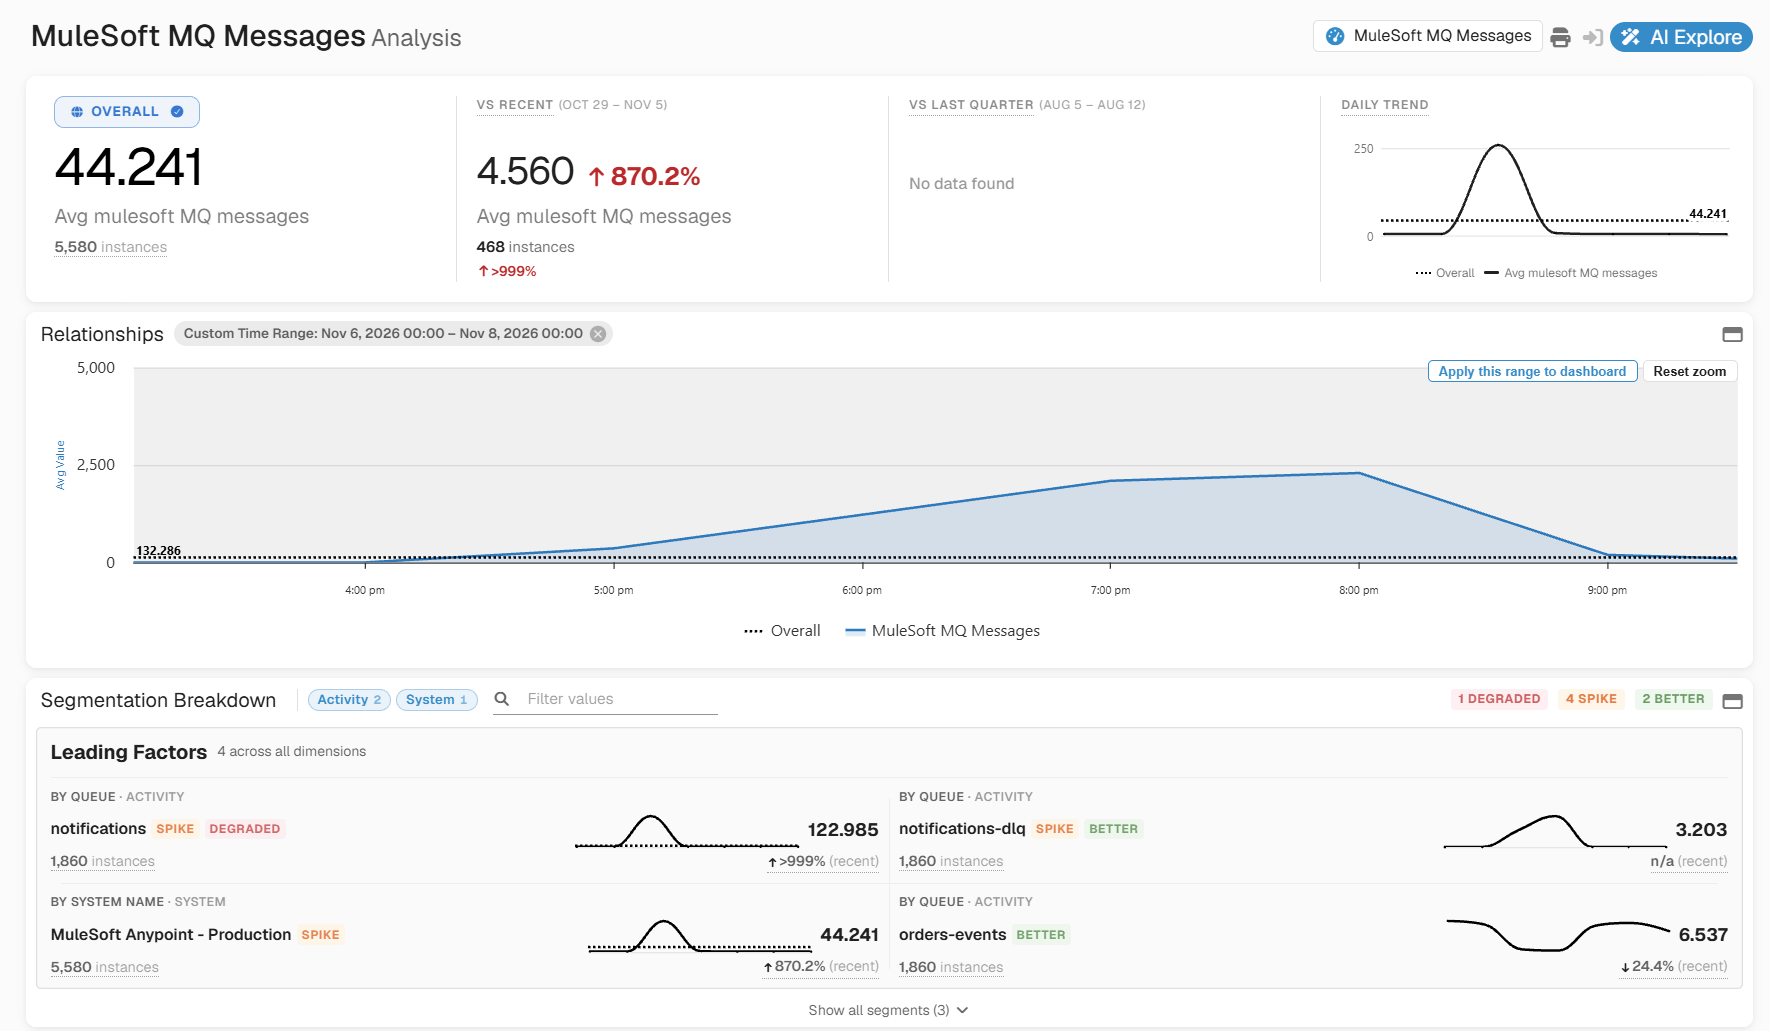
Analysis of the MuleSoft MQ Messages KPI - GermainUX
Turn Off Log Polling (Optional)
By default, GermainUX reads the new ERROR and WARN lines of every running CloudHub 1.0, CloudHub 2.0 and Runtime Fabric application. If you already collect these logs another way, turn off Poll Logs in the Environment step of the wizard. Availability, metrics and alerts keep working.Restart Applications Automatically (Optional)
GermainUX can restart a Mule application when its availability SLA is breached. It ships two HTTP actions that call the Anypoint Platform APIs:Disable Monitoring
Find the component
Turn it off
Validate
Five minutes after you finish the wizard, open the MuleSoft Overview dashboard (see See It on the Dashboard) and check that:- Anypoint Applications Down is empty, or lists only applications that really are down
- The MuleSoft Availability KPI has a row for each running application, with the environment name you gave
- Anypoint Requests shows traffic for applications that received requests
- Errors from cloud applications appear in Runtime Errors
Troubleshooting
No Anypoint data arrives
No Anypoint data arrives
MuleSoft Anypoint target 'amc-deployments' ... returned HTTP 401. A 401 means the client ID or secret is wrong, and a 403 means the connected app lacks access to that environment or API. Also check that the Engine reaches the control plane of your region over HTTPS.Availability is there, but requests and response time are missing
Availability is there, but requests and response time are missing
Requests show an application ID instead of its name
Requests show an application ID instead of its name
A stopped application doesn't show as down
A stopped application doesn't show as down
Hybrid applications have no log events
Hybrid applications have no log events
Security and Privacy
Anypoint Platform data includes personal data:- Log messages: the Details of each MuleSoft Log Event hold the full log line and error block your applications wrote, which can include customer identifiers, payload fragments and user names
- Alert context: the Details of each MuleSoft Platform Alert hold the context Runtime Manager sends with the alert
- Free text: log messages and alert context contain whatever your applications and Runtime Manager write into them, so treat them as possibly containing personal or customer data
KPIs
Related Documentation
Runtime Monitoring for MuleSoft
Analytics
Automation
Get Help
What GermainUX collects depends on the deployment models and Anypoint features you use. The GermainUX team can help you set up queue monitoring, CloudHub 1.0 restart actions, and the calls for your deployment models.Contact GermainUX Support
Can't Find What You Need?
The content of this document is proprietary to GERMAIN SOFTWARE.