Find and Fix a Salesforce Release Regression from Your IDE with the GermainUX MCP Server
Ask your coding assistant what a Salesforce release broke in production, find the Apex line behind it, fix it in your repo and confirm the fix, in one conversation.
A release goes out in the morning. An hour later, sales reps say that saving an Opportunity takes ages, and some of them get an error on the pricing panel. The developer has the code open in their IDE, but not what production did: which saves slowed down, which exception was thrown, and on which line.That evidence is spread across Salesforce. Event Monitoring log files, debug logs, the Setup Audit Trail and deployment history each sit on their own screen, and the developer has to download, open and compare them by hand. Meanwhile, the assistant in their IDE can read the code but has never seen production.GermainUX collects all of it, from Apex executions and exceptions to debug logs and deployments. With the GermainUX MCP Server, the developer’s coding assistant reads that data in the same conversation as the code. It finds the deployment that started the slowdown, reads the exception and its stack trace, confirms the cause in the debug logs and opens the line in the repo. It then proposes the fix and, after the hotfix, checks that production is back to normal.
This page uses Salesforce Sales Cloud, Claude Code and an SFDX project as the example. The same approach works for any application GermainUX monitors down to the code, and any coding assistant that connects to the MCP Server, such as Cursor or GitHub Copilot in VS Code. When the question starts from one customer’s complaint rather than a release, see Complaint Investigation with MCP.
Questions It Answers
Did this morning’s deployment slow down Opportunity saves, and by how much?
What did the deployment change, and who deployed it?
Which exception do users hit, and which line of Apex throws it?
Is it our code, or Salesforce, the network or the pricing API?
What’s the fix, based on what production actually did?
Is it fixed?
What GermainUX Watches
The assistant answers from the same KPIs the Workspace shows. The Salesforce Engine monitors collect them through the Salesforce APIs, with nothing to install in the org.
Signal
What it tells you
Where it comes from
Apex executions
Duration, CPU time and SOQL query count of every Apex request, with its entry point, such as the pricing controller
The investigation runs in one conversation, in the IDE where the code is:
Ask what changed in production after the deployment. The assistant compares the slow saves with the same hours on the previous days and lines them up with the deployments and Setup changes.
Read the exception users hit and its stack trace, down to the class and line.
Confirm the cause in a debug log: what the execution did, query by query.
Rule out what stayed normal: other objects, external APIs and Salesforce itself.
Open the line in the repo and fix it, then ask again after the hotfix to confirm it worked.
See Example Prompts for how the assistant uses the MCP tools, and Available Tools for the full list.The example below comes from simulated data, and its numbers belong to the example. All times are in UTC.
Example: A Release Puts a SOQL Query in a Loop
At 08:40 on Friday, Nov 13, a deployment changes OpportunityPricingService, its test class and OpportunityTrigger. Since that release, the service reads the pricebook entry of each line item with its own query. An Opportunity with many products now runs dozens of queries on every save, and the biggest ones hit Salesforce’s limit of 100 queries per transaction. The developer reproduces it with a trace flag on their own user, then opens the SFDX project in VS Code and asks Claude Code.
1
Ask what changed after the deployment
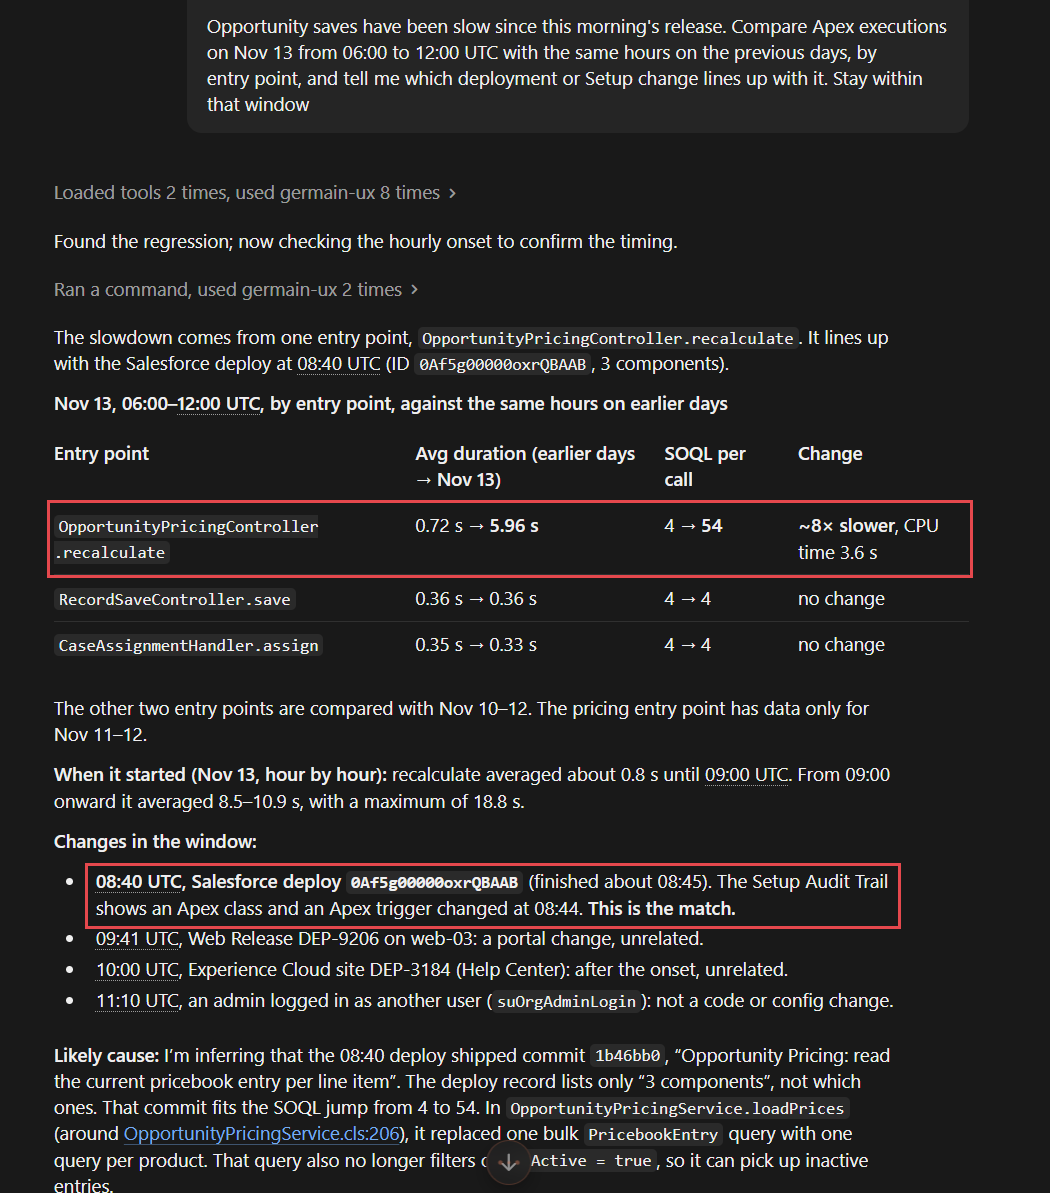
Ask: “Opportunity saves have been slow since this morning’s release. Compare Apex executions on Nov 13 from 06:00 to 12:00 UTC with the same hours on the previous days, by entry point, and tell me which deployment or Setup change lines up with it. Stay within that window.”The assistant queries Salesforce Log Apex Execution by entry point for both periods (query_kpi), then Deployment Run and Salesforce Setup Audit for the same morning. In this example, the slowdown comes from one entry point, OpportunityPricingController.recalculate. It takes 5.96 seconds on average and runs 54 SOQL queries per call, against 0.72 seconds and 4 queries on the previous days. The other entry points keep their usual times. Hour by hour, the slowdown starts at 09:00.The match is the Salesforce deployment at 08:40, and the Setup Audit Trail records a changed Apex class and trigger at 08:44. The other releases that morning belong to other applications. Because the repo is open in the IDE, the assistant also names the commit that most likely went out with the deployment, 1b46bb0, which replaced one bulk PricebookEntry query with one query per product.
Slow Saves Since the Deployment - Claude Code
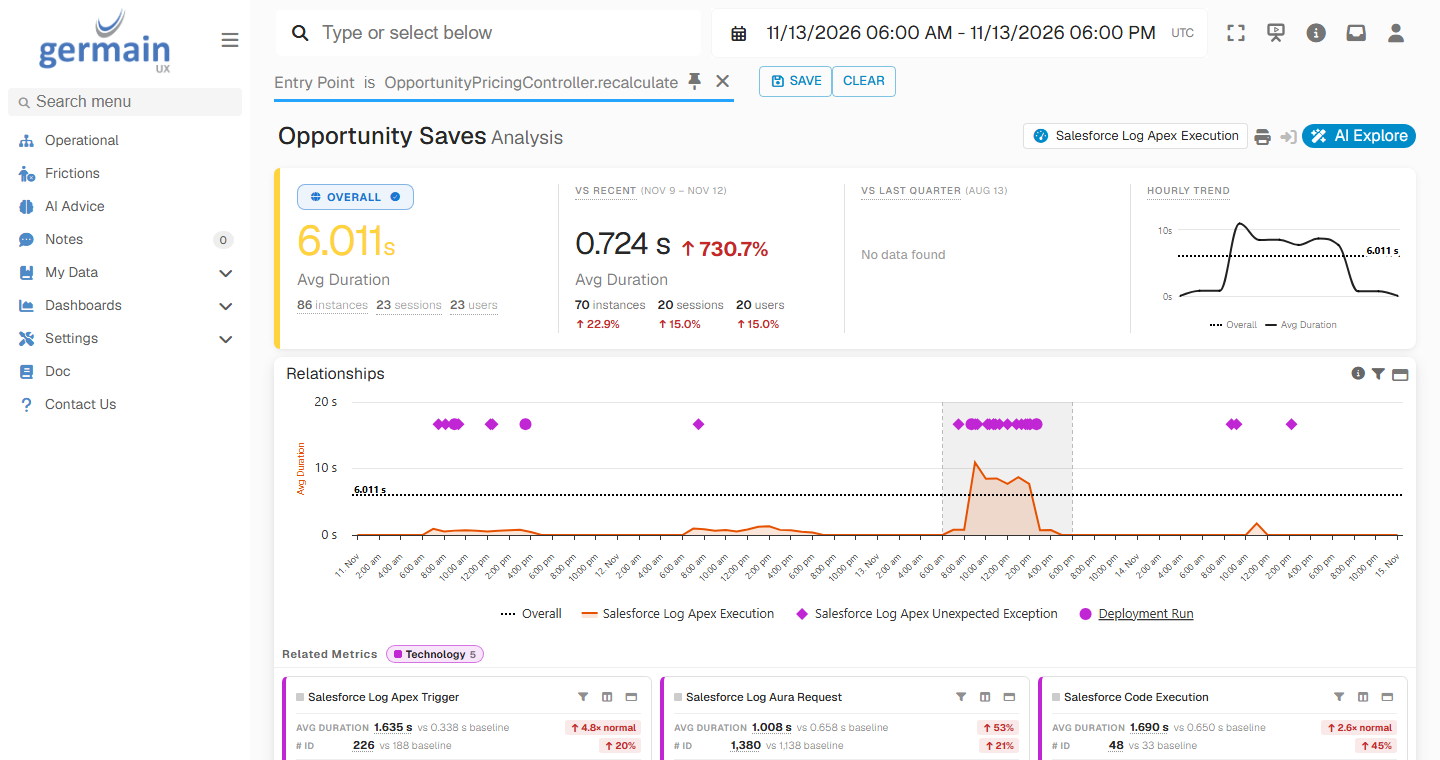
In the Workspace, deployments and Apex exceptions show as markers on the Apex executions. In this example, Opportunity saves average 6.0 seconds from 06:00 to 18:00, against 0.72 seconds at the same hours on the previous days. Execution times jump after the 08:40 deployment marker, exception markers bunch up between it and the hotfix marker in the afternoon, and execution times drop back after the hotfix.
Opportunity Saves Between the Deployment and the Hotfix - GermainUX
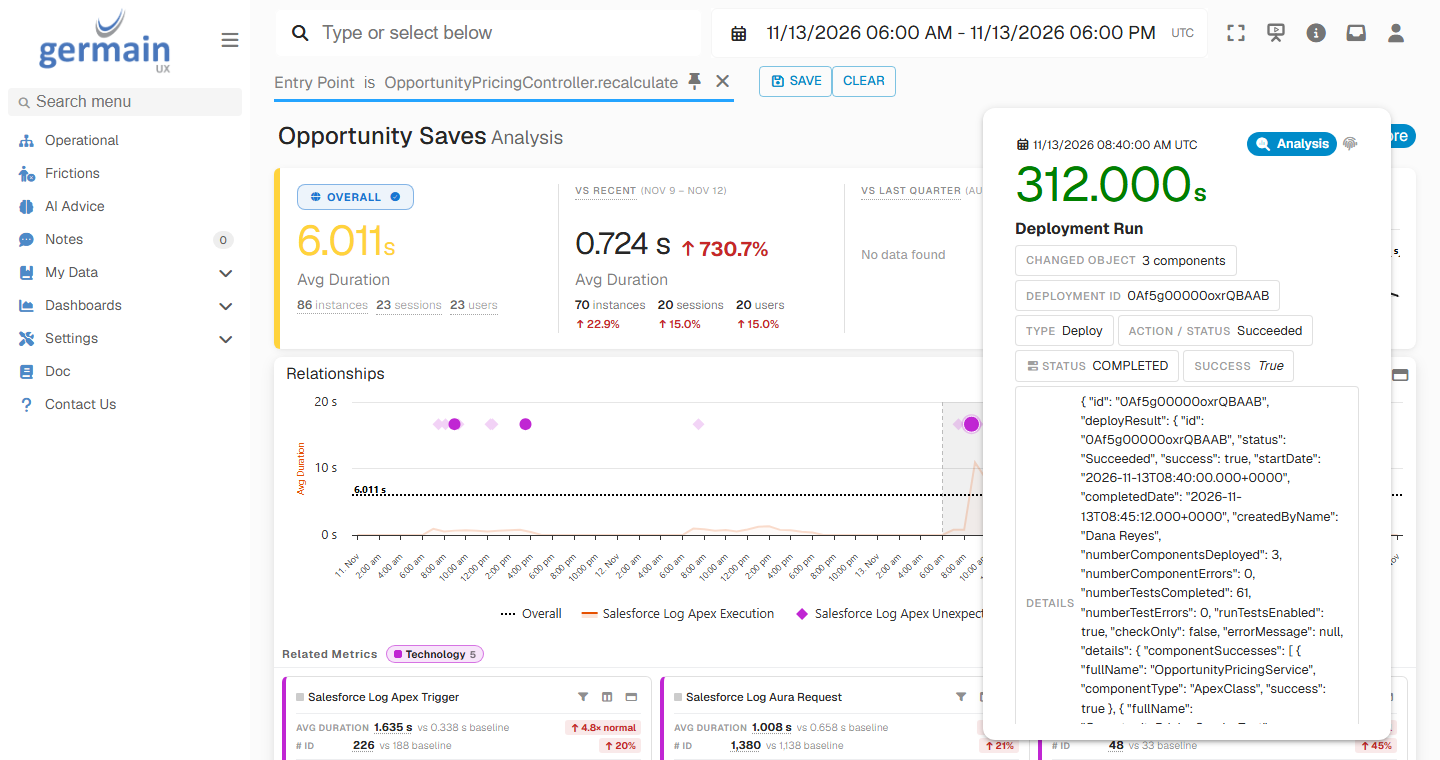
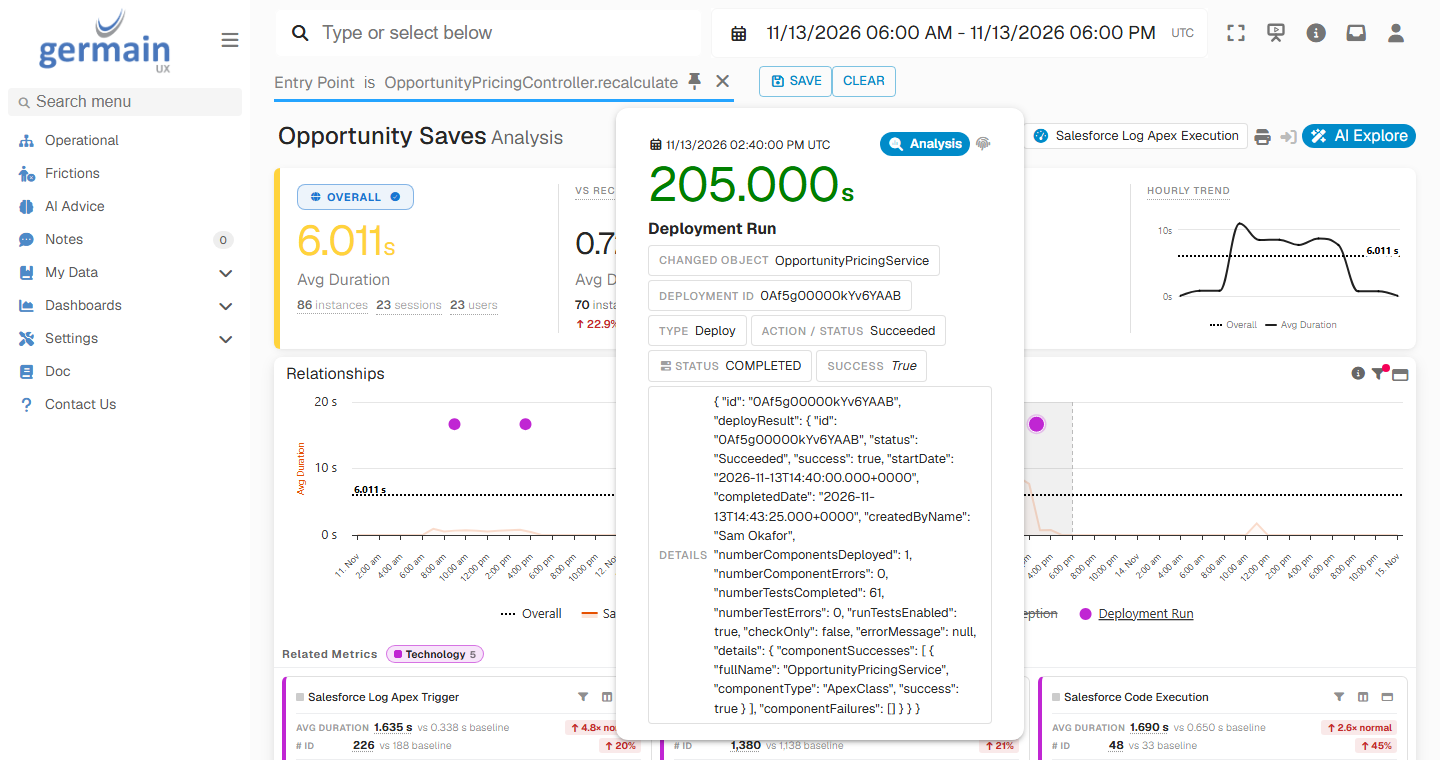
Hover the 08:40 marker to see the deployment’s details: who ran it, its status, and the components it changed.
Deployment Marker Details - GermainUX
2
Read the exception
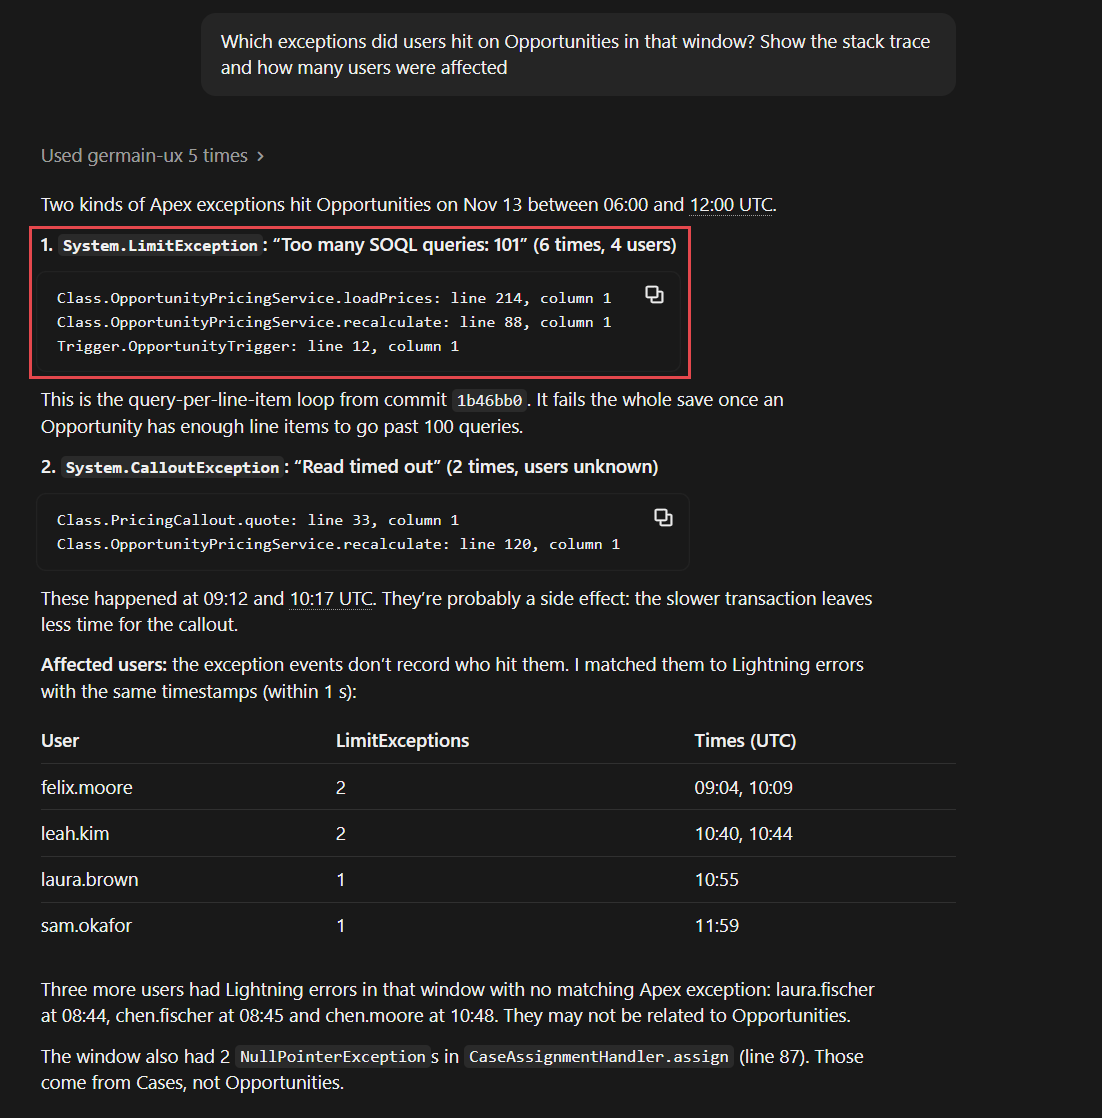
Ask: “Which exceptions did users hit on Opportunities in that window? Show the stack trace and how many users were affected.”The assistant queries Salesforce Log Apex Unexpected Exception and Salesforce Log Lightning Error for the same window (query_kpi). In this example, System.LimitException: Too many SOQL queries: 101 is thrown 6 times, for 4 users. Its stack trace runs from OpportunityTrigger line 12, through OpportunityPricingService.recalculate line 88, to OpportunityPricingService.loadPrices line 214. The assistant finds the users by matching each exception with the Lightning error a user saw at the same moment. When an Opportunity has enough line items to go past 100 queries, the whole save fails.
The Exception and Its Stack Trace - Claude Code
3
Confirm it in the debug log
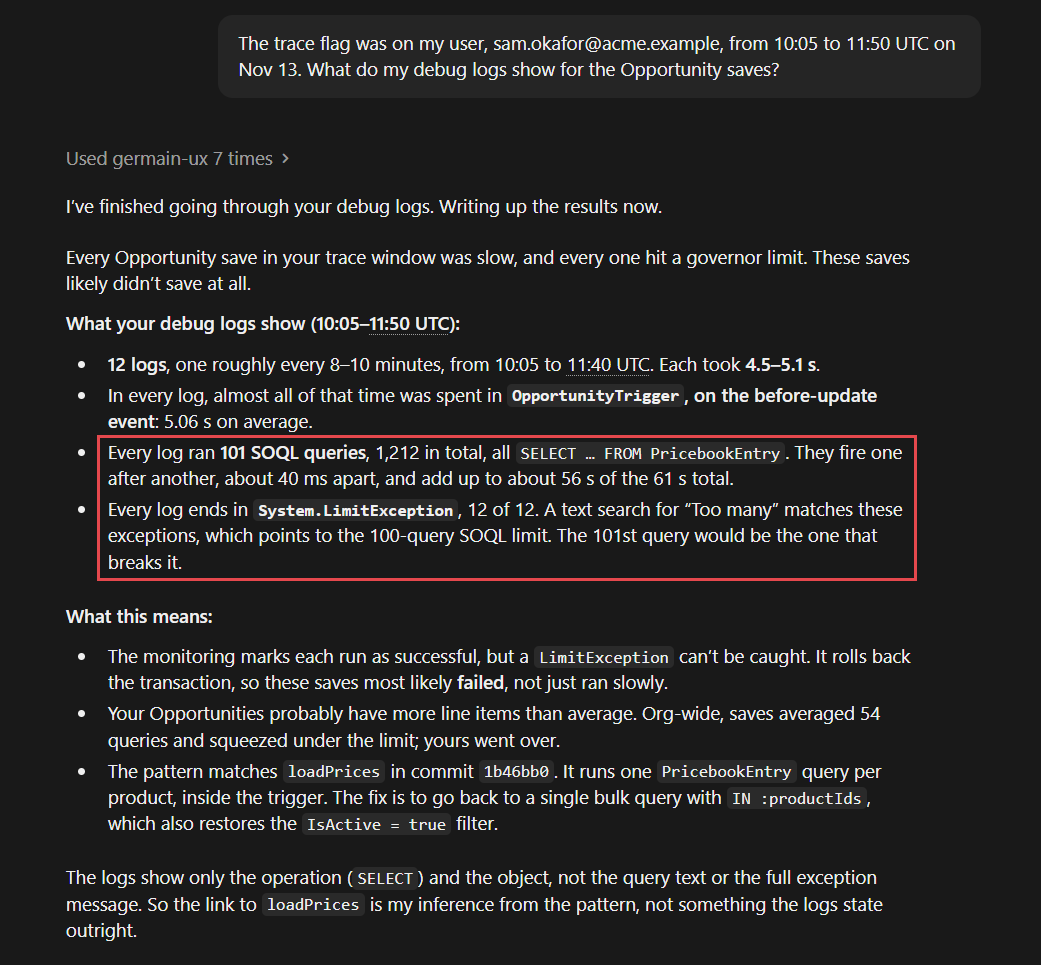
Ask: “The trace flag was on my user, sam.okafor@acme.example, from 10:05 to 11:50 UTC on Nov 13. What do my debug logs show for the Opportunity saves?”The assistant queries the debug log KPIs, such as Salesforce Code Execution, Salesforce Code SOQL Execution and Salesforce Code Exception, for that user (query_kpi, search_kpi_facts). In this example, each of the 12 traced saves takes about 5 seconds, almost all of it in OpportunityTrigger on the before-update event. Each one runs 101 PricebookEntry queries, about 40 milliseconds apart, and ends in System.LimitException. Each query is fast. The save is slow, and then fails, because of how many there are. See SOQL Execution for what a debug log records.
101 Queries per Save in the Debug Log - Claude Code
4
Rule out the rest
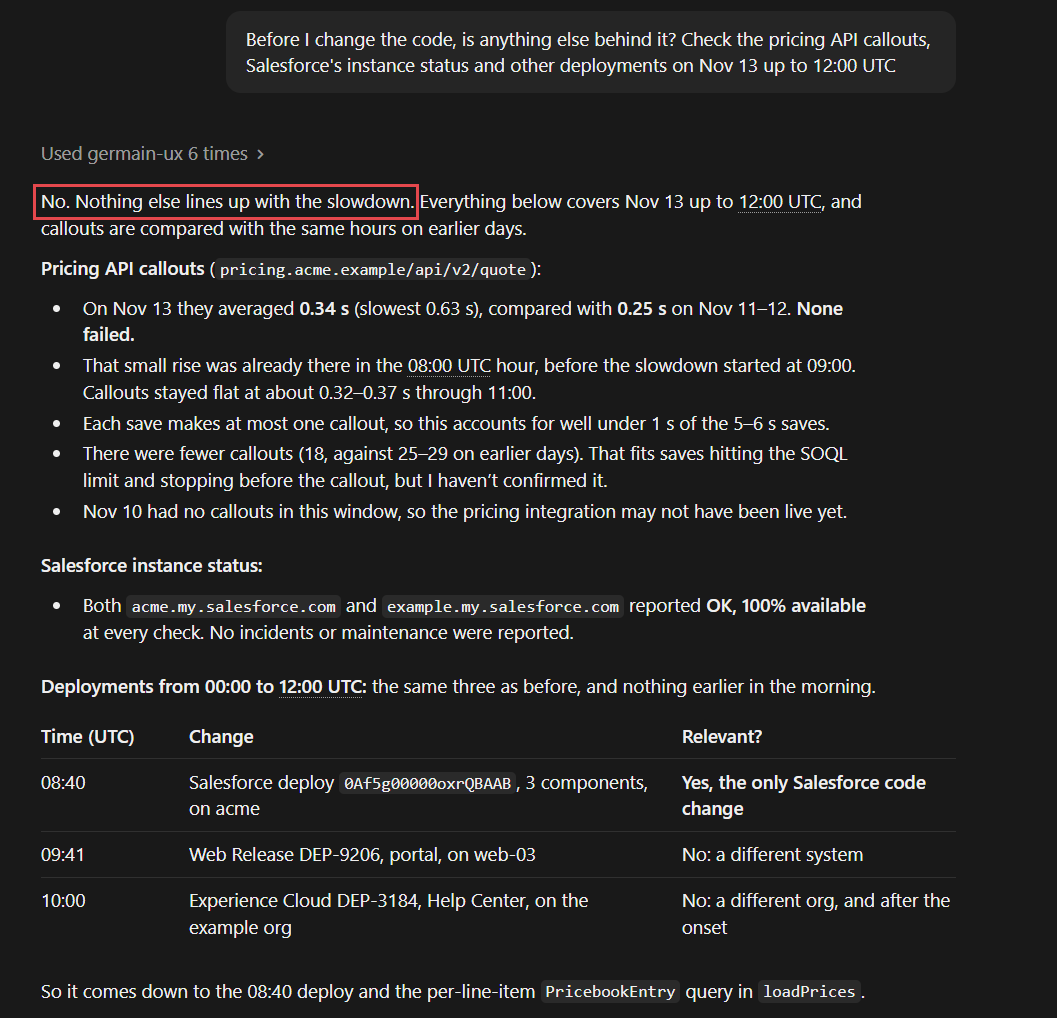
Ask: “Before I change the code, is anything else behind it? Check the pricing API callouts, Salesforce’s instance status and other deployments on Nov 13 up to 12:00 UTC.”In this example, nothing else lines up with the slowdown. Calls to the pricing API average 0.34 seconds against 0.25 on the previous days, a small rise that started before the slowdown, and none fail (query_kpi on Salesforce Log Apex Callout). Each save makes at most one call, so the API accounts for well under a second of the 5 to 6 seconds. Salesforce Instance Status is OK at every check. The 08:40 deployment is the only Salesforce code change that morning. The cause is in the code it changed.
Nothing Else Lines Up - Claude Code
5
Fix the code
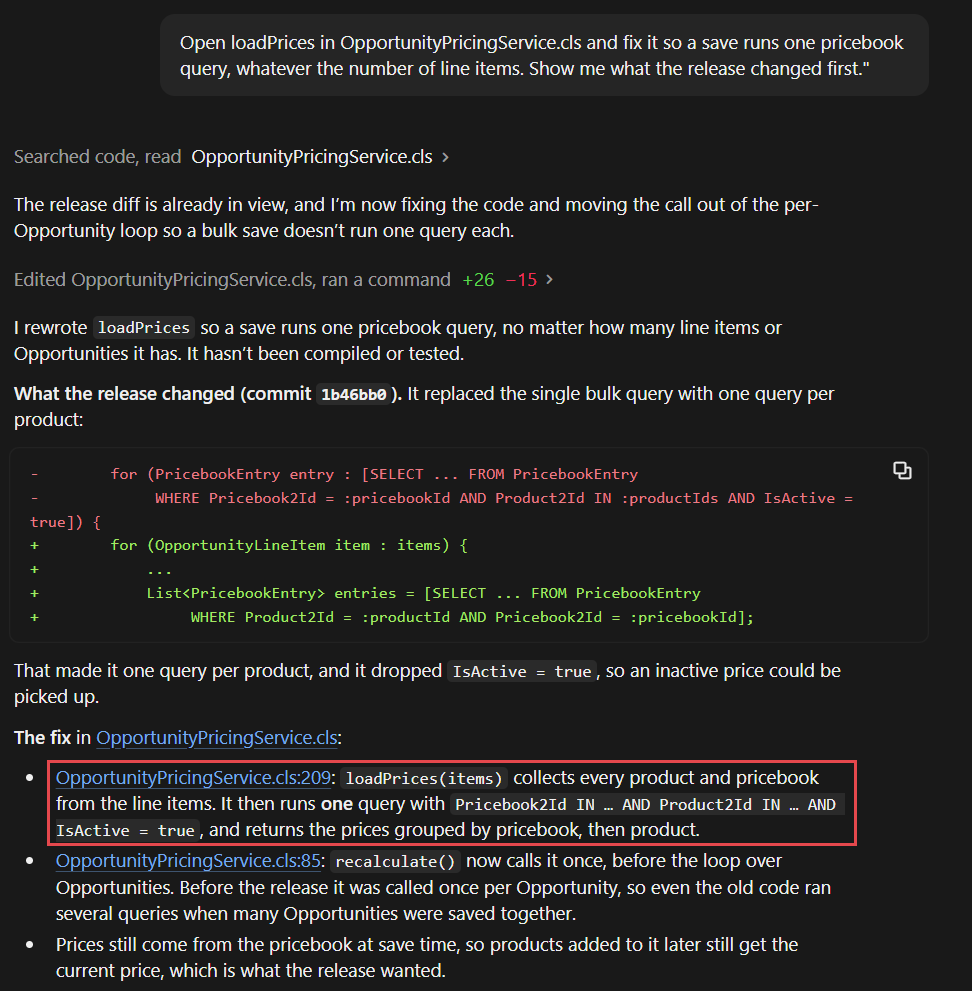
Ask: “Open loadPrices in OpportunityPricingService.cls and fix it so a save runs one pricebook query, whatever the number of line items. Show me what the release changed first.”The assistant shows what commit 1b46bb0 changed: it replaced one bulk PricebookEntry query with one query per product, and dropped the IsActive = true filter. The fix reads the prices of every product on the line items, across all the Opportunities in the save, in one query, and restores the filter. recalculate now calls it once, before the loop over the Opportunities. Prices still come from the pricebook at save time, which is what the release wanted:
OpportunityPricingService.cls
@TestVisibleprivate static Map<Id, Map<Id, PricebookEntry>> loadPrices(List<OpportunityLineItem> items) { // Collect every product and pricebook on the line items Set<Id> pricebookIds = new Set<Id>(); Set<Id> productIds = new Set<Id>(); for (OpportunityLineItem item : items) { if (item.Product2Id != null && item.Opportunity.Pricebook2Id != null) { productIds.add(item.Product2Id); pricebookIds.add(item.Opportunity.Pricebook2Id); } } Map<Id, Map<Id, PricebookEntry>> pricesByPricebook = new Map<Id, Map<Id, PricebookEntry>>(); if (productIds.isEmpty()) { return pricesByPricebook; } // One query for all of them, grouped by pricebook, then product for (PricebookEntry entry : [SELECT Id, UnitPrice, Product2Id, Pricebook2Id FROM PricebookEntry WHERE Pricebook2Id IN :pricebookIds AND Product2Id IN :productIds AND IsActive = true]) { if (!pricesByPricebook.containsKey(entry.Pricebook2Id)) { pricesByPricebook.put(entry.Pricebook2Id, new Map<Id, PricebookEntry>()); } pricesByPricebook.get(entry.Pricebook2Id).put(entry.Product2Id, entry); } return pricesByPricebook;}
The assistant edits the code but doesn’t compile or test it. Run the tests in a sandbox before you deploy the hotfix.
The Fix, Based on What Production Did - Claude Code
6
Confirm the fix
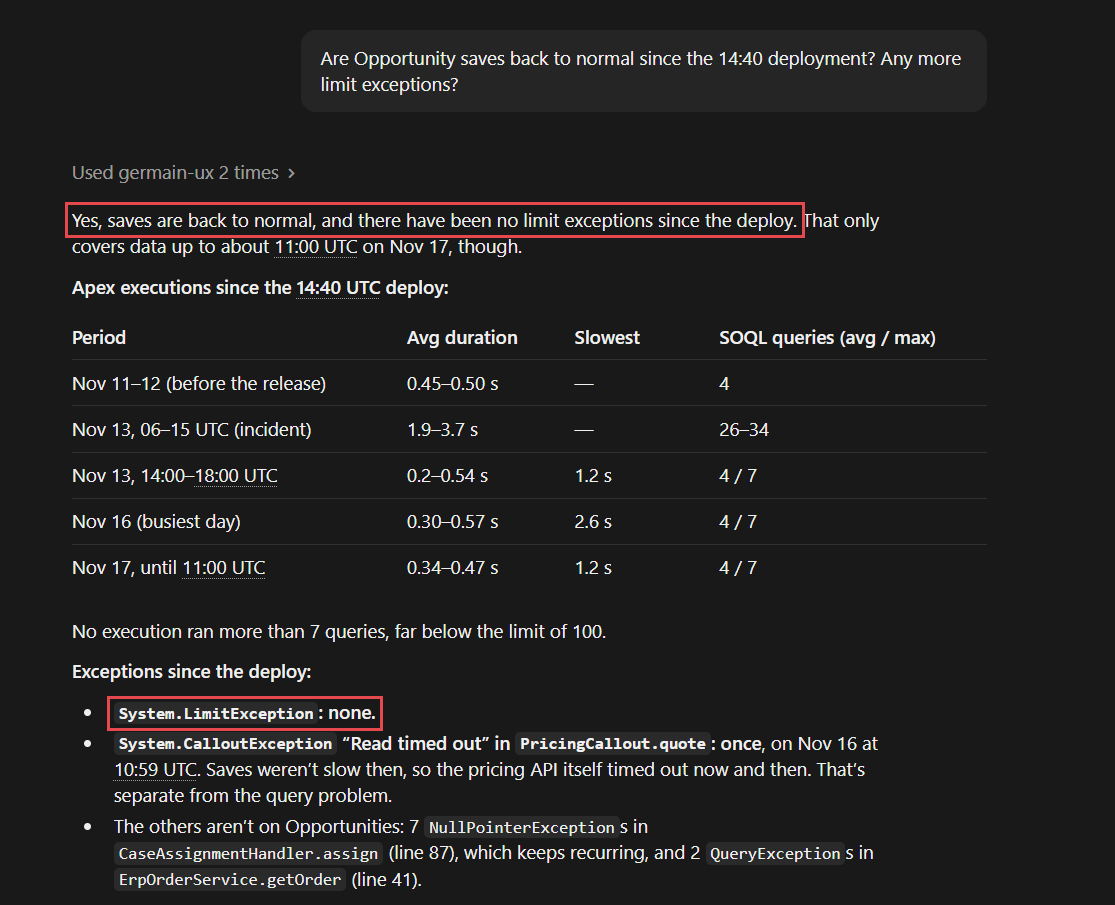
After the hotfix is deployed at 14:40, ask: “Are Opportunity saves back to normal since the 14:40 deployment? Any more limit exceptions?”In this example, Apex executions are back to about half a second from the hotfix on, no execution runs more than 7 queries, and no LimitException has been thrown since, up to the latest data on Nov 17. In the Workspace, the execution times drop at the hotfix marker on the chart above.
Saves Before and After the Hotfix - Claude Code
Hover the 14:40 marker to see that the hotfix changed only OpportunityPricingService. To hover a deployment marker that an exception marker covers, click Salesforce Log Apex Unexpected Exception in the chart legend to hide the exceptions.
Hotfix Marker Details - GermainUX
The developer fixed the cause, not the symptom, without downloading a log file or leaving the IDE. To see the same slow save next to a normal one in the Workspace, see Compare a Slow Save with a Normal One.
Alert and Act
Users noticed this release before the team did. To catch the next one sooner:
SLAs and outlier detection on the duration of Apex executions, per entry point, so a release that slows one save raises an alert
Alerts on Setup changes for Apex code changed in production, so the team knows a release landed
A post-release check in your IDE: right after each deployment, ask the assistant to compare the classes it changed with the same hours on the previous days
Set It Up
Each step adds value on its own. The assistant can answer more questions the more of the org GermainUX monitors.
1
Monitor the Salesforce org
Run the Salesforce wizard to deploy Salesforce Engine monitoring. It collects Event Monitoring logs, deployments, Setup changes, code and instance status. Event Monitoring data arrives about an hour after each hour ends, and deployments with the next Audit Monitor run. See Collection Schedule and API Usage.
2
Collect debug logs
Set a trace flag in Salesforce on the user that reproduces the problem, then let Debug Log Monitoring collect the logs. GermainUX collects only the debug logs Salesforce generates.
3
Show deployments on the timeline
Configure KPI relationships from Salesforce Log Apex Execution and your other Apex KPIs to Deployment Run, shown as markers. Every chart of those KPIs then shows when a deployment landed.
4
Enable the MCP Server for developers
Enable the MCP Server and give the developers a GermainUX account with access to the org’s data. Every tool call runs as the signed-in user, so developers see only what their account allows. See What users can see and do.
5
Connect the coding assistant
Connect the coding assistant the developers use, such as Claude Code, Cursor or GitHub Copilot in VS Code, to the GermainUX MCP Server. Open the SFDX project in the same IDE, so the assistant reads production data and the code side by side.
Additional Resources
MCP Server
Connect AI assistants to GermainUX
Salesforce Engine Monitoring
Deploy monitoring through the Salesforce APIs
Use Cases
More Use Cases
Get Help
Every Salesforce team has its own release process, trace-flag habits and coding tools. The GermainUX team can help you deploy Salesforce Engine monitoring, bring your deployments onto the timeline, and set up the MCP Server for your developers.
Contact GermainUX Support
The GermainUX team helps you get up and running faster, empower your team, turn data into actionable insights, and optimize performance to deliver measurable business outcomes.
Can't Find What You Need?
Search all GermainUX docs with Ctrl + K, or use the feedback buttons at the bottom of this page to tell us what is missing.
The content of this document is proprietary to GERMAIN SOFTWARE.
Was this page helpful?
{"docsConfig":{"theme":"mint","$schema":"https://mintlify.com/docs.json","name":"GermainUX Docs","description":"GermainUX is a real-time Operational Experience Intelligence platform that combines Monitoring + Analytics + AI + Automation to help organizations detect and resolve user, workflow, and technology issues faster, in order to 1)Improve CRM and ERP Adoption and Productivity 2)Increase eCommerce Conversion","colors":{"primary":"#2E7DF2","light":"#5B9CFF","dark":"#1A5FC8"},"logo":{"light":"https://mintcdn.com/germain-ux/ok7-BbqwVV0uk3t8/images/logo-light.png?fit=max\u0026auto=format\u0026n=ok7-BbqwVV0uk3t8\u0026q=85\u0026s=3cfe3238ac55802e43da3e4da5806f0d","dark":"https://mintcdn.com/germain-ux/ok7-BbqwVV0uk3t8/images/logo-dark.png?fit=max\u0026auto=format\u0026n=ok7-BbqwVV0uk3t8\u0026q=85\u0026s=1886121bf4312c96b6321ea733078b7f","href":"/"},"favicon":"https://mintcdn.com/germain-ux/Jw6D65yKWJ4U5yOS/images/favicon.png?fit=max\u0026auto=format\u0026n=Jw6D65yKWJ4U5yOS\u0026q=85\u0026s=bcc4dd08f0edb299e0b2af2f079f8526","appearance":{"default":"light"},"background":{"color":{"light":"#FFFFFF","dark":"#00112A"}},"navbar":{"links":[{"href":"https://germainux.atlassian.net/servicedesk/customer/portal/1","label":"Ticket"},{"href":"https://calendly.com/germainux","label":"Schedule"}],"primary":{"type":"button","label":"Contact GermainUX","href":"https://docs.germainux.com/getting-started/support"}},"footer":{"socials":{"website":"https://germainux.com"}},"seo":{"metatags":{"canonical":"https://docs.germainux.com","og:locale":"en_US","og:site_name":"GermainUX Docs","twitter:card":"summary_large_image"},"indexing":"navigable"},"styling":{"eyebrows":"section","latex":true},"integrations":{"gtm":{"tagId":"GTM-MRCBSV5R"}},"contextual":{"options":["view","chatgpt","claude"],"display":"header"},"navigation":{"pages":[]}},"deployment":{"deploymentMetadataValue":{"subdomain":"germain-ux","hasAudioNarration":false,"actualSubdomain":"germain-ux","customDomains":["docs.germainux.com"],"gitSource":{"type":"github","owner":"germainsoftware","repo":"germain-docs","deployBranch":"main","contentDirectory":"","isPrivate":true,"mountPath":"","label":"","_id":"6ae890c6c73aaa2ebb8f7a7f"},"feedback":{"contextualFeedback":{"allowEmail":true,"textInputOnly":false},"edits":false,"issues":false,"thumbs":true},"entitlements":{"AI_CHAT":{"status":"ENABLED"},"WEB_MCP":{"status":"ENABLED"},"NARRATION":{"status":"ENABLED"}},"buildId":"6b0060cd49e01b85a1c83956","clientVersion":"0.0.4248","searchFilterCounts":[{"language":"default","tag":"Documentation","count":515},{"language":"default","tag":"GermainUX Documentation","count":515},{"language":"default","tag":"Integrations","count":277},{"language":"default","tag":"Release Notes","count":81},{"language":"default","tag":"Archive","count":73},{"language":"default","tag":"Management","count":57},{"language":"default","tag":"Analytics","count":53},{"language":"default","tag":"Deploy GermainUX","count":53},{"language":"default","tag":"Action","count":48},{"language":"default","tag":"Success Stories","count":34}],"searchSettings":{"fullPageSearch":true,"showContentSnippets":true}},"assistantConfig":{"enableAskAiButton":false,"enableStarterQuestions":false,"enableContextualStarterQuestions":false,"enableAskAiSearchBar":true},"basePath":"","hasChatPermissions":true,"hasWebMcpPermissions":true,"toggles":[{"name":"kill-isr","enabled":true,"variant":{"name":"disabled","enabled":false,"feature_enabled":true},"impressionData":false},{"name":"custom-rbac-roles","enabled":true,"variant":{"name":"disabled","enabled":false,"feature_enabled":true},"impressionData":false},{"name":"agent-mintlify-slack","enabled":true,"variant":{"name":"disabled","enabled":false,"feature_enabled":true},"impressionData":false},{"name":"agent-integrations-settings","enabled":true,"variant":{"name":"disabled","enabled":false,"feature_enabled":true},"impressionData":false},{"name":"rbac-expansion","enabled":true,"variant":{"name":"disabled","enabled":false,"feature_enabled":true},"impressionData":false},{"name":"automations-pr-grouping","enabled":true,"variant":{"name":"disabled","enabled":false,"feature_enabled":true},"impressionData":false},{"name":"custom-prefix","enabled":true,"variant":{"name":"disabled","enabled":false,"feature_enabled":true},"impressionData":false},{"name":"analytics-v7","enabled":true,"variant":{"name":"disabled","enabled":false,"feature_enabled":true},"impressionData":false},{"name":"user-flows-analytics","enabled":true,"variant":{"name":"disabled","enabled":false,"feature_enabled":true},"impressionData":false},{"name":"no-publish-flow","enabled":true,"variant":{"name":"disabled","enabled":false,"feature_enabled":true},"impressionData":false},{"name":"workos-onboarding","enabled":true,"variant":{"name":"disabled","enabled":false,"feature_enabled":true},"impressionData":false},{"name":"snapshot-serving-live","enabled":true,"variant":{"name":"disabled","enabled":false,"feature_enabled":true},"impressionData":false},{"name":"stripTemperatureMiddleware","enabled":true,"variant":{"name":"disabled","enabled":false,"feature_enabled":true},"impressionData":false},{"name":"support-platform-pylon-zendesk","enabled":true,"variant":{"name":"disabled","enabled":false,"feature_enabled":true},"impressionData":false},{"name":"snapshot-serving","enabled":true,"variant":{"name":"disabled","enabled":false,"feature_enabled":true},"impressionData":false},{"name":"instant-rollback","enabled":true,"variant":{"name":"disabled","enabled":false,"feature_enabled":true},"impressionData":false},{"name":"granular-notifications-server","enabled":true,"variant":{"name":"disabled","enabled":false,"feature_enabled":true},"impressionData":false},{"name":"granular-notifications","enabled":true,"variant":{"name":"disabled","enabled":false,"feature_enabled":true},"impressionData":false},{"name":"automations-fable","enabled":true,"variant":{"name":"disabled","enabled":false,"feature_enabled":true},"impressionData":false},{"name":"fixed-ai-action-pricing","enabled":true,"variant":{"name":"disabled","enabled":false,"feature_enabled":true},"impressionData":false},{"name":"site-roles","enabled":true,"variant":{"name":"disabled","enabled":false,"feature_enabled":true},"impressionData":false},{"name":"automation-resolve-merge-conflict","enabled":true,"variant":{"name":"disabled","enabled":false,"feature_enabled":true},"impressionData":false},{"name":"scoped-publishing","enabled":true,"variant":{"name":"disabled","enabled":false,"feature_enabled":true},"impressionData":false},{"name":"mintql","enabled":true,"variant":{"name":"disabled","enabled":false,"feature_enabled":true},"impressionData":false},{"name":"page-level-analytics","enabled":true,"variant":{"name":"disabled","enabled":false,"feature_enabled":true},"impressionData":false},{"name":"editor-version-history-v2","enabled":true,"variant":{"name":"disabled","enabled":false,"feature_enabled":true},"impressionData":false},{"name":"billing-page-v2","enabled":true,"variant":{"name":"disabled","enabled":false,"feature_enabled":true},"impressionData":false},{"name":"full-page-search","enabled":true,"variant":{"name":"disabled","enabled":false,"feature_enabled":true},"impressionData":false},{"name":"workspace-projects","enabled":true,"variant":{"name":"disabled","enabled":false,"feature_enabled":true},"impressionData":false},{"name":"assistant-v5","enabled":true,"variant":{"name":"disabled","enabled":false,"feature_enabled":true},"impressionData":false},{"name":"fork-pr-previews","enabled":true,"variant":{"name":"disabled","enabled":false,"feature_enabled":true},"impressionData":false},{"name":"revalidation-jwt","enabled":true,"variant":{"name":"disabled","enabled":false,"feature_enabled":true},"impressionData":false},{"name":"workos-sso-scim","enabled":true,"variant":{"name":"disabled","enabled":false,"feature_enabled":true},"impressionData":false},{"name":"hobby-abuse-scan","enabled":true,"variant":{"name":"disabled","enabled":false,"feature_enabled":true},"impressionData":false},{"name":"dashboard-inbox","enabled":true,"variant":{"name":"disabled","enabled":false,"feature_enabled":true},"impressionData":false},{"name":"workos-signup","enabled":true,"variant":{"name":"disabled","enabled":false,"feature_enabled":true},"impressionData":false},{"name":"turbopuffer-dual-write","enabled":true,"variant":{"name":"disabled","enabled":false,"feature_enabled":true},"impressionData":false},{"name":"workos-enabled","enabled":true,"variant":{"name":"disabled","enabled":false,"feature_enabled":true},"impressionData":false},{"name":"approve-review-flow","enabled":true,"variant":{"name":"disabled","enabled":false,"feature_enabled":true},"impressionData":false},{"name":"editor-metadata","enabled":true,"variant":{"name":"disabled","enabled":false,"feature_enabled":true},"impressionData":false},{"name":"sso-setup-deadline-banner","enabled":true,"variant":{"name":"disabled","enabled":false,"feature_enabled":true},"impressionData":false},{"name":"turbopuffer-serve","enabled":true,"variant":{"name":"disabled","enabled":false,"feature_enabled":true},"impressionData":false},{"name":"live-agents","enabled":true,"variant":{"name":"disabled","enabled":false,"feature_enabled":true},"impressionData":false},{"name":"starter-pricing","enabled":true,"variant":{"name":"treatment","enabled":true,"payload":{"type":"string","value":"treatment"},"feature_enabled":true},"impressionData":false},{"name":"llms-txt-v2","enabled":true,"variant":{"name":"disabled","enabled":false,"feature_enabled":true},"impressionData":false},{"name":"wildcard-email-auth","enabled":true,"variant":{"name":"disabled","enabled":false,"feature_enabled":true},"impressionData":false}],"googleFontsInlined":false},"customCss":[]}
{"page":{"pagePath":"use-cases/salesforce-release-regression-analysis","slug":"/use-cases/salesforce-release-regression-analysis","pageMetadata":{"title":"Find and Fix a Salesforce Release Regression from Your IDE with the GermainUX MCP Server","sidebarTitle":"Release Regression Diagnosis \u0026 Fix (SFDC, MCP)","description":"Ask your coding assistant what a Salesforce release broke in production, find the Apex line behind it, fix it in your repo and confirm the fix, in one conversation.","icon":"lightbulb","keywords":["Salesforce release regression","Too many SOQL queries: 101","SOQL in a loop","Apex governor limits","slow Opportunity save","Salesforce debug logs","MCP Server","Claude Code Salesforce","AI coding assistant production data","root cause analysis"],"href":"/use-cases/salesforce-release-regression-analysis"},"description":{"compiledSource":"\"use strict\";\nconst {jsx: _jsx} = arguments[0];\nconst {useMDXComponents: _provideComponents} = arguments[0];\nfunction _createMdxContent(props) {\n const _components = {\n p: \"p\",\n ..._provideComponents(),\n ...props.components\n };\n return _jsx(_components.p, {\n children: \"Ask your coding assistant what a Salesforce release broke in production, find the Apex line behind it, fix it in your repo and confirm the fix, in one conversation.\"\n });\n}\nfunction MDXContent(props = {}) {\n const {wrapper: MDXLayout} = {\n ..._provideComponents(),\n ...props.components\n };\n return MDXLayout ? _jsx(MDXLayout, {\n ...props,\n children: _jsx(_createMdxContent, {\n ...props\n })\n }) : _createMdxContent(props);\n}\nreturn {\n default: MDXContent\n};\n","frontmatter":{},"scope":{}},"pageType":"default","mdx":{"mdxSource":{"compiledSource":"\"use strict\";const{Fragment:_Fragment,jsx:_jsx,jsxs:_jsxs}=arguments[0];const{useMDXComponents:_provideComponents}=arguments[0];const GxFooter=()=>_jsx(`p`,{className:`gx-fine`,children:`The content of this document is proprietary to GERMAIN SOFTWARE.`});const GxStyle=()=>_jsx(`style`,{children:`\n.gx-meta { display:flex; flex-direction:column; gap:10px; margin:22px 0 6px; padding:16px 18px; border:1px solid rgba(15,23,42,.08); border-radius:16px; background:rgba(46,125,242,.035); font-size:13.5px; }\n.gx-meta-row { display:flex; flex-wrap:wrap; align-items:center; gap:6px; }\n.gx-meta-label { width:96px; flex:none; color:#64748b; }\n.dark .gx-meta-label { color:#94a3b8; }\n.gx-meta code { border-color:rgba(46,125,242,.25) !important; color:#1A5FC8 !important; background:rgba(46,125,242,.08) !important; }\n.dark .gx-meta { background:linear-gradient(135deg,rgba(46,125,242,.16),rgba(0,17,42,.4)); border-color:rgba(91,156,255,.22); }\n.dark .gx-meta code { color:#BFD6FF !important; background:rgba(91,156,255,.12) !important; border-color:rgba(91,156,255,.28) !important; }\n.gx-list ul { columns:2; column-gap:24px; list-style:none !important; padding-left:0 !important; margin:14px 0 0 !important; }\n.gx-list ul:has(> li:only-child) { columns:1; }\n.gx-list li { break-inside:avoid; position:relative; padding:4px 0 4px 22px !important; margin:0 !important; font-size:14.5px; }\n.gx-list li::marker { content:\"\"; }\n.gx-list li::before { content:\"\"; position:absolute; left:3px; top:13px; width:7px; height:7px; border-radius:50%; background:#2E7DF2; opacity:.75; }\n.dark .gx-list li::before { background:#5B9CFF; }\n.gx-flow { display:flex; flex-wrap:wrap; align-items:center; gap:10px 32px; margin:16px 0; }\n.gx-flow span { position:relative; display:inline-flex; align-items:center; padding:6px 12px; border-radius:8px; font-size:13.5px; font-weight:500; background:#fff; border:1px solid rgba(15,23,42,.12); color:#0f172a; box-shadow:0 1px 2px rgba(15,23,42,.05); }\n.gx-flow span:first-child, .gx-flow span:last-child { background:rgba(46,125,242,.08); border-color:rgba(46,125,242,.25); color:#1A5FC8; }\n.gx-flow span:not(:last-child)::after { content:\"\\\\2192\"; position:absolute; left:calc(100% + 9px); color:#94a3b8; font-weight:400; }\n.dark .gx-flow span { background:rgba(255,255,255,.03); border-color:rgba(255,255,255,.12); color:#e2e8f0; box-shadow:none; }\n.dark .gx-flow span:first-child, .dark .gx-flow span:last-child { background:rgba(91,156,255,.10); border-color:rgba(91,156,255,.28); color:#BFD6FF; }\n.dark .gx-flow span:not(:last-child)::after { color:#64748b; }\n#sidebar li[id] > a > div:first-child:has(> svg[aria-hidden]) { display: none; }\n#sidebar svg[style*=\"mask-image\"], #sidebar-content svg[style*=\"mask-image\"], #navigation-items svg[style*=\"mask-image\"], aside svg[style*=\"mask-image\"] { display: none !important; }\n#sidebar div:has(> svg[style*=\"mask-image\"]), #sidebar-content div:has(> svg[style*=\"mask-image\"]), #navigation-items div:has(> svg[style*=\"mask-image\"]), aside div:has(> svg[style*=\"mask-image\"]) { display: none !important; }\n.gx-fine { margin-top:56px; padding-top:20px; border-top:1px solid rgba(15,23,42,.08); font-size:13px; color:#64748b; }\n.dark .gx-fine { border-top-color:rgba(255,255,255,.08); color:#94a3b8; }\n.gx-fine p { margin:0 !important; font-size:13px !important; color:inherit !important; }\n.eyebrow { font-size:13px !important; font-weight:700 !important; letter-spacing:.12em !important; text-transform:uppercase; color:#2E7DF2 !important; display:inline-flex; align-items:center; gap:8px; padding:4px 12px; border-radius:999px; background:rgba(46,125,242,.10); border:1px solid rgba(46,125,242,.25); height:auto !important; margin-bottom:6px; }\n.dark .eyebrow { color:#8DB8FF !important; background:rgba(91,156,255,.12); border-color:rgba(91,156,255,.30); }\n#page-title { letter-spacing:-.02em; }\n.dark #page-title { background:linear-gradient(90deg,#FFFFFF 0%,#BFD6FF 100%); -webkit-background-clip:text; background-clip:text; -webkit-text-fill-color:transparent; }\n.mdx-content h2:not(.not-prose) { position:relative; padding-left:16px; }\n.mdx-content h2:not(.not-prose)::before { content:\"\"; position:absolute; left:0; top:.2em; bottom:.2em; width:4px; border-radius:4px; background:linear-gradient(180deg,#2E7DF2,#5B9CFF); }\n.dark table th { color:#BFD6FF; }\n.dark table td:first-child { color:#FFFFFF; font-weight:500; }\n@media (max-width: 820px) { .gx-list ul { columns:1; } }\n.gx-list-more:not(.is-open) > ul > li:nth-child(n+11) { display:none; }\n.gx-more-toggle { display:inline-flex; align-items:center; gap:6px; margin:8px 0 12px 22px; padding:0; border:0; background:none; cursor:pointer; font-size:14px; font-weight:600; color:#1A5FC8; }\n.gx-more-toggle:hover { text-decoration:underline; }\n.gx-more-toggle::after { content:\"\\\\25BE\"; display:inline-block; font-size:12px; transition:transform .15s; }\n.gx-list-more.is-open .gx-more-toggle::after { transform:rotate(180deg); }\n.dark .gx-more-toggle { color:#8DB8FF; }\n/* === Concept #1: hero header + numbered section tiles === */\n#content-area { counter-reset: gxsec; }\n#header { position:relative; overflow:hidden; padding:36px 30px 24px; border-radius:24px; border:1px solid rgba(91,156,255,.22); background:radial-gradient(800px 300px at 100% 0%, rgba(46,125,242,.32), transparent 65%), #0B2147; }\n#header::before { content:\"\"; position:absolute; inset:0; pointer-events:none; background-image:linear-gradient(rgba(255,255,255,.045) 1px,transparent 1px),linear-gradient(90deg,rgba(255,255,255,.045) 1px,transparent 1px); background-size:34px 34px; -webkit-mask-image:linear-gradient(100deg,transparent 15%,#000 75%); mask-image:linear-gradient(100deg,transparent 15%,#000 75%); }\n#header > * { position:relative; }\n#header #page-title { color:#fff !important; -webkit-text-fill-color:#fff !important; background:none !important; font-size:clamp(1.9rem,3.4vw,2.6rem) !important; line-height:1.06 !important; font-weight:800 !important; letter-spacing:-.035em !important; }\n#header .prose, #header .prose p, #header p { color:rgba(222,233,255,.82) !important; font-size:1.06rem; line-height:1.6; }\n#header .eyebrow { color:#BFD6FF !important; background:rgba(91,156,255,.14) !important; border-color:rgba(91,156,255,.32) !important; }\n#header button, #header [role=\"button\"] { color:#DCE8FF !important; border-color:rgba(191,214,255,.25) !important; background:rgba(255,255,255,.04) !important; }\n#content-area:has(#content > .gx-meta:first-child) #header { border-radius:24px 24px 0 0; border-bottom:0; padding-bottom:18px; }\n#content:has(> .gx-meta:first-child) { margin-top:0 !important; }\n#content > .gx-meta:first-child { margin:0 !important; padding:4px 30px 28px !important; border-radius:0 0 24px 24px !important; border:1px solid rgba(91,156,255,.22) !important; border-top:0 !important; background:#0B2147 !important; }\n#content > .gx-meta:first-child:has(+ .columns) { border-radius:0 !important; border-bottom:0 !important; padding-bottom:18px !important; }\n#content > .gx-meta:first-child + .columns { margin:0 0 8px !important; padding:4px 30px 30px !important; border:1px solid rgba(91,156,255,.22); border-top:0; border-radius:0 0 24px 24px; background:#0B2147; gap:12px !important; }\n#content > .gx-meta:first-child + .columns > * { background:rgba(255,255,255,.035) !important; border-color:rgba(91,156,255,.28) !important; border-radius:16px !important; }\n#content > .gx-meta:first-child + .columns h2, #content > .gx-meta:first-child + .columns [data-component-part=\"card-title\"] { color:#fff !important; font-size:15px !important; overflow-wrap:normal !important; word-break:normal !important; }\n#content > .gx-meta:first-child + .columns p, #content > .gx-meta:first-child + .columns [data-component-part=\"card-content\"] { color:rgba(214,226,250,.7) !important; }\n#content > .gx-meta:first-child + .columns svg { background-color:#5B9CFF !important; }\n#content > .gx-meta:first-child .gx-meta-label { color:rgba(191,214,255,.6) !important; }\n#content > .gx-meta:first-child code { font-family:inherit !important; font-weight:600 !important; font-size:12.5px !important; padding:5px 13px !important; border-radius:999px !important; color:#DCE8FF !important; background:rgba(46,125,242,.14) !important; border:1px solid rgba(91,156,255,.55) !important; }\n#content > .gx-meta:first-child a { text-decoration:none !important; border:0 !important; }\n#content > .gx-meta:first-child a:not(:has(code)) { color:#BFD6FF !important; font-weight:600; }\n#content > .gx-meta:first-child .gx-meta-row > span:not(.gx-meta-label) { color:#86EFAC !important; background:rgba(34,197,94,.14) !important; border-color:rgba(134,239,172,.35) !important; }\n.mdx-content > h2:not(.not-prose), #content > h2 { counter-increment:gxsec; display:flex !important; align-items:center; gap:14px; padding-left:0 !important; margin-top:2.6em !important; font-weight:750; letter-spacing:-.02em; }\n.mdx-content > h2:not(.not-prose)::before, #content > h2::before { content:counter(gxsec, decimal-leading-zero) !important; position:static !important; flex:none; width:40px; height:40px; border-radius:12px; display:inline-flex; align-items:center; justify-content:center; font-size:13px; font-weight:700; letter-spacing:0; color:#fff; background:linear-gradient(135deg,#2E7DF2,#5B9CFF) !important; box-shadow:0 6px 18px rgba(46,125,242,.35); }\n@media (max-width:820px) { #header, #content > .gx-meta:first-child, #content > .gx-meta:first-child + .columns { padding-left:20px !important; padding-right:20px !important; } }\n#content-area:has(#content > .columns:first-child) #header { border-radius:24px 24px 0 0; border-bottom:0; padding-bottom:18px; }\n#content:has(> .columns:first-child) { margin-top:0 !important; }\n#content > .columns:first-child { margin:0 0 8px !important; padding:4px 30px 30px !important; border:1px solid rgba(91,156,255,.22); border-top:0; border-radius:0 0 24px 24px; background:#0B2147; gap:12px !important; }\n#content > .columns:first-child > * { background:rgba(255,255,255,.035) !important; border-color:rgba(91,156,255,.28) !important; border-radius:16px !important; }\n#content > .columns:first-child h2, #content > .columns:first-child [data-component-part=\"card-title\"] { color:#fff !important; font-size:15px !important; overflow-wrap:normal !important; word-break:normal !important; }\n#content > .columns:first-child p, #content > .columns:first-child [data-component-part=\"card-content\"] { color:rgba(214,226,250,.7) !important; }\n#content > .columns:first-child svg { background-color:#5B9CFF !important; }\n/* === Shell: concept #1 (top bar, menus, page) === */\n#navbar, #navbar-transition, #navbar > div { background:#00112A !important; }\n#navbar { border-bottom:1px solid rgba(91,156,255,.18) !important; }\n#navbar a, #navbar button, #navbar .nav-tabs-item { color:rgba(220,232,255,.78) !important; }\n#navbar a:hover, #navbar button:hover, #navbar .nav-tabs-item[data-active=\"true\"] { color:#FFFFFF !important; }\n#navbar a[class*=\"bg-primary\"], #navbar a[class*=\"bg-primary\"] * { color:#FFFFFF !important; }\n#navbar a[href=\"/\"], #navbar a[href=\"/\"] * { color:#FFFFFF !important; }\n#search-bar-entry { background:rgba(255,255,255,.06) !important; border:1px solid rgba(255,255,255,.14) !important; box-shadow:none !important; }\n#search-bar-entry, #search-bar-entry * { color:rgba(220,232,255,.72) !important; }\nhtml:not(.dark) #navbar img[src*=\"logo-light\"] { display:none !important; }\nhtml:not(.dark) #navbar img[src*=\"logo-dark\"] { display:block !important; }\nhtml:not(.dark) #sidebar, html:not(.dark) #sidebar-content { background:#FFFFFF !important; }\nhtml:not(.dark) #sidebar { border-right:1px solid #E6ECF5 !important; }\n#navigation-items .sidebar-group-header { font-size:11.5px !important; letter-spacing:.08em; text-transform:uppercase; }\nhtml:not(.dark) #navigation-items .sidebar-group-header { color:#0B1B33 !important; }\n#navigation-items a { font-size:13.5px !important; border-radius:10px !important; }\nhtml:not(.dark) #navigation-items a { color:#4A5A75 !important; }\nhtml:not(.dark) #navigation-items a:hover { background:#F1F5FC !important; color:#0B1B33 !important; }\n#navigation-items li[data-active] > a, #navigation-items a[aria-current=\"page\"], #navigation-items a[class*=\"bg-primary\"] { background:#EAF2FF !important; color:#1A5FC8 !important; font-weight:600 !important; box-shadow:inset 3px 0 0 #2E7DF2; }\n.dark #navigation-items li[data-active] > a, .dark #navigation-items a[aria-current=\"page\"], .dark #navigation-items a[class*=\"bg-primary\"] { background:rgba(46,125,242,.16) !important; color:#BFD6FF !important; }\nhtml:not(.dark) #table-of-contents a { color:#5B6B85; }\nhtml:not(.dark) .mdx-content h2, html:not(.dark) .mdx-content h3 { color:#0B1B33; }\nhtml:not(.dark) .mdx-content p, html:not(.dark) .mdx-content li { color:#33415C; }\n`});function _createMdxContent(props){const _components={a:`a`,code:`code`,em:`em`,li:`li`,ol:`ol`,p:`p`,pre:`pre`,span:`span`,strong:`strong`,tbody:`tbody`,td:`td`,th:`th`,thead:`thead`,tr:`tr`,ul:`ul`,..._provideComponents(),...props.components},{Card,CardGroup,CodeBlock,Frame,Heading,OptimizedImage,Step,Steps,Table,_MdxComponentBoundary}=_components;if(!Card)_missingMdxReference(`Card`,true);if(!CardGroup)_missingMdxReference(`CardGroup`,true);if(!CodeBlock)_missingMdxReference(`CodeBlock`,true);if(!Frame)_missingMdxReference(`Frame`,true);if(!Heading)_missingMdxReference(`Heading`,true);if(!OptimizedImage)_missingMdxReference(`OptimizedImage`,true);if(!Step)_missingMdxReference(`Step`,true);if(!Steps)_missingMdxReference(`Steps`,true);if(!Table)_missingMdxReference(`Table`,true);if(!_MdxComponentBoundary)_missingMdxReference(`_MdxComponentBoundary`,true);return _jsxs(_Fragment,{children:[_jsx(`div`,{className:`gx-meta`,children:_jsxs(`div`,{className:`gx-meta-row`,children:[_jsx(`span`,{className:`gx-meta-label`,children:`Components`}),_jsx(_components.a,{href:`/deploy/germain-ux-engine`,children:_jsx(`code`,{children:`Engine`})})]})}),`\n`,_jsxs(CardGroup,{cols:4,children:[_jsx(Card,{title:`What GermainUX Watches`,icon:`binoculars`,href:`#what-germainux-watches`,children:_jsx(_components.p,{children:`Apex, errors, debug logs and deployments`})}),_jsx(Card,{title:`Find the Cause`,icon:`magnifying-glass-chart`,href:`#find-the-cause`,children:_jsx(_components.p,{children:`From slow saves to the line of code`})}),_jsx(Card,{title:`Alert and Act`,icon:`bell`,href:`#alert-and-act`,children:_jsx(_components.p,{children:`Catch the next one sooner`})}),_jsx(Card,{title:`Set It Up`,icon:`sliders`,href:`#set-it-up`,children:_jsx(_components.p,{children:`Salesforce, MCP Server and your IDE`})})]}),`\n`,_jsx(Heading,{level:`2`,id:`overview`,children:`Overview`}),`\n`,_jsx(_components.p,{children:`A release goes out in the morning. An hour later, sales reps say that saving an Opportunity takes ages, and some of them get an error on the pricing panel. The developer has the code open in their IDE, but not what production did: which saves slowed down, which exception was thrown, and on which line.`}),`\n`,_jsx(_components.p,{children:`That evidence is spread across Salesforce. Event Monitoring log files, debug logs, the Setup Audit Trail and deployment history each sit on their own screen, and the developer has to download, open and compare them by hand. Meanwhile, the assistant in their IDE can read the code but has never seen production.`}),`\n`,_jsxs(_components.p,{children:[`GermainUX collects all of it, from Apex executions and exceptions to debug logs and deployments. With the `,_jsx(_components.a,{href:`/integrations/mcp-server`,children:`GermainUX MCP Server`}),`, the developer’s coding assistant reads that data in the same conversation as the code. It finds the deployment that started the slowdown, reads the exception and its stack trace, confirms the cause in the debug logs and opens the line in the repo. It then proposes the fix and, after the hotfix, checks that production is back to normal.`]}),`\n`,_jsxs(`div`,{className:`gx-flow`,children:[_jsx(`span`,{children:`Slow Saves`}),_jsx(`span`,{children:`The Deployment`}),_jsx(`span`,{children:`The Exception`}),_jsx(`span`,{children:`The Debug Log`}),_jsx(`span`,{children:`The Code Fix`}),_jsx(`span`,{children:`Fix Confirmed`})]}),`\n`,_jsxs(_components.p,{children:[`This page uses Salesforce Sales Cloud, Claude Code and an SFDX project as the example. The same approach works for any application GermainUX monitors down to the code, and any coding assistant that `,_jsx(_components.a,{href:`/integrations/mcp-server/connect-an-ai-client`,children:`connects to the MCP Server`}),`, such as Cursor or GitHub Copilot in VS Code. When the question starts from one customer’s complaint rather than a release, see `,_jsx(_components.a,{href:`/use-cases/complaint-to-ticket-analysis`,children:`Complaint Investigation with MCP`}),`.`]}),`\n`,_jsx(Heading,{level:`3`,id:`questions-it-answers`,children:`Questions It Answers`}),`\n`,_jsx(`div`,{className:`gx-list`,children:_jsxs(_components.ul,{children:[`\n`,_jsx(_components.li,{children:`Did this morning’s deployment slow down Opportunity saves, and by how much?`}),`\n`,_jsx(_components.li,{children:`What did the deployment change, and who deployed it?`}),`\n`,_jsx(_components.li,{children:`Which exception do users hit, and which line of Apex throws it?`}),`\n`,_jsx(_components.li,{children:`Is it our code, or Salesforce, the network or the pricing API?`}),`\n`,_jsx(_components.li,{children:`What’s the fix, based on what production actually did?`}),`\n`,_jsx(_components.li,{children:`Is it fixed?`}),`\n`]})}),`\n`,_jsx(Heading,{level:`2`,id:`what-germainux-watches`,children:`What GermainUX Watches`}),`\n`,_jsx(_components.p,{children:`The assistant answers from the same KPIs the Workspace shows. The Salesforce Engine monitors collect them through the Salesforce APIs, with nothing to install in the org.`}),`\n`,_jsxs(Table,{children:[_jsx(_components.thead,{children:_jsxs(_components.tr,{children:[_jsx(_components.th,{children:`Signal`}),_jsx(_components.th,{children:`What it tells you`}),_jsx(_components.th,{children:`Where it comes from`})]})}),_jsxs(_components.tbody,{children:[_jsxs(_components.tr,{children:[_jsx(_components.td,{children:_jsx(_components.strong,{children:`Apex executions`})}),_jsx(_components.td,{children:`Duration, CPU time and SOQL query count of every Apex request, with its entry point, such as the pricing controller`}),_jsxs(_components.td,{children:[_jsx(_components.a,{href:`/integrations/salesforce-monitoring/salesforce-log-monitoring`,children:`Log Monitoring`}),` (`,_jsx(_components.strong,{children:`Salesforce Log Apex Execution`}),`, `,_jsx(_components.strong,{children:`Salesforce Log Apex Trigger`}),`)`]})]}),_jsxs(_components.tr,{children:[_jsx(_components.td,{children:_jsx(_components.strong,{children:`Exceptions and errors`})}),_jsx(_components.td,{children:`Unhandled Apex exceptions with their stack trace, and the errors users see in Lightning components`}),_jsxs(_components.td,{children:[_jsx(_components.a,{href:`/integrations/salesforce-monitoring/salesforce-log-monitoring`,children:`Log Monitoring`}),` (`,_jsx(_components.strong,{children:`Salesforce Log Apex Unexpected Exception`}),`, `,_jsx(_components.strong,{children:`Salesforce Log Lightning Error`}),`)`]})]}),_jsxs(_components.tr,{children:[_jsx(_components.td,{children:_jsx(_components.strong,{children:`Debug logs`})}),_jsx(_components.td,{children:`Every SOQL query, DML statement and exception inside one traced execution`}),_jsxs(_components.td,{children:[_jsx(_components.a,{href:`/integrations/salesforce-monitoring/salesforce-debug-log-monitoring`,children:`Debug Log Monitoring`}),` (`,_jsx(_components.strong,{children:`Salesforce Code SOQL Execution`}),`, `,_jsx(_components.strong,{children:`Salesforce Code Exception`}),`)`]})]}),_jsxs(_components.tr,{children:[_jsx(_components.td,{children:_jsx(_components.strong,{children:`Deployments and changes`})}),_jsx(_components.td,{children:`Each deployment with its components and tests, and each change in Setup, such as Apex class code`}),_jsxs(_components.td,{children:[_jsx(_components.a,{href:`/integrations/salesforce-monitoring/salesforce-audit-monitoring`,children:`Audit Monitoring`}),` (`,_jsx(_components.strong,{children:`Deployment Run`}),`, `,_jsx(_components.strong,{children:`Salesforce Setup Audit`}),`)`]})]}),_jsxs(_components.tr,{children:[_jsx(_components.td,{children:_jsx(_components.strong,{children:`Callouts`})}),_jsx(_components.td,{children:`Response time and status of the org’s calls to external APIs`}),_jsxs(_components.td,{children:[_jsx(_components.a,{href:`/integrations/salesforce-monitoring/salesforce-log-monitoring`,children:`Log Monitoring`}),` (`,_jsx(_components.strong,{children:`Salesforce Log Apex Callout`}),`)`]})]}),_jsxs(_components.tr,{children:[_jsx(_components.td,{children:_jsx(_components.strong,{children:`Salesforce’s own health`})}),_jsx(_components.td,{children:`Incidents and maintenance on your Salesforce instance`}),_jsx(_components.td,{children:_jsx(_components.a,{href:`/integrations/salesforce-monitoring/salesforce-instance-status-monitoring`,children:`Instance Status Monitoring`})})]})]})]}),`\n`,_jsxs(_components.p,{children:[`See `,_jsx(_components.a,{href:`/integrations/salesforce-monitoring/salesforce-monitoring-kpis`,children:`Salesforce Monitoring KPIs`}),` for the full list.`]}),`\n`,_jsx(Heading,{level:`2`,id:`find-the-cause`,children:`Find the Cause`}),`\n`,_jsx(_components.p,{children:`The investigation runs in one conversation, in the IDE where the code is:`}),`\n`,_jsxs(_components.ol,{children:[`\n`,_jsx(_components.li,{children:`Ask what changed in production after the deployment. The assistant compares the slow saves with the same hours on the previous days and lines them up with the deployments and Setup changes.`}),`\n`,_jsx(_components.li,{children:`Read the exception users hit and its stack trace, down to the class and line.`}),`\n`,_jsx(_components.li,{children:`Confirm the cause in a debug log: what the execution did, query by query.`}),`\n`,_jsx(_components.li,{children:`Rule out what stayed normal: other objects, external APIs and Salesforce itself.`}),`\n`,_jsx(_components.li,{children:`Open the line in the repo and fix it, then ask again after the hotfix to confirm it worked.`}),`\n`]}),`\n`,_jsxs(_components.p,{children:[`See `,_jsx(_components.a,{href:`/integrations/mcp-server/example-prompts`,children:`Example Prompts`}),` for how the assistant uses the MCP tools, and `,_jsx(_components.a,{href:`/integrations/mcp-server#available-tools`,children:`Available Tools`}),` for the full list.`]}),`\n`,_jsx(_components.p,{children:`The example below comes from simulated data, and its numbers belong to the example. All times are in UTC.`}),`\n`,_jsx(Heading,{level:`3`,id:`example-a-release-puts-a-soql-query-in-a-loop`,children:`Example: A Release Puts a SOQL Query in a Loop`}),`\n`,_jsxs(_components.p,{children:[`At 08:40 on Friday, Nov 13, a deployment changes `,_jsx(_components.code,{children:`OpportunityPricingService`}),`, its test class and `,_jsx(_components.code,{children:`OpportunityTrigger`}),`. Since that release, the service reads the pricebook entry of each line item with its own query. An Opportunity with many products now runs dozens of queries on every save, and the biggest ones hit Salesforce’s limit of 100 queries per transaction. The developer reproduces it with a trace flag on their own user, then opens the SFDX project in VS Code and asks Claude Code.`]}),`\n`,_jsxs(Steps,{children:[_jsxs(Step,{title:`Ask what changed after the deployment`,children:[_jsxs(_components.p,{children:[`Ask: `,_jsx(_components.em,{children:`“Opportunity saves have been slow since this morning’s release. Compare Apex executions on Nov 13 from 06:00 to 12:00 UTC with the same hours on the previous days, by entry point, and tell me which deployment or Setup change lines up with it. Stay within that window.”`})]}),_jsxs(_components.p,{children:[`The assistant queries `,_jsx(_components.strong,{children:`Salesforce Log Apex Execution`}),` by entry point for both periods (`,_jsx(_components.code,{children:`query_kpi`}),`), then `,_jsx(_components.strong,{children:`Deployment Run`}),` and `,_jsx(_components.strong,{children:`Salesforce Setup Audit`}),` for the same morning. In this example, the slowdown comes from one entry point, `,_jsx(_components.code,{children:`OpportunityPricingController.recalculate`}),`. It takes 5.96 seconds on average and runs 54 SOQL queries per call, against 0.72 seconds and 4 queries on the previous days. The other entry points keep their usual times. Hour by hour, the slowdown starts at 09:00.`]}),_jsxs(_components.p,{children:[`The match is the Salesforce deployment at 08:40, and the Setup Audit Trail records a changed Apex class and trigger at 08:44. The other releases that morning belong to other applications. Because the repo is open in the IDE, the assistant also names the commit that most likely went out with the deployment, `,_jsx(_components.code,{children:`1b46bb0`}),`, which replaced one bulk `,_jsx(_components.code,{children:`PricebookEntry`}),` query with one query per product.`]}),_jsx(Frame,{caption:`Slow Saves Since the Deployment - Claude Code`,children:_jsx(OptimizedImage,{loading:`lazy`,src:`https://mintcdn.com/germain-ux/EcG-bHGMKXvr8rBS/images/main/salesforce-release-regression-analysis/regression-check.png?fit=max\u0026auto=format\u0026n=EcG-bHGMKXvr8rBS\u0026q=85\u0026s=e1b3ddecdde315b58a3864854d151a40`,alt:`Claude Code answer: on Nov 13 from 06:00 to 12:00 UTC, OpportunityPricingController.recalculate went from 0.72 to 5.96 seconds and from 4 to 54 SOQL queries per call, about 8 times slower from 09:00, while RecordSaveController.save and CaseAssignmentHandler.assign didn't change. It lines up with the Salesforce deploy at 08:40 UTC and the Apex class and trigger changes at 08:44, the other releases are unrelated, and commit 1b46bb0 is the likely cause`,\"data-og-width\":`1050`,width:`1050`,\"data-og-height\":`1193`,height:`1193`,\"data-path\":`images/main/salesforce-release-regression-analysis/regression-check.png`,\"data-optimize\":`true`,\"data-opv\":`3`,srcset:`https://mintcdn.com/germain-ux/EcG-bHGMKXvr8rBS/images/main/salesforce-release-regression-analysis/regression-check.png?w=280\u0026fit=max\u0026auto=format\u0026n=EcG-bHGMKXvr8rBS\u0026q=85\u0026s=2f0feedf85f0681807fe74d57c06a3a6 280w, https://mintcdn.com/germain-ux/EcG-bHGMKXvr8rBS/images/main/salesforce-release-regression-analysis/regression-check.png?w=560\u0026fit=max\u0026auto=format\u0026n=EcG-bHGMKXvr8rBS\u0026q=85\u0026s=e479f8fa3d502853098b592ab34fae31 560w, https://mintcdn.com/germain-ux/EcG-bHGMKXvr8rBS/images/main/salesforce-release-regression-analysis/regression-check.png?w=840\u0026fit=max\u0026auto=format\u0026n=EcG-bHGMKXvr8rBS\u0026q=85\u0026s=a023a0e342f2b7fb971a36e70617b2a1 840w, https://mintcdn.com/germain-ux/EcG-bHGMKXvr8rBS/images/main/salesforce-release-regression-analysis/regression-check.png?w=1100\u0026fit=max\u0026auto=format\u0026n=EcG-bHGMKXvr8rBS\u0026q=85\u0026s=f017dd764de24d76aaef2c26e0714240 1100w, https://mintcdn.com/germain-ux/EcG-bHGMKXvr8rBS/images/main/salesforce-release-regression-analysis/regression-check.png?w=1650\u0026fit=max\u0026auto=format\u0026n=EcG-bHGMKXvr8rBS\u0026q=85\u0026s=57d00621b6d78b77f473f13b5168b5c3 1650w, https://mintcdn.com/germain-ux/EcG-bHGMKXvr8rBS/images/main/salesforce-release-regression-analysis/regression-check.png?w=2500\u0026fit=max\u0026auto=format\u0026n=EcG-bHGMKXvr8rBS\u0026q=85\u0026s=b29d018b4b654ba616e4bd058d1ba756 2500w`})}),_jsxs(_components.p,{children:[`In the Workspace, deployments and Apex exceptions show as `,_jsx(_components.a,{href:`/analytics/kpis/kpi-relationships#marker`,children:`markers`}),` on the Apex executions. In this example, Opportunity saves average 6.0 seconds from 06:00 to 18:00, against 0.72 seconds at the same hours on the previous days. Execution times jump after the 08:40 deployment marker, exception markers bunch up between it and the hotfix marker in the afternoon, and execution times drop back after the hotfix.`]}),_jsx(Frame,{caption:`Opportunity Saves Between the Deployment and the Hotfix - GermainUX`,children:_jsx(OptimizedImage,{loading:`lazy`,src:`https://mintcdn.com/germain-ux/EcG-bHGMKXvr8rBS/images/main/salesforce-release-regression-analysis/opportunity-saves-markers.png?fit=max\u0026auto=format\u0026n=EcG-bHGMKXvr8rBS\u0026q=85\u0026s=c63a333d20b90d6f1ef6b50ccca0e41d`,alt:`Analysis of Salesforce Log Apex Execution for the Opportunity pricing controller from 06:00 to 18:00 UTC on Nov 13: 6.011 seconds on average against 0.724 seconds on the previous days, and a Relationships chart from Nov 11 to Nov 15 with execution times and Apex exception markers high between the Nov 13 deployment markers`,\"data-og-width\":`1440`,width:`1440`,\"data-og-height\":`760`,height:`760`,\"data-path\":`images/main/salesforce-release-regression-analysis/opportunity-saves-markers.png`,\"data-optimize\":`true`,\"data-opv\":`3`,srcset:`https://mintcdn.com/germain-ux/EcG-bHGMKXvr8rBS/images/main/salesforce-release-regression-analysis/opportunity-saves-markers.png?w=280\u0026fit=max\u0026auto=format\u0026n=EcG-bHGMKXvr8rBS\u0026q=85\u0026s=ce630c64d6b1308d5dad9be22398d1ce 280w, https://mintcdn.com/germain-ux/EcG-bHGMKXvr8rBS/images/main/salesforce-release-regression-analysis/opportunity-saves-markers.png?w=560\u0026fit=max\u0026auto=format\u0026n=EcG-bHGMKXvr8rBS\u0026q=85\u0026s=e228e9ae8d97fda1df004d051fe0d06a 560w, https://mintcdn.com/germain-ux/EcG-bHGMKXvr8rBS/images/main/salesforce-release-regression-analysis/opportunity-saves-markers.png?w=840\u0026fit=max\u0026auto=format\u0026n=EcG-bHGMKXvr8rBS\u0026q=85\u0026s=8fb539f08b88ff37f311d20396a04a98 840w, https://mintcdn.com/germain-ux/EcG-bHGMKXvr8rBS/images/main/salesforce-release-regression-analysis/opportunity-saves-markers.png?w=1100\u0026fit=max\u0026auto=format\u0026n=EcG-bHGMKXvr8rBS\u0026q=85\u0026s=da4488e67f7a3cf71b5fda5ac2c12de8 1100w, https://mintcdn.com/germain-ux/EcG-bHGMKXvr8rBS/images/main/salesforce-release-regression-analysis/opportunity-saves-markers.png?w=1650\u0026fit=max\u0026auto=format\u0026n=EcG-bHGMKXvr8rBS\u0026q=85\u0026s=5bd7129e18aeecfba4fb7cffe8cc4841 1650w, https://mintcdn.com/germain-ux/EcG-bHGMKXvr8rBS/images/main/salesforce-release-regression-analysis/opportunity-saves-markers.png?w=2500\u0026fit=max\u0026auto=format\u0026n=EcG-bHGMKXvr8rBS\u0026q=85\u0026s=24f5ecad13f9aa64c9fbb0254e316122 2500w`})}),_jsx(_components.p,{children:`Hover the 08:40 marker to see the deployment’s details: who ran it, its status, and the components it changed.`}),_jsx(Frame,{caption:`Deployment Marker Details - GermainUX`,children:_jsx(OptimizedImage,{loading:`lazy`,src:`https://mintcdn.com/germain-ux/EcG-bHGMKXvr8rBS/images/main/salesforce-release-regression-analysis/release-marker-details.png?fit=max\u0026auto=format\u0026n=EcG-bHGMKXvr8rBS\u0026q=85\u0026s=0d1850b281581ed655686c68e0f3d72c`,alt:`Apex Execution analysis with the 08:40 UTC Deployment Run marker on Nov 13 hovered: a 312-second deploy of 3 components, status Succeeded, with the details listing OpportunityPricingService among the components`,\"data-og-width\":`1440`,width:`1440`,\"data-og-height\":`760`,height:`760`,\"data-path\":`images/main/salesforce-release-regression-analysis/release-marker-details.png`,\"data-optimize\":`true`,\"data-opv\":`3`,srcset:`https://mintcdn.com/germain-ux/EcG-bHGMKXvr8rBS/images/main/salesforce-release-regression-analysis/release-marker-details.png?w=280\u0026fit=max\u0026auto=format\u0026n=EcG-bHGMKXvr8rBS\u0026q=85\u0026s=2cfb9d2cad5c0f42fcf8f4bd2c3f91ab 280w, https://mintcdn.com/germain-ux/EcG-bHGMKXvr8rBS/images/main/salesforce-release-regression-analysis/release-marker-details.png?w=560\u0026fit=max\u0026auto=format\u0026n=EcG-bHGMKXvr8rBS\u0026q=85\u0026s=2d905fab7ab4a29ebec1b6a37ce177f9 560w, https://mintcdn.com/germain-ux/EcG-bHGMKXvr8rBS/images/main/salesforce-release-regression-analysis/release-marker-details.png?w=840\u0026fit=max\u0026auto=format\u0026n=EcG-bHGMKXvr8rBS\u0026q=85\u0026s=b6fa1512277d8636858ee27030184ed3 840w, https://mintcdn.com/germain-ux/EcG-bHGMKXvr8rBS/images/main/salesforce-release-regression-analysis/release-marker-details.png?w=1100\u0026fit=max\u0026auto=format\u0026n=EcG-bHGMKXvr8rBS\u0026q=85\u0026s=233d54407237224e8171f8f1d948c682 1100w, https://mintcdn.com/germain-ux/EcG-bHGMKXvr8rBS/images/main/salesforce-release-regression-analysis/release-marker-details.png?w=1650\u0026fit=max\u0026auto=format\u0026n=EcG-bHGMKXvr8rBS\u0026q=85\u0026s=65479afce30f712923b58469d3c90b29 1650w, https://mintcdn.com/germain-ux/EcG-bHGMKXvr8rBS/images/main/salesforce-release-regression-analysis/release-marker-details.png?w=2500\u0026fit=max\u0026auto=format\u0026n=EcG-bHGMKXvr8rBS\u0026q=85\u0026s=bba5fc8fb0bc6f8a70a0eab52dfba97a 2500w`})})]}),_jsxs(Step,{title:`Read the exception`,children:[_jsxs(_components.p,{children:[`Ask: `,_jsx(_components.em,{children:`“Which exceptions did users hit on Opportunities in that window? Show the stack trace and how many users were affected.”`})]}),_jsxs(_components.p,{children:[`The assistant queries `,_jsx(_components.strong,{children:`Salesforce Log Apex Unexpected Exception`}),` and `,_jsx(_components.strong,{children:`Salesforce Log Lightning Error`}),` for the same window (`,_jsx(_components.code,{children:`query_kpi`}),`). In this example, `,_jsx(_components.code,{children:`System.LimitException: Too many SOQL queries: 101`}),` is thrown 6 times, for 4 users. Its stack trace runs from `,_jsx(_components.code,{children:`OpportunityTrigger`}),` line 12, through `,_jsx(_components.code,{children:`OpportunityPricingService.recalculate`}),` line 88, to `,_jsx(_components.code,{children:`OpportunityPricingService.loadPrices`}),` line 214. The assistant finds the users by matching each exception with the Lightning error a user saw at the same moment. When an Opportunity has enough line items to go past 100 queries, the whole save fails.`]}),_jsx(Frame,{caption:`The Exception and Its Stack Trace - Claude Code`,children:_jsx(OptimizedImage,{loading:`lazy`,src:`https://mintcdn.com/germain-ux/EcG-bHGMKXvr8rBS/images/main/salesforce-release-regression-analysis/exception-stack.png?fit=max\u0026auto=format\u0026n=EcG-bHGMKXvr8rBS\u0026q=85\u0026s=ec43cb984fb6a37bb56bf897c681ead1`,alt:`Claude Code answer: System.LimitException Too many SOQL queries: 101, 6 times for 4 users on Nov 13 between 06:00 and 12:00 UTC, with the stack trace OpportunityPricingService.loadPrices line 214, recalculate line 88 and OpportunityTrigger line 12, a table of the users and times matched through Lightning errors, and two pricing callout timeouts in the same window`,\"data-og-width\":`1102`,width:`1102`,\"data-og-height\":`1118`,height:`1118`,\"data-path\":`images/main/salesforce-release-regression-analysis/exception-stack.png`,\"data-optimize\":`true`,\"data-opv\":`3`,srcset:`https://mintcdn.com/germain-ux/EcG-bHGMKXvr8rBS/images/main/salesforce-release-regression-analysis/exception-stack.png?w=280\u0026fit=max\u0026auto=format\u0026n=EcG-bHGMKXvr8rBS\u0026q=85\u0026s=c75f86fd6d79dfba2ef38dd8db414c74 280w, https://mintcdn.com/germain-ux/EcG-bHGMKXvr8rBS/images/main/salesforce-release-regression-analysis/exception-stack.png?w=560\u0026fit=max\u0026auto=format\u0026n=EcG-bHGMKXvr8rBS\u0026q=85\u0026s=7558fdcdf5ccf4e98530d75a9feb456a 560w, https://mintcdn.com/germain-ux/EcG-bHGMKXvr8rBS/images/main/salesforce-release-regression-analysis/exception-stack.png?w=840\u0026fit=max\u0026auto=format\u0026n=EcG-bHGMKXvr8rBS\u0026q=85\u0026s=6dba4350856ee0394b26895e65e4a13c 840w, https://mintcdn.com/germain-ux/EcG-bHGMKXvr8rBS/images/main/salesforce-release-regression-analysis/exception-stack.png?w=1100\u0026fit=max\u0026auto=format\u0026n=EcG-bHGMKXvr8rBS\u0026q=85\u0026s=0d7f6f854b1995d476642b1b4d3c497c 1100w, https://mintcdn.com/germain-ux/EcG-bHGMKXvr8rBS/images/main/salesforce-release-regression-analysis/exception-stack.png?w=1650\u0026fit=max\u0026auto=format\u0026n=EcG-bHGMKXvr8rBS\u0026q=85\u0026s=089bfa61ac90e4abbd42146aecc69a89 1650w, https://mintcdn.com/germain-ux/EcG-bHGMKXvr8rBS/images/main/salesforce-release-regression-analysis/exception-stack.png?w=2500\u0026fit=max\u0026auto=format\u0026n=EcG-bHGMKXvr8rBS\u0026q=85\u0026s=d774e641f0a64f15874264606ea8d2b3 2500w`})})]}),_jsxs(Step,{title:`Confirm it in the debug log`,children:[_jsxs(_components.p,{children:[`Ask: `,_jsxs(_components.em,{children:[`“The trace flag was on my user, `,_jsx(_components.a,{href:`mailto:sam.okafor@acme.example`,children:`sam.okafor@acme.example`}),`, from 10:05 to 11:50 UTC on Nov 13. What do my debug logs show for the Opportunity saves?”`]})]}),_jsxs(_components.p,{children:[`The assistant queries the debug log KPIs, such as `,_jsx(_components.strong,{children:`Salesforce Code Execution`}),`, `,_jsx(_components.strong,{children:`Salesforce Code SOQL Execution`}),` and `,_jsx(_components.strong,{children:`Salesforce Code Exception`}),`, for that user (`,_jsx(_components.code,{children:`query_kpi`}),`, `,_jsx(_components.code,{children:`search_kpi_facts`}),`). In this example, each of the 12 traced saves takes about 5 seconds, almost all of it in `,_jsx(_components.code,{children:`OpportunityTrigger`}),` on the before-update event. Each one runs 101 `,_jsx(_components.code,{children:`PricebookEntry`}),` queries, about 40 milliseconds apart, and ends in `,_jsx(_components.code,{children:`System.LimitException`}),`. Each query is fast. The save is slow, and then fails, because of how many there are. See `,_jsx(_components.a,{href:`/integrations/salesforce-monitoring/salesforce-debug-log-monitoring#soql-execution`,children:`SOQL Execution`}),` for what a debug log records.`]}),_jsx(Frame,{caption:`101 Queries per Save in the Debug Log - Claude Code`,children:_jsx(OptimizedImage,{loading:`lazy`,src:`https://mintcdn.com/germain-ux/EcG-bHGMKXvr8rBS/images/main/salesforce-release-regression-analysis/debug-log-soql.png?fit=max\u0026auto=format\u0026n=EcG-bHGMKXvr8rBS\u0026q=85\u0026s=ae9718d72c22112084bfcd9c007d3912`,alt:`Claude Code answer: 12 debug logs between 10:05 and 11:40 UTC, each taking 4.5 to 5.1 seconds, almost all in OpportunityTrigger on the before-update event, each running 101 SELECT queries on PricebookEntry about 40 milliseconds apart and ending in System.LimitException, matching the per-product query in loadPrices from commit 1b46bb0`,\"data-og-width\":`1041`,width:`1041`,\"data-og-height\":`965`,height:`965`,\"data-path\":`images/main/salesforce-release-regression-analysis/debug-log-soql.png`,\"data-optimize\":`true`,\"data-opv\":`3`,srcset:`https://mintcdn.com/germain-ux/EcG-bHGMKXvr8rBS/images/main/salesforce-release-regression-analysis/debug-log-soql.png?w=280\u0026fit=max\u0026auto=format\u0026n=EcG-bHGMKXvr8rBS\u0026q=85\u0026s=5cb9886407c700dae2c05269453c17f9 280w, https://mintcdn.com/germain-ux/EcG-bHGMKXvr8rBS/images/main/salesforce-release-regression-analysis/debug-log-soql.png?w=560\u0026fit=max\u0026auto=format\u0026n=EcG-bHGMKXvr8rBS\u0026q=85\u0026s=5d3bafad0b06997ec292ecf3ef1941b7 560w, https://mintcdn.com/germain-ux/EcG-bHGMKXvr8rBS/images/main/salesforce-release-regression-analysis/debug-log-soql.png?w=840\u0026fit=max\u0026auto=format\u0026n=EcG-bHGMKXvr8rBS\u0026q=85\u0026s=e3be26937c18a469f51ff8ed9a4a0e68 840w, https://mintcdn.com/germain-ux/EcG-bHGMKXvr8rBS/images/main/salesforce-release-regression-analysis/debug-log-soql.png?w=1100\u0026fit=max\u0026auto=format\u0026n=EcG-bHGMKXvr8rBS\u0026q=85\u0026s=89d87ae57688db45e4f38a4ea7337913 1100w, https://mintcdn.com/germain-ux/EcG-bHGMKXvr8rBS/images/main/salesforce-release-regression-analysis/debug-log-soql.png?w=1650\u0026fit=max\u0026auto=format\u0026n=EcG-bHGMKXvr8rBS\u0026q=85\u0026s=9f1762b2d8bdb813ed1a0c13290671e4 1650w, https://mintcdn.com/germain-ux/EcG-bHGMKXvr8rBS/images/main/salesforce-release-regression-analysis/debug-log-soql.png?w=2500\u0026fit=max\u0026auto=format\u0026n=EcG-bHGMKXvr8rBS\u0026q=85\u0026s=144159fb201ffbddded52bf79a01d3bc 2500w`})})]}),_jsxs(Step,{title:`Rule out the rest`,children:[_jsxs(_components.p,{children:[`Ask: `,_jsx(_components.em,{children:`“Before I change the code, is anything else behind it? Check the pricing API callouts, Salesforce’s instance status and other deployments on Nov 13 up to 12:00 UTC.”`})]}),_jsxs(_components.p,{children:[`In this example, nothing else lines up with the slowdown. Calls to the pricing API average 0.34 seconds against 0.25 on the previous days, a small rise that started before the slowdown, and none fail (`,_jsx(_components.code,{children:`query_kpi`}),` on `,_jsx(_components.strong,{children:`Salesforce Log Apex Callout`}),`). Each save makes at most one call, so the API accounts for well under a second of the 5 to 6 seconds. `,_jsx(_components.strong,{children:`Salesforce Instance Status`}),` is OK at every check. The 08:40 deployment is the only Salesforce code change that morning. The cause is in the code it changed.`]}),_jsx(Frame,{caption:`Nothing Else Lines Up - Claude Code`,children:_jsx(OptimizedImage,{loading:`lazy`,src:`https://mintcdn.com/germain-ux/EcG-bHGMKXvr8rBS/images/main/salesforce-release-regression-analysis/rule-out-the-rest.png?fit=max\u0026auto=format\u0026n=EcG-bHGMKXvr8rBS\u0026q=85\u0026s=90935f08252389cbe6a79c15144218b7`,alt:`Claude Code answer for Nov 13 up to 12:00 UTC: pricing API callouts at 0.34 seconds against 0.25 on earlier days with none failed, Salesforce instance status OK at every check, and the 08:40 Salesforce deploy as the only Salesforce code change, with the portal and Help Center releases on other systems`,\"data-og-width\":`1057`,width:`1057`,\"data-og-height\":`1018`,height:`1018`,\"data-path\":`images/main/salesforce-release-regression-analysis/rule-out-the-rest.png`,\"data-optimize\":`true`,\"data-opv\":`3`,srcset:`https://mintcdn.com/germain-ux/EcG-bHGMKXvr8rBS/images/main/salesforce-release-regression-analysis/rule-out-the-rest.png?w=280\u0026fit=max\u0026auto=format\u0026n=EcG-bHGMKXvr8rBS\u0026q=85\u0026s=31ca48b54b37d73f787767bbc41b77d8 280w, https://mintcdn.com/germain-ux/EcG-bHGMKXvr8rBS/images/main/salesforce-release-regression-analysis/rule-out-the-rest.png?w=560\u0026fit=max\u0026auto=format\u0026n=EcG-bHGMKXvr8rBS\u0026q=85\u0026s=5b5822b5596532db68de5c273d4cb535 560w, https://mintcdn.com/germain-ux/EcG-bHGMKXvr8rBS/images/main/salesforce-release-regression-analysis/rule-out-the-rest.png?w=840\u0026fit=max\u0026auto=format\u0026n=EcG-bHGMKXvr8rBS\u0026q=85\u0026s=64aa5abfc7a2719e1bbe9bbd61fcb878 840w, https://mintcdn.com/germain-ux/EcG-bHGMKXvr8rBS/images/main/salesforce-release-regression-analysis/rule-out-the-rest.png?w=1100\u0026fit=max\u0026auto=format\u0026n=EcG-bHGMKXvr8rBS\u0026q=85\u0026s=bc2ed1b27882ba35c24532bc4182c00e 1100w, https://mintcdn.com/germain-ux/EcG-bHGMKXvr8rBS/images/main/salesforce-release-regression-analysis/rule-out-the-rest.png?w=1650\u0026fit=max\u0026auto=format\u0026n=EcG-bHGMKXvr8rBS\u0026q=85\u0026s=a42a04581d834913a899811572a2579d 1650w, https://mintcdn.com/germain-ux/EcG-bHGMKXvr8rBS/images/main/salesforce-release-regression-analysis/rule-out-the-rest.png?w=2500\u0026fit=max\u0026auto=format\u0026n=EcG-bHGMKXvr8rBS\u0026q=85\u0026s=e4116016a89d8d5d7f2d4b31e9312982 2500w`})})]}),_jsxs(Step,{title:`Fix the code`,children:[_jsxs(_components.p,{children:[`Ask: `,_jsxs(_components.em,{children:[`“Open `,_jsx(_components.code,{children:`loadPrices`}),` in `,_jsx(_components.code,{children:`OpportunityPricingService.cls`}),` and fix it so a save runs one pricebook query, whatever the number of line items. Show me what the release changed first.”`]})]}),_jsxs(_components.p,{children:[`The assistant shows what commit `,_jsx(_components.code,{children:`1b46bb0`}),` changed: it replaced one bulk `,_jsx(_components.code,{children:`PricebookEntry`}),` query with one query per product, and dropped the `,_jsx(_components.code,{children:`IsActive = true`}),` filter. The fix reads the prices of every product on the line items, across all the Opportunities in the save, in one query, and restores the filter. `,_jsx(_components.code,{children:`recalculate`}),` now calls it once, before the loop over the Opportunities. Prices still come from the pricebook at save time, which is what the release wanted:`]}),_jsx(CodeBlock,{filename:`OpportunityPricingService.cls`,numberOfLines:`26`,language:`apex`,children:_jsx(_components.pre,{className:`shiki shiki-themes github-light-default dark-plus`,style:{backgroundColor:`#ffffff`,\"--shiki-dark-bg\":`#0B0C0E`,color:`#1f2328`,\"--shiki-dark\":`#D4D4D4`},language:`apex`,children:_jsxs(_components.code,{language:`apex`,numberOfLines:`26`,children:[_jsx(_components.span,{className:`line`,children:_jsx(_components.span,{style:{color:`#CF222E`,\"--shiki-dark\":`#569CD6`},children:`@TestVisible`})}),`\n`,_jsxs(_components.span,{className:`line`,children:[_jsx(_components.span,{style:{color:`#CF222E`,\"--shiki-dark\":`#569CD6`},children:`private`}),_jsx(_components.span,{style:{color:`#CF222E`,\"--shiki-dark\":`#569CD6`},children:` static`}),_jsx(_components.span,{style:{color:`#CF222E`,\"--shiki-dark\":`#569CD6`},children:` Map`}),_jsx(_components.span,{style:{color:`#1F2328`,\"--shiki-dark\":`#D4D4D4`},children:`\u003c`}),_jsx(_components.span,{style:{color:`#CF222E`,\"--shiki-dark\":`#569CD6`},children:`Id`}),_jsx(_components.span,{style:{color:`#1F2328`,\"--shiki-dark\":`#D4D4D4`},children:`, `}),_jsx(_components.span,{style:{color:`#CF222E`,\"--shiki-dark\":`#569CD6`},children:`Map`}),_jsx(_components.span,{style:{color:`#1F2328`,\"--shiki-dark\":`#D4D4D4`},children:`\u003c`}),_jsx(_components.span,{style:{color:`#CF222E`,\"--shiki-dark\":`#569CD6`},children:`Id`}),_jsx(_components.span,{style:{color:`#1F2328`,\"--shiki-dark\":`#D4D4D4`},children:`, `}),_jsx(_components.span,{style:{color:`#CF222E`,\"--shiki-dark\":`#569CD6`},children:`PricebookEntry`}),_jsx(_components.span,{style:{color:`#1F2328`,\"--shiki-dark\":`#D4D4D4`},children:`>> `}),_jsx(_components.span,{style:{color:`#8250DF`,\"--shiki-dark\":`#DCDCAA`},children:`loadPrices`}),_jsx(_components.span,{style:{color:`#1F2328`,\"--shiki-dark\":`#D4D4D4`},children:`(`}),_jsx(_components.span,{style:{color:`#CF222E`,\"--shiki-dark\":`#569CD6`},children:`List`}),_jsx(_components.span,{style:{color:`#1F2328`,\"--shiki-dark\":`#D4D4D4`},children:`\u003c`}),_jsx(_components.span,{style:{color:`#CF222E`,\"--shiki-dark\":`#569CD6`},children:`OpportunityLineItem`}),_jsx(_components.span,{style:{color:`#1F2328`,\"--shiki-dark\":`#D4D4D4`},children:`> `}),_jsx(_components.span,{style:{color:`#953800`,\"--shiki-dark\":`#9CDCFE`},children:`items`}),_jsx(_components.span,{style:{color:`#1F2328`,\"--shiki-dark\":`#D4D4D4`},children:`) {`})]}),`\n`,_jsx(_components.span,{className:`line`,children:_jsx(_components.span,{style:{color:`#6E7781`,\"--shiki-dark\":`#6A9955`},children:` // Collect every product and pricebook on the line items`})}),`\n`,_jsxs(_components.span,{className:`line`,children:[_jsx(_components.span,{style:{color:`#CF222E`,\"--shiki-dark\":`#569CD6`},children:` Set`}),_jsx(_components.span,{style:{color:`#1F2328`,\"--shiki-dark\":`#D4D4D4`},children:`\u003c`}),_jsx(_components.span,{style:{color:`#CF222E`,\"--shiki-dark\":`#569CD6`},children:`Id`}),_jsx(_components.span,{style:{color:`#1F2328`,\"--shiki-dark\":`#D4D4D4`},children:`> `}),_jsx(_components.span,{style:{color:`#953800`,\"--shiki-dark\":`#9CDCFE`},children:`pricebookIds`}),_jsx(_components.span,{style:{color:`#CF222E`,\"--shiki-dark\":`#D4D4D4`},children:` =`}),_jsx(_components.span,{style:{color:`#CF222E`,\"--shiki-dark\":`#C586C0`},children:` new`}),_jsx(_components.span,{style:{color:`#CF222E`,\"--shiki-dark\":`#569CD6`},children:` Set`}),_jsx(_components.span,{style:{color:`#1F2328`,\"--shiki-dark\":`#D4D4D4`},children:`\u003c`}),_jsx(_components.span,{style:{color:`#CF222E`,\"--shiki-dark\":`#569CD6`},children:`Id`}),_jsx(_components.span,{style:{color:`#1F2328`,\"--shiki-dark\":`#D4D4D4`},children:`>();`})]}),`\n`,_jsxs(_components.span,{className:`line`,children:[_jsx(_components.span,{style:{color:`#CF222E`,\"--shiki-dark\":`#569CD6`},children:` Set`}),_jsx(_components.span,{style:{color:`#1F2328`,\"--shiki-dark\":`#D4D4D4`},children:`\u003c`}),_jsx(_components.span,{style:{color:`#CF222E`,\"--shiki-dark\":`#569CD6`},children:`Id`}),_jsx(_components.span,{style:{color:`#1F2328`,\"--shiki-dark\":`#D4D4D4`},children:`> `}),_jsx(_components.span,{style:{color:`#953800`,\"--shiki-dark\":`#9CDCFE`},children:`productIds`}),_jsx(_components.span,{style:{color:`#CF222E`,\"--shiki-dark\":`#D4D4D4`},children:` =`}),_jsx(_components.span,{style:{color:`#CF222E`,\"--shiki-dark\":`#C586C0`},children:` new`}),_jsx(_components.span,{style:{color:`#CF222E`,\"--shiki-dark\":`#569CD6`},children:` Set`}),_jsx(_components.span,{style:{color:`#1F2328`,\"--shiki-dark\":`#D4D4D4`},children:`\u003c`}),_jsx(_components.span,{style:{color:`#CF222E`,\"--shiki-dark\":`#569CD6`},children:`Id`}),_jsx(_components.span,{style:{color:`#1F2328`,\"--shiki-dark\":`#D4D4D4`},children:`>();`})]}),`\n`,_jsxs(_components.span,{className:`line`,children:[_jsx(_components.span,{style:{color:`#CF222E`,\"--shiki-dark\":`#C586C0`},children:` for`}),_jsx(_components.span,{style:{color:`#1F2328`,\"--shiki-dark\":`#D4D4D4`},children:` (`}),_jsx(_components.span,{style:{color:`#CF222E`,\"--shiki-dark\":`#569CD6`},children:`OpportunityLineItem`}),_jsx(_components.span,{style:{color:`#953800`,\"--shiki-dark\":`#9CDCFE`},children:` item`}),_jsx(_components.span,{style:{color:`#CF222E`,\"--shiki-dark\":`#D4D4D4`},children:` :`}),_jsx(_components.span,{style:{color:`#1F2328`,\"--shiki-dark\":`#9CDCFE`},children:` items`}),_jsx(_components.span,{style:{color:`#1F2328`,\"--shiki-dark\":`#D4D4D4`},children:`) {`})]}),`\n`,_jsxs(_components.span,{className:`line`,children:[_jsx(_components.span,{style:{color:`#CF222E`,\"--shiki-dark\":`#C586C0`},children:` if`}),_jsx(_components.span,{style:{color:`#1F2328`,\"--shiki-dark\":`#D4D4D4`},children:` (`}),_jsx(_components.span,{style:{color:`#1F2328`,\"--shiki-dark\":`#9CDCFE`},children:`item`}),_jsx(_components.span,{style:{color:`#1F2328`,\"--shiki-dark\":`#D4D4D4`},children:`.`}),_jsx(_components.span,{style:{color:`#1F2328`,\"--shiki-dark\":`#9CDCFE`},children:`Product2Id`}),_jsx(_components.span,{style:{color:`#CF222E`,\"--shiki-dark\":`#D4D4D4`},children:` !=`}),_jsx(_components.span,{style:{color:`#0550AE`,\"--shiki-dark\":`#569CD6`},children:` null`}),_jsx(_components.span,{style:{color:`#CF222E`,\"--shiki-dark\":`#D4D4D4`},children:` \u0026\u0026`}),_jsx(_components.span,{style:{color:`#1F2328`,\"--shiki-dark\":`#9CDCFE`},children:` item`}),_jsx(_components.span,{style:{color:`#1F2328`,\"--shiki-dark\":`#D4D4D4`},children:`.`}),_jsx(_components.span,{style:{color:`#1F2328`,\"--shiki-dark\":`#9CDCFE`},children:`Opportunity`}),_jsx(_components.span,{style:{color:`#1F2328`,\"--shiki-dark\":`#D4D4D4`},children:`.`}),_jsx(_components.span,{style:{color:`#1F2328`,\"--shiki-dark\":`#9CDCFE`},children:`Pricebook2Id`}),_jsx(_components.span,{style:{color:`#CF222E`,\"--shiki-dark\":`#D4D4D4`},children:` !=`}),_jsx(_components.span,{style:{color:`#0550AE`,\"--shiki-dark\":`#569CD6`},children:` null`}),_jsx(_components.span,{style:{color:`#1F2328`,\"--shiki-dark\":`#D4D4D4`},children:`) {`})]}),`\n`,_jsxs(_components.span,{className:`line`,children:[_jsx(_components.span,{style:{color:`#1F2328`,\"--shiki-dark\":`#9CDCFE`},children:` productIds`}),_jsx(_components.span,{style:{color:`#1F2328`,\"--shiki-dark\":`#D4D4D4`},children:`.`}),_jsx(_components.span,{style:{color:`#8250DF`,\"--shiki-dark\":`#DCDCAA`},children:`add`}),_jsx(_components.span,{style:{color:`#1F2328`,\"--shiki-dark\":`#D4D4D4`},children:`(`}),_jsx(_components.span,{style:{color:`#1F2328`,\"--shiki-dark\":`#9CDCFE`},children:`item`}),_jsx(_components.span,{style:{color:`#1F2328`,\"--shiki-dark\":`#D4D4D4`},children:`.`}),_jsx(_components.span,{style:{color:`#1F2328`,\"--shiki-dark\":`#9CDCFE`},children:`Product2Id`}),_jsx(_components.span,{style:{color:`#1F2328`,\"--shiki-dark\":`#D4D4D4`},children:`);`})]}),`\n`,_jsxs(_components.span,{className:`line`,children:[_jsx(_components.span,{style:{color:`#1F2328`,\"--shiki-dark\":`#9CDCFE`},children:` pricebookIds`}),_jsx(_components.span,{style:{color:`#1F2328`,\"--shiki-dark\":`#D4D4D4`},children:`.`}),_jsx(_components.span,{style:{color:`#8250DF`,\"--shiki-dark\":`#DCDCAA`},children:`add`}),_jsx(_components.span,{style:{color:`#1F2328`,\"--shiki-dark\":`#D4D4D4`},children:`(`}),_jsx(_components.span,{style:{color:`#1F2328`,\"--shiki-dark\":`#9CDCFE`},children:`item`}),_jsx(_components.span,{style:{color:`#1F2328`,\"--shiki-dark\":`#D4D4D4`},children:`.`}),_jsx(_components.span,{style:{color:`#1F2328`,\"--shiki-dark\":`#9CDCFE`},children:`Opportunity`}),_jsx(_components.span,{style:{color:`#1F2328`,\"--shiki-dark\":`#D4D4D4`},children:`.`}),_jsx(_components.span,{style:{color:`#1F2328`,\"--shiki-dark\":`#9CDCFE`},children:`Pricebook2Id`}),_jsx(_components.span,{style:{color:`#1F2328`,\"--shiki-dark\":`#D4D4D4`},children:`);`})]}),`\n`,_jsx(_components.span,{className:`line`,children:_jsx(_components.span,{style:{color:`#1F2328`,\"--shiki-dark\":`#D4D4D4`},children:` }`})}),`\n`,_jsx(_components.span,{className:`line`,children:_jsx(_components.span,{style:{color:`#1F2328`,\"--shiki-dark\":`#D4D4D4`},children:` }`})}),`\n`,_jsxs(_components.span,{className:`line`,children:[_jsx(_components.span,{style:{color:`#CF222E`,\"--shiki-dark\":`#569CD6`},children:` Map`}),_jsx(_components.span,{style:{color:`#1F2328`,\"--shiki-dark\":`#D4D4D4`},children:`\u003c`}),_jsx(_components.span,{style:{color:`#CF222E`,\"--shiki-dark\":`#569CD6`},children:`Id`}),_jsx(_components.span,{style:{color:`#1F2328`,\"--shiki-dark\":`#D4D4D4`},children:`, `}),_jsx(_components.span,{style:{color:`#CF222E`,\"--shiki-dark\":`#569CD6`},children:`Map`}),_jsx(_components.span,{style:{color:`#1F2328`,\"--shiki-dark\":`#D4D4D4`},children:`\u003c`}),_jsx(_components.span,{style:{color:`#CF222E`,\"--shiki-dark\":`#569CD6`},children:`Id`}),_jsx(_components.span,{style:{color:`#1F2328`,\"--shiki-dark\":`#D4D4D4`},children:`, `}),_jsx(_components.span,{style:{color:`#CF222E`,\"--shiki-dark\":`#569CD6`},children:`PricebookEntry`}),_jsx(_components.span,{style:{color:`#1F2328`,\"--shiki-dark\":`#D4D4D4`},children:`>> `}),_jsx(_components.span,{style:{color:`#953800`,\"--shiki-dark\":`#9CDCFE`},children:`pricesByPricebook`}),_jsx(_components.span,{style:{color:`#CF222E`,\"--shiki-dark\":`#D4D4D4`},children:` =`}),_jsx(_components.span,{style:{color:`#CF222E`,\"--shiki-dark\":`#C586C0`},children:` new`}),_jsx(_components.span,{style:{color:`#CF222E`,\"--shiki-dark\":`#569CD6`},children:` Map`}),_jsx(_components.span,{style:{color:`#1F2328`,\"--shiki-dark\":`#D4D4D4`},children:`\u003c`}),_jsx(_components.span,{style:{color:`#CF222E`,\"--shiki-dark\":`#569CD6`},children:`Id`}),_jsx(_components.span,{style:{color:`#1F2328`,\"--shiki-dark\":`#D4D4D4`},children:`, `}),_jsx(_components.span,{style:{color:`#CF222E`,\"--shiki-dark\":`#569CD6`},children:`Map`}),_jsx(_components.span,{style:{color:`#1F2328`,\"--shiki-dark\":`#D4D4D4`},children:`\u003c`}),_jsx(_components.span,{style:{color:`#CF222E`,\"--shiki-dark\":`#569CD6`},children:`Id`}),_jsx(_components.span,{style:{color:`#1F2328`,\"--shiki-dark\":`#D4D4D4`},children:`, `}),_jsx(_components.span,{style:{color:`#CF222E`,\"--shiki-dark\":`#569CD6`},children:`PricebookEntry`}),_jsx(_components.span,{style:{color:`#1F2328`,\"--shiki-dark\":`#D4D4D4`},children:`>>();`})]}),`\n`,_jsxs(_components.span,{className:`line`,children:[_jsx(_components.span,{style:{color:`#CF222E`,\"--shiki-dark\":`#C586C0`},children:` if`}),_jsx(_components.span,{style:{color:`#1F2328`,\"--shiki-dark\":`#D4D4D4`},children:` (`}),_jsx(_components.span,{style:{color:`#1F2328`,\"--shiki-dark\":`#9CDCFE`},children:`productIds`}),_jsx(_components.span,{style:{color:`#1F2328`,\"--shiki-dark\":`#D4D4D4`},children:`.`}),_jsx(_components.span,{style:{color:`#8250DF`,\"--shiki-dark\":`#DCDCAA`},children:`isEmpty`}),_jsx(_components.span,{style:{color:`#1F2328`,\"--shiki-dark\":`#D4D4D4`},children:`()) {`})]}),`\n`,_jsxs(_components.span,{className:`line`,children:[_jsx(_components.span,{style:{color:`#CF222E`,\"--shiki-dark\":`#C586C0`},children:` return`}),_jsx(_components.span,{style:{color:`#1F2328`,\"--shiki-dark\":`#9CDCFE`},children:` pricesByPricebook`}),_jsx(_components.span,{style:{color:`#1F2328`,\"--shiki-dark\":`#D4D4D4`},children:`;`})]}),`\n`,_jsx(_components.span,{className:`line`,children:_jsx(_components.span,{style:{color:`#1F2328`,\"--shiki-dark\":`#D4D4D4`},children:` }`})}),`\n`,_jsx(_components.span,{className:`line`,children:_jsx(_components.span,{style:{color:`#6E7781`,\"--shiki-dark\":`#6A9955`},children:` // One query for all of them, grouped by pricebook, then product`})}),`\n`,_jsxs(_components.span,{className:`line`,children:[_jsx(_components.span,{style:{color:`#CF222E`,\"--shiki-dark\":`#C586C0`},children:` for`}),_jsx(_components.span,{style:{color:`#1F2328`,\"--shiki-dark\":`#D4D4D4`},children:` (`}),_jsx(_components.span,{style:{color:`#CF222E`,\"--shiki-dark\":`#569CD6`},children:`PricebookEntry`}),_jsx(_components.span,{style:{color:`#953800`,\"--shiki-dark\":`#9CDCFE`},children:` entry`}),_jsx(_components.span,{style:{color:`#CF222E`,\"--shiki-dark\":`#D4D4D4`},children:` :`}),_jsx(_components.span,{style:{color:`#1F2328`,\"--shiki-dark\":`#D4D4D4`},children:` [`}),_jsx(_components.span,{style:{color:`#CF222E`,\"--shiki-dark\":`#D4D4D4`},children:`SELECT`}),_jsx(_components.span,{style:{color:`#CF222E`,\"--shiki-dark\":`#569CD6`},children:` Id`}),_jsx(_components.span,{style:{color:`#1F2328`,\"--shiki-dark\":`#D4D4D4`},children:`, `}),_jsx(_components.span,{style:{color:`#CF222E`,\"--shiki-dark\":`#569CD6`},children:`UnitPrice`}),_jsx(_components.span,{style:{color:`#1F2328`,\"--shiki-dark\":`#D4D4D4`},children:`, `}),_jsx(_components.span,{style:{color:`#CF222E`,\"--shiki-dark\":`#569CD6`},children:`Product2Id`}),_jsx(_components.span,{style:{color:`#1F2328`,\"--shiki-dark\":`#D4D4D4`},children:`, `}),_jsx(_components.span,{style:{color:`#CF222E`,\"--shiki-dark\":`#569CD6`},children:`Pricebook2Id`}),_jsx(_components.span,{style:{color:`#CF222E`,\"--shiki-dark\":`#D4D4D4`},children:` FROM`}),_jsx(_components.span,{style:{color:`#CF222E`,\"--shiki-dark\":`#569CD6`},children:` PricebookEntry`})]}),`\n`,_jsxs(_components.span,{className:`line`,children:[_jsx(_components.span,{style:{color:`#CF222E`,\"--shiki-dark\":`#D4D4D4`},children:` WHERE`}),_jsx(_components.span,{style:{color:`#CF222E`,\"--shiki-dark\":`#569CD6`},children:` Pricebook2Id`}),_jsx(_components.span,{style:{color:`#CF222E`,\"--shiki-dark\":`#D4D4D4`},children:` IN`}),_jsx(_components.span,{style:{color:`#CF222E`,\"--shiki-dark\":`#D4D4D4`},children:` :`}),_jsx(_components.span,{style:{color:`#953800`,\"--shiki-dark\":`#9CDCFE`},children:`pricebookIds`}),_jsx(_components.span,{style:{color:`#CF222E`,\"--shiki-dark\":`#D4D4D4`},children:` AND`}),_jsx(_components.span,{style:{color:`#CF222E`,\"--shiki-dark\":`#569CD6`},children:` Product2Id`}),_jsx(_components.span,{style:{color:`#CF222E`,\"--shiki-dark\":`#D4D4D4`},children:` IN`}),_jsx(_components.span,{style:{color:`#CF222E`,\"--shiki-dark\":`#D4D4D4`},children:` :`}),_jsx(_components.span,{style:{color:`#953800`,\"--shiki-dark\":`#9CDCFE`},children:`productIds`})]}),`\n`,_jsxs(_components.span,{className:`line`,children:[_jsx(_components.span,{style:{color:`#CF222E`,\"--shiki-dark\":`#D4D4D4`},children:` AND`}),_jsx(_components.span,{style:{color:`#CF222E`,\"--shiki-dark\":`#569CD6`},children:` IsActive`}),_jsx(_components.span,{style:{color:`#CF222E`,\"--shiki-dark\":`#D4D4D4`},children:` =`}),_jsx(_components.span,{style:{color:`#0550AE`,\"--shiki-dark\":`#569CD6`},children:` true`}),_jsx(_components.span,{style:{color:`#1F2328`,\"--shiki-dark\":`#D4D4D4`},children:`]) {`})]}),`\n`,_jsxs(_components.span,{className:`line`,children:[_jsx(_components.span,{style:{color:`#CF222E`,\"--shiki-dark\":`#C586C0`},children:` if`}),_jsx(_components.span,{style:{color:`#1F2328`,\"--shiki-dark\":`#D4D4D4`},children:` (`}),_jsx(_components.span,{style:{color:`#CF222E`,\"--shiki-dark\":`#D4D4D4`},children:`!`}),_jsx(_components.span,{style:{color:`#1F2328`,\"--shiki-dark\":`#9CDCFE`},children:`pricesByPricebook`}),_jsx(_components.span,{style:{color:`#1F2328`,\"--shiki-dark\":`#D4D4D4`},children:`.`}),_jsx(_components.span,{style:{color:`#8250DF`,\"--shiki-dark\":`#DCDCAA`},children:`containsKey`}),_jsx(_components.span,{style:{color:`#1F2328`,\"--shiki-dark\":`#D4D4D4`},children:`(`}),_jsx(_components.span,{style:{color:`#1F2328`,\"--shiki-dark\":`#9CDCFE`},children:`entry`}),_jsx(_components.span,{style:{color:`#1F2328`,\"--shiki-dark\":`#D4D4D4`},children:`.`}),_jsx(_components.span,{style:{color:`#1F2328`,\"--shiki-dark\":`#9CDCFE`},children:`Pricebook2Id`}),_jsx(_components.span,{style:{color:`#1F2328`,\"--shiki-dark\":`#D4D4D4`},children:`)) {`})]}),`\n`,_jsxs(_components.span,{className:`line`,children:[_jsx(_components.span,{style:{color:`#1F2328`,\"--shiki-dark\":`#9CDCFE`},children:` pricesByPricebook`}),_jsx(_components.span,{style:{color:`#1F2328`,\"--shiki-dark\":`#D4D4D4`},children:`.`}),_jsx(_components.span,{style:{color:`#8250DF`,\"--shiki-dark\":`#DCDCAA`},children:`put`}),_jsx(_components.span,{style:{color:`#1F2328`,\"--shiki-dark\":`#D4D4D4`},children:`(`}),_jsx(_components.span,{style:{color:`#1F2328`,\"--shiki-dark\":`#9CDCFE`},children:`entry`}),_jsx(_components.span,{style:{color:`#1F2328`,\"--shiki-dark\":`#D4D4D4`},children:`.`}),_jsx(_components.span,{style:{color:`#1F2328`,\"--shiki-dark\":`#9CDCFE`},children:`Pricebook2Id`}),_jsx(_components.span,{style:{color:`#1F2328`,\"--shiki-dark\":`#D4D4D4`},children:`, `}),_jsx(_components.span,{style:{color:`#CF222E`,\"--shiki-dark\":`#C586C0`},children:`new`}),_jsx(_components.span,{style:{color:`#CF222E`,\"--shiki-dark\":`#569CD6`},children:` Map`}),_jsx(_components.span,{style:{color:`#1F2328`,\"--shiki-dark\":`#D4D4D4`},children:`\u003c`}),_jsx(_components.span,{style:{color:`#CF222E`,\"--shiki-dark\":`#569CD6`},children:`Id`}),_jsx(_components.span,{style:{color:`#1F2328`,\"--shiki-dark\":`#D4D4D4`},children:`, `}),_jsx(_components.span,{style:{color:`#CF222E`,\"--shiki-dark\":`#569CD6`},children:`PricebookEntry`}),_jsx(_components.span,{style:{color:`#1F2328`,\"--shiki-dark\":`#D4D4D4`},children:`>());`})]}),`\n`,_jsx(_components.span,{className:`line`,children:_jsx(_components.span,{style:{color:`#1F2328`,\"--shiki-dark\":`#D4D4D4`},children:` }`})}),`\n`,_jsxs(_components.span,{className:`line`,children:[_jsx(_components.span,{style:{color:`#1F2328`,\"--shiki-dark\":`#9CDCFE`},children:` pricesByPricebook`}),_jsx(_components.span,{style:{color:`#1F2328`,\"--shiki-dark\":`#D4D4D4`},children:`.`}),_jsx(_components.span,{style:{color:`#8250DF`,\"--shiki-dark\":`#DCDCAA`},children:`get`}),_jsx(_components.span,{style:{color:`#1F2328`,\"--shiki-dark\":`#D4D4D4`},children:`(`}),_jsx(_components.span,{style:{color:`#1F2328`,\"--shiki-dark\":`#9CDCFE`},children:`entry`}),_jsx(_components.span,{style:{color:`#1F2328`,\"--shiki-dark\":`#D4D4D4`},children:`.`}),_jsx(_components.span,{style:{color:`#1F2328`,\"--shiki-dark\":`#9CDCFE`},children:`Pricebook2Id`}),_jsx(_components.span,{style:{color:`#1F2328`,\"--shiki-dark\":`#D4D4D4`},children:`).`}),_jsx(_components.span,{style:{color:`#8250DF`,\"--shiki-dark\":`#DCDCAA`},children:`put`}),_jsx(_components.span,{style:{color:`#1F2328`,\"--shiki-dark\":`#D4D4D4`},children:`(`}),_jsx(_components.span,{style:{color:`#1F2328`,\"--shiki-dark\":`#9CDCFE`},children:`entry`}),_jsx(_components.span,{style:{color:`#1F2328`,\"--shiki-dark\":`#D4D4D4`},children:`.`}),_jsx(_components.span,{style:{color:`#1F2328`,\"--shiki-dark\":`#9CDCFE`},children:`Product2Id`}),_jsx(_components.span,{style:{color:`#1F2328`,\"--shiki-dark\":`#D4D4D4`},children:`, `}),_jsx(_components.span,{style:{color:`#1F2328`,\"--shiki-dark\":`#9CDCFE`},children:`entry`}),_jsx(_components.span,{style:{color:`#1F2328`,\"--shiki-dark\":`#D4D4D4`},children:`);`})]}),`\n`,_jsx(_components.span,{className:`line`,children:_jsx(_components.span,{style:{color:`#1F2328`,\"--shiki-dark\":`#D4D4D4`},children:` }`})}),`\n`,_jsxs(_components.span,{className:`line`,children:[_jsx(_components.span,{style:{color:`#CF222E`,\"--shiki-dark\":`#C586C0`},children:` return`}),_jsx(_components.span,{style:{color:`#1F2328`,\"--shiki-dark\":`#9CDCFE`},children:` pricesByPricebook`}),_jsx(_components.span,{style:{color:`#1F2328`,\"--shiki-dark\":`#D4D4D4`},children:`;`})]}),`\n`,_jsx(_components.span,{className:`line`,children:_jsx(_components.span,{style:{color:`#1F2328`,\"--shiki-dark\":`#D4D4D4`},children:`}`})}),`\n`]})})}),_jsx(_components.p,{children:`The assistant edits the code but doesn’t compile or test it. Run the tests in a sandbox before you deploy the hotfix.`}),_jsx(Frame,{caption:`The Fix, Based on What Production Did - Claude Code`,children:_jsx(OptimizedImage,{loading:`lazy`,src:`https://mintcdn.com/germain-ux/EcG-bHGMKXvr8rBS/images/main/salesforce-release-regression-analysis/code-fix.png?fit=max\u0026auto=format\u0026n=EcG-bHGMKXvr8rBS\u0026q=85\u0026s=8d064107704163bdb08879802b5027da`,alt:`Claude Code answer: what commit 1b46bb0 changed, the bulk PricebookEntry query replaced by one query per product without the IsActive filter, and the fix, loadPrices at OpportunityPricingService.cls line 209 running one query with Pricebook2Id IN and Product2Id IN and IsActive true, called once from recalculate at line 85`,\"data-og-width\":`972`,width:`972`,\"data-og-height\":`991`,height:`991`,\"data-path\":`images/main/salesforce-release-regression-analysis/code-fix.png`,\"data-optimize\":`true`,\"data-opv\":`3`,srcset:`https://mintcdn.com/germain-ux/EcG-bHGMKXvr8rBS/images/main/salesforce-release-regression-analysis/code-fix.png?w=280\u0026fit=max\u0026auto=format\u0026n=EcG-bHGMKXvr8rBS\u0026q=85\u0026s=fd283320d59feb9e23518ff6d75c8c2a 280w, https://mintcdn.com/germain-ux/EcG-bHGMKXvr8rBS/images/main/salesforce-release-regression-analysis/code-fix.png?w=560\u0026fit=max\u0026auto=format\u0026n=EcG-bHGMKXvr8rBS\u0026q=85\u0026s=ee214248a4c2496b5d3e293f97a9486c 560w, https://mintcdn.com/germain-ux/EcG-bHGMKXvr8rBS/images/main/salesforce-release-regression-analysis/code-fix.png?w=840\u0026fit=max\u0026auto=format\u0026n=EcG-bHGMKXvr8rBS\u0026q=85\u0026s=35be3f94f203e92b5569fc382fde8c0a 840w, https://mintcdn.com/germain-ux/EcG-bHGMKXvr8rBS/images/main/salesforce-release-regression-analysis/code-fix.png?w=1100\u0026fit=max\u0026auto=format\u0026n=EcG-bHGMKXvr8rBS\u0026q=85\u0026s=bee906edd058aa9bfab97dd25aeeb105 1100w, https://mintcdn.com/germain-ux/EcG-bHGMKXvr8rBS/images/main/salesforce-release-regression-analysis/code-fix.png?w=1650\u0026fit=max\u0026auto=format\u0026n=EcG-bHGMKXvr8rBS\u0026q=85\u0026s=cba3c69c1323d9b5038d89b6973a9fd4 1650w, https://mintcdn.com/germain-ux/EcG-bHGMKXvr8rBS/images/main/salesforce-release-regression-analysis/code-fix.png?w=2500\u0026fit=max\u0026auto=format\u0026n=EcG-bHGMKXvr8rBS\u0026q=85\u0026s=47fec4eaa5da5950782742f9b0ea06cf 2500w`})})]}),_jsxs(Step,{title:`Confirm the fix`,children:[_jsxs(_components.p,{children:[`After the hotfix is deployed at 14:40, ask: `,_jsx(_components.em,{children:`“Are Opportunity saves back to normal since the 14:40 deployment? Any more limit exceptions?”`})]}),_jsxs(_components.p,{children:[`In this example, Apex executions are back to about half a second from the hotfix on, no execution runs more than 7 queries, and no `,_jsx(_components.code,{children:`LimitException`}),` has been thrown since, up to the latest data on Nov 17. In the Workspace, the execution times drop at the hotfix marker on the chart above.`]}),_jsx(Frame,{caption:`Saves Before and After the Hotfix - Claude Code`,children:_jsx(OptimizedImage,{loading:`lazy`,src:`https://mintcdn.com/germain-ux/EcG-bHGMKXvr8rBS/images/main/salesforce-release-regression-analysis/fix-check.png?fit=max\u0026auto=format\u0026n=EcG-bHGMKXvr8rBS\u0026q=85\u0026s=ee6e672984f59b04ad9625dc14ea8367`,alt:`Claude Code answer: saves back to normal after the 14:40 UTC deploy, with Apex executions at 0.2 to 0.57 seconds and at most 7 SOQL queries from Nov 13 afternoon to Nov 17, against 1.9 to 3.7 seconds and 26 to 34 queries during the incident, and no LimitException since`,\"data-og-width\":`1115`,width:`1115`,\"data-og-height\":`905`,height:`905`,\"data-path\":`images/main/salesforce-release-regression-analysis/fix-check.png`,\"data-optimize\":`true`,\"data-opv\":`3`,srcset:`https://mintcdn.com/germain-ux/EcG-bHGMKXvr8rBS/images/main/salesforce-release-regression-analysis/fix-check.png?w=280\u0026fit=max\u0026auto=format\u0026n=EcG-bHGMKXvr8rBS\u0026q=85\u0026s=8e52ea9195d5de6a4c5e128564401685 280w, https://mintcdn.com/germain-ux/EcG-bHGMKXvr8rBS/images/main/salesforce-release-regression-analysis/fix-check.png?w=560\u0026fit=max\u0026auto=format\u0026n=EcG-bHGMKXvr8rBS\u0026q=85\u0026s=643848ae2478ff7e7e5f507ae7b0a0aa 560w, https://mintcdn.com/germain-ux/EcG-bHGMKXvr8rBS/images/main/salesforce-release-regression-analysis/fix-check.png?w=840\u0026fit=max\u0026auto=format\u0026n=EcG-bHGMKXvr8rBS\u0026q=85\u0026s=cad56513f4a6cb8cbd0a8a157edb0502 840w, https://mintcdn.com/germain-ux/EcG-bHGMKXvr8rBS/images/main/salesforce-release-regression-analysis/fix-check.png?w=1100\u0026fit=max\u0026auto=format\u0026n=EcG-bHGMKXvr8rBS\u0026q=85\u0026s=0685e6369f287931d7edc82b0bf484a7 1100w, https://mintcdn.com/germain-ux/EcG-bHGMKXvr8rBS/images/main/salesforce-release-regression-analysis/fix-check.png?w=1650\u0026fit=max\u0026auto=format\u0026n=EcG-bHGMKXvr8rBS\u0026q=85\u0026s=f629720cc2129e104afcef4fa6ee9445 1650w, https://mintcdn.com/germain-ux/EcG-bHGMKXvr8rBS/images/main/salesforce-release-regression-analysis/fix-check.png?w=2500\u0026fit=max\u0026auto=format\u0026n=EcG-bHGMKXvr8rBS\u0026q=85\u0026s=cc9bc4bf3e80f8721d2f9be4d1e542ae 2500w`})}),_jsxs(_components.p,{children:[`Hover the 14:40 marker to see that the hotfix changed only `,_jsx(_components.code,{children:`OpportunityPricingService`}),`. To hover a deployment marker that an exception marker covers, click `,_jsx(_components.strong,{children:`Salesforce Log Apex Unexpected Exception`}),` in the chart legend to hide the exceptions.`]}),_jsx(Frame,{caption:`Hotfix Marker Details - GermainUX`,children:_jsx(OptimizedImage,{loading:`lazy`,src:`https://mintcdn.com/germain-ux/EcG-bHGMKXvr8rBS/images/main/salesforce-release-regression-analysis/hotfix-marker-details.png?fit=max\u0026auto=format\u0026n=EcG-bHGMKXvr8rBS\u0026q=85\u0026s=5d825c13532b8ed6cea2bb6197de56c6`,alt:`Apex Execution analysis with the 14:40 UTC Deployment Run marker on Nov 13 hovered and the exception markers hidden: a deploy of OpportunityPricingService only, status Succeeded, with the details listing one component`,\"data-og-width\":`1440`,width:`1440`,\"data-og-height\":`760`,height:`760`,\"data-path\":`images/main/salesforce-release-regression-analysis/hotfix-marker-details.png`,\"data-optimize\":`true`,\"data-opv\":`3`,srcset:`https://mintcdn.com/germain-ux/EcG-bHGMKXvr8rBS/images/main/salesforce-release-regression-analysis/hotfix-marker-details.png?w=280\u0026fit=max\u0026auto=format\u0026n=EcG-bHGMKXvr8rBS\u0026q=85\u0026s=872a16053721ba0343767909cc1c9add 280w, https://mintcdn.com/germain-ux/EcG-bHGMKXvr8rBS/images/main/salesforce-release-regression-analysis/hotfix-marker-details.png?w=560\u0026fit=max\u0026auto=format\u0026n=EcG-bHGMKXvr8rBS\u0026q=85\u0026s=0e8d8966deac94432fc1261ca5a3c6f3 560w, https://mintcdn.com/germain-ux/EcG-bHGMKXvr8rBS/images/main/salesforce-release-regression-analysis/hotfix-marker-details.png?w=840\u0026fit=max\u0026auto=format\u0026n=EcG-bHGMKXvr8rBS\u0026q=85\u0026s=967fcac7d78dc9d7a8f7ae21112a2bd3 840w, https://mintcdn.com/germain-ux/EcG-bHGMKXvr8rBS/images/main/salesforce-release-regression-analysis/hotfix-marker-details.png?w=1100\u0026fit=max\u0026auto=format\u0026n=EcG-bHGMKXvr8rBS\u0026q=85\u0026s=86fbafac49272ec25ea72bd55f5cc912 1100w, https://mintcdn.com/germain-ux/EcG-bHGMKXvr8rBS/images/main/salesforce-release-regression-analysis/hotfix-marker-details.png?w=1650\u0026fit=max\u0026auto=format\u0026n=EcG-bHGMKXvr8rBS\u0026q=85\u0026s=56cbff0aa74c4a853c05920cbb9cd65f 1650w, https://mintcdn.com/germain-ux/EcG-bHGMKXvr8rBS/images/main/salesforce-release-regression-analysis/hotfix-marker-details.png?w=2500\u0026fit=max\u0026auto=format\u0026n=EcG-bHGMKXvr8rBS\u0026q=85\u0026s=47138f16683d9e8a84b2d2ff167a4cd1 2500w`})})]})]}),`\n`,_jsxs(_components.p,{children:[`The developer fixed the cause, not the symptom, without downloading a log file or leaving the IDE. To see the same slow save next to a normal one in the Workspace, see `,_jsx(_components.a,{href:`/integrations/salesforce-monitoring/salesforce-engine-monitoring-deployment#example-compare-a-slow-save-with-a-normal-one`,children:`Compare a Slow Save with a Normal One`}),`.`]}),`\n`,_jsx(Heading,{level:`2`,id:`alert-and-act`,children:`Alert and Act`}),`\n`,_jsx(_components.p,{children:`Users noticed this release before the team did. To catch the next one sooner:`}),`\n`,_jsx(`div`,{className:`gx-list`,children:_jsxs(_components.ul,{children:[`\n`,_jsxs(_components.li,{children:[_jsx(_components.strong,{children:_jsx(_components.a,{href:`/analytics/slas`,children:`SLAs`})}),` and `,_jsx(_components.a,{href:`/analytics/outlier-detection`,children:`outlier detection`}),` on the duration of Apex executions, per entry point, so a release that slows one save raises an alert`]}),`\n`,_jsxs(_components.li,{children:[_jsx(_components.strong,{children:_jsx(_components.a,{href:`/automation/notifications/create-an-alert`,children:`Alerts`})}),` on new Apex exceptions such as `,_jsx(_components.code,{children:`System.LimitException`}),`, by email, `,_jsx(_components.a,{href:`/automation/notifications/microsoft-teams-notification`,children:`Microsoft Teams`}),` or `,_jsx(_components.a,{href:`/automation/notifications/slack`,children:`Slack`})]}),`\n`,_jsxs(_components.li,{children:[_jsx(_components.strong,{children:_jsx(_components.a,{href:`/integrations/salesforce-monitoring/salesforce-audit-monitoring#configure-alerts`,children:`Alerts on Setup changes`})}),` for Apex code changed in production, so the team knows a release landed`]}),`\n`,_jsxs(_components.li,{children:[_jsx(_components.strong,{children:`A post-release check in your IDE:`}),` right after each deployment, ask the assistant to compare the classes it changed with the same hours on the previous days`]}),`\n`]})}),`\n`,_jsx(Heading,{level:`2`,id:`set-it-up`,children:`Set It Up`}),`\n`,_jsx(_components.p,{children:`Each step adds value on its own. The assistant can answer more questions the more of the org GermainUX monitors.`}),`\n`,_jsxs(Steps,{children:[_jsx(Step,{title:`Monitor the Salesforce org`,children:_jsxs(_components.p,{children:[`Run the Salesforce wizard to `,_jsx(_components.a,{href:`/integrations/salesforce-monitoring/salesforce-engine-monitoring-deployment`,children:`deploy Salesforce Engine monitoring`}),`. It collects Event Monitoring logs, deployments, Setup changes, code and instance status. Event Monitoring data arrives about an hour after each hour ends, and deployments with the next Audit Monitor run. See `,_jsx(_components.a,{href:`/integrations/salesforce-monitoring/salesforce-engine-monitoring-deployment#collection-schedule-and-api-usage`,children:`Collection Schedule and API Usage`}),`.`]})}),_jsx(Step,{title:`Collect debug logs`,children:_jsxs(_components.p,{children:[`Set a trace flag in Salesforce on the user that reproduces the problem, then let `,_jsx(_components.a,{href:`/integrations/salesforce-monitoring/salesforce-debug-log-monitoring`,children:`Debug Log Monitoring`}),` collect the logs. GermainUX collects only the debug logs Salesforce generates.`]})}),_jsx(Step,{title:`Show deployments on the timeline`,children:_jsxs(_components.p,{children:[_jsx(_components.a,{href:`/analytics/kpis/kpi-relationships#configuration`,children:`Configure KPI relationships`}),` from `,_jsx(_components.strong,{children:`Salesforce Log Apex Execution`}),` and your other Apex KPIs to `,_jsx(_components.strong,{children:`Deployment Run`}),`, shown as `,_jsx(_components.a,{href:`/analytics/kpis/kpi-relationships#marker`,children:`markers`}),`. Every chart of those KPIs then shows when a deployment landed.`]})}),_jsx(Step,{title:`Enable the MCP Server for developers`,children:_jsxs(_components.p,{children:[_jsx(_components.a,{href:`/integrations/mcp-server/enable-the-mcp-server`,children:`Enable the MCP Server`}),` and give the developers a GermainUX account with access to the org’s data. Every tool call runs as the signed-in user, so developers see only what their account allows. See `,_jsx(_components.a,{href:`/integrations/mcp-server/enable-the-mcp-server#what-users-can-see-and-do`,children:`What users can see and do`}),`.`]})}),_jsx(Step,{title:`Connect the coding assistant`,children:_jsxs(_components.p,{children:[_jsx(_components.a,{href:`/integrations/mcp-server/connect-an-ai-client`,children:`Connect the coding assistant`}),` the developers use, such as Claude Code, Cursor or GitHub Copilot in VS Code, to the GermainUX MCP Server. Open the SFDX project in the same IDE, so the assistant reads production data and the code side by side.`]})})]}),`\n`,_jsx(Heading,{level:`2`,id:`additional-resources`,children:`Additional Resources`}),`\n`,_jsxs(CardGroup,{cols:3,children:[_jsx(Card,{title:`MCP Server`,icon:`plug`,href:`/integrations/mcp-server`,children:_jsx(_components.p,{children:`Connect AI assistants to GermainUX`})}),_jsx(Card,{title:`Salesforce Engine Monitoring`,icon:`cloud`,href:`/integrations/salesforce-monitoring/salesforce-engine-monitoring-deployment`,children:_jsx(_components.p,{children:`Deploy monitoring through the Salesforce APIs`})}),_jsx(Card,{title:`Use Cases`,icon:`lightbulb`,href:`/use-cases/overview`,children:_jsx(_components.p,{children:`More Use Cases`})})]}),`\n`,_jsx(Heading,{level:`2`,id:`get-help`,children:`Get Help`}),`\n`,_jsx(_components.p,{children:`Every Salesforce team has its own release process, trace-flag habits and coding tools. The GermainUX team can help you deploy Salesforce Engine monitoring, bring your deployments onto the timeline, and set up the MCP Server for your developers.`}),`\n`,_jsxs(CardGroup,{cols:2,children:[_jsx(Card,{title:`Contact GermainUX Support`,icon:`headset`,href:`/getting-started/support`,children:_jsx(_components.p,{children:`The GermainUX team helps you get up and running faster, empower your team, turn data into actionable insights, and optimize performance to deliver measurable business outcomes.`})}),_jsx(Card,{title:`Can't Find What You Need?`,icon:`magnifying-glass`,children:_jsxs(_components.p,{children:[`Search all GermainUX docs with `,_jsx(_components.strong,{children:`Ctrl + K`}),`, or use the feedback buttons at the bottom of this page to tell us what is missing.`]})})]}),`\n`,_jsx(_MdxComponentBoundary,{name:`GxFooter`,children:_jsx(GxFooter,{})}),`\n`,_jsx(_MdxComponentBoundary,{name:`GxStyle`,children:_jsx(GxStyle,{})})]})}function MDXContent(props={}){const{wrapper:MDXLayout}={..._provideComponents(),...props.components};return MDXLayout?_jsx(MDXLayout,{...props,children:_jsx(_createMdxContent,{...props})}):_createMdxContent(props)}return{GxFooter,GxStyle,default:MDXContent};function _missingMdxReference(id,component){throw new Error(`Expected `+(component?`component`:`object`)+\" `\"+id+\"` to be defined: you likely forgot to import, pass, or provide it.\")}","frontmatter":{},"scope":{"config":{},"pageMetadata":{"title":"Find and Fix a Salesforce Release Regression from Your IDE with the GermainUX MCP Server","sidebarTitle":"Release Regression Diagnosis \u0026 Fix (SFDC, MCP)","description":"Ask your coding assistant what a Salesforce release broke in production, find the Apex line behind it, fix it in your repo and confirm the fix, in one conversation.","icon":"lightbulb","keywords":["Salesforce release regression","Too many SOQL queries: 101","SOQL in a loop","Apex governor limits","slow Opportunity save","Salesforce debug logs","MCP Server","Claude Code Salesforce","AI coding assistant production data","root cause analysis"],"href":"/use-cases/salesforce-release-regression-analysis"}}},"mdxSourceWithNoJs":null,"noJsSplices":[[136,153,"Style=()=>null;const GxFooter=()=>_jsx(`"],[255,12837,""],[77818,77838,"Style,GxFooter,defau"]]},"mdxExtracts":{"tableOfContents":[{"title":"Overview","slug":"overview","depth":2,"children":[{"title":"Questions It Answers","slug":"questions-it-answers","depth":3,"children":[]}]},{"title":"What GermainUX Watches","slug":"what-germainux-watches","depth":2,"children":[]},{"title":"Find the Cause","slug":"find-the-cause","depth":2,"children":[{"title":"Example: A Release Puts a SOQL Query in a Loop","slug":"example-a-release-puts-a-soql-query-in-a-loop","depth":3,"children":[]}]},{"title":"Alert and Act","slug":"alert-and-act","depth":2,"children":[]},{"title":"Set It Up","slug":"set-it-up","depth":2,"children":[]},{"title":"Additional Resources","slug":"additional-resources","depth":2,"children":[]},{"title":"Get Help","slug":"get-help","depth":2,"children":[]}],"codeExamples":{}},"jsLinks":[],"subdomain":"germain-ux","siteName":"GermainUX Docs","title":"Find and Fix a Salesforce Release Regression from Your IDE with the GermainUX MCP Server - GermainUX Docs","navMaps":{"firstHrefInVersion":{},"firstHrefInLanguage":{}},"lastModified":"2026-11-20T10:04:43.576Z","originalFileLocation":"use-cases/salesforce-release-regression-analysis.mdx"},"headHtml":"\u003cscript data-mint-head>(function(){var d=document.documentElement,p=null;if(!p){try{p=localStorage.getItem(\"isDarkMode\")}catch(e){}if(p==='true')p='dark';else if(p==='false')p='light';if(p!=='light'\u0026\u0026p!=='dark'\u0026\u0026p!=='system')p=\"light\"}var r=p==='system'?(matchMedia(\"(prefers-color-scheme: dark)\").matches?'dark':'light'):p;d.classList.remove(r==='dark'?'light':'dark');d.classList.add(r);d.setAttribute(\"data-theme-preference\",p)})();\u003c/script>\u003cmeta data-mint-head name=\"description\" content=\"Ask your coding assistant what a Salesforce release broke in production, find the Apex line behind it, fix it in your repo and confirm the fix, in one conversation.\">\u003cmeta data-mint-head name=\"application-name\" content=\"GermainUX Docs\">\u003cmeta data-mint-head name=\"generator\" content=\"Mintlify\">\u003clink data-mint-head rel=\"icon\" type=\"image/png\" sizes=\"192x192\" href=\"/mintlify-assets/_mintlify/favicons/germain-ux/_Kw8Od9IpYFcCZNX/_generated/favicon/android-chrome-192x192.png\" media=\"(prefers-color-scheme: light)\">\u003clink data-mint-head rel=\"apple-touch-icon\" type=\"image/png\" sizes=\"180x180\" href=\"/mintlify-assets/_mintlify/favicons/germain-ux/_Kw8Od9IpYFcCZNX/_generated/favicon/apple-touch-icon.png\">\u003clink data-mint-head rel=\"icon\" type=\"image/png\" sizes=\"16x16\" href=\"/mintlify-assets/_mintlify/favicons/germain-ux/_Kw8Od9IpYFcCZNX/_generated/favicon/favicon-16x16.png\" media=\"(prefers-color-scheme: light)\">\u003clink data-mint-head rel=\"icon\" type=\"image/png\" sizes=\"32x32\" href=\"/mintlify-assets/_mintlify/favicons/germain-ux/_Kw8Od9IpYFcCZNX/_generated/favicon/favicon-32x32.png\" media=\"(prefers-color-scheme: light)\">\u003clink data-mint-head rel=\"shortcut icon\" type=\"image/x-icon\" href=\"/mintlify-assets/_mintlify/favicons/germain-ux/_Kw8Od9IpYFcCZNX/_generated/favicon/favicon.ico\" media=\"(prefers-color-scheme: light)\">\u003clink data-mint-head rel=\"icon\" type=\"image/png\" sizes=\"192x192\" href=\"/mintlify-assets/_mintlify/favicons/germain-ux/_Kw8Od9IpYFcCZNX/_generated/favicon-dark/android-chrome-192x192.png\" media=\"(prefers-color-scheme: dark)\">\u003clink data-mint-head rel=\"icon\" type=\"image/png\" sizes=\"16x16\" href=\"/mintlify-assets/_mintlify/favicons/germain-ux/_Kw8Od9IpYFcCZNX/_generated/favicon-dark/favicon-16x16.png\" media=\"(prefers-color-scheme: dark)\">\u003clink data-mint-head rel=\"icon\" type=\"image/png\" sizes=\"32x32\" href=\"/mintlify-assets/_mintlify/favicons/germain-ux/_Kw8Od9IpYFcCZNX/_generated/favicon-dark/favicon-32x32.png\" media=\"(prefers-color-scheme: dark)\">\u003clink data-mint-head rel=\"shortcut icon\" type=\"image/x-icon\" href=\"/mintlify-assets/_mintlify/favicons/germain-ux/_Kw8Od9IpYFcCZNX/_generated/favicon-dark/favicon.ico\" media=\"(prefers-color-scheme: dark)\">\u003cmeta data-mint-head property=\"og:title\" content=\"Find and Fix a Salesforce Release Regression from Your IDE with the GermainUX MCP Server - GermainUX Docs\">\u003cmeta data-mint-head property=\"og:description\" content=\"Ask your coding assistant what a Salesforce release broke in production, find the Apex line behind it, fix it in your repo and confirm the fix, in one conversation.\">\u003cmeta data-mint-head property=\"og:site_name\" content=\"GermainUX Docs\">\u003cmeta data-mint-head property=\"og:url\" content=\"https://docs.germainux.com/use-cases/salesforce-release-regression-analysis\">\u003cmeta data-mint-head property=\"og:type\" content=\"website\">\u003cmeta data-mint-head property=\"og:image\" content=\"https://germain-ux.mintlify.site/_mintlify/api/og/v2?division=Use+Cases\u0026amp;title=Find+and+Fix+a+Salesforce+Release+Regression+from+Your+IDE+with+the+GermainUX+MCP+Server\u0026amp;description=Ask+your+coding+assistant+what+a+Salesforce+release+broke+in+production%2C+find+the+Apex+line+behind+it%2C+fix+it+in+your+repo+and+confirm+the+fix%2C+in+one+conversat\u0026amp;theme=f29cc06a49affea3bfdf77b7\u0026amp;signature=7278b9a61d5bada244bbd53a48714093ce07352bf410fcacd53f1477973f2191\">\u003cmeta data-mint-head property=\"og:image:width\" content=\"1200\">\u003cmeta data-mint-head property=\"og:image:height\" content=\"630\">\u003cmeta data-mint-head name=\"twitter:card\" content=\"summary_large_image\">\u003cmeta data-mint-head name=\"twitter:title\" content=\"Find and Fix a Salesforce Release Regression from Your IDE with the GermainUX MCP Server - GermainUX Docs\">\u003cmeta data-mint-head name=\"twitter:description\" content=\"Ask your coding assistant what a Salesforce release broke in production, find the Apex line behind it, fix it in your repo and confirm the fix, in one conversation.\">\u003cmeta data-mint-head name=\"twitter:image\" content=\"https://germain-ux.mintlify.site/_mintlify/api/og/v2?division=Use+Cases\u0026amp;title=Find+and+Fix+a+Salesforce+Release+Regression+from+Your+IDE+with+the+GermainUX+MCP+Server\u0026amp;description=Ask+your+coding+assistant+what+a+Salesforce+release+broke+in+production%2C+find+the+Apex+line+behind+it%2C+fix+it+in+your+repo+and+confirm+the+fix%2C+in+one+conversat\u0026amp;theme=f29cc06a49affea3bfdf77b7\u0026amp;signature=7278b9a61d5bada244bbd53a48714093ce07352bf410fcacd53f1477973f2191\">\u003cmeta data-mint-head name=\"twitter:image:width\" content=\"1200\">\u003cmeta data-mint-head name=\"twitter:image:height\" content=\"630\">\u003cmeta data-mint-head name=\"msapplication-config\" content=\"/mintlify-assets/_mintlify/favicons/germain-ux/_Kw8Od9IpYFcCZNX/_generated/favicon/browserconfig.xml\">\u003cmeta data-mint-head name=\"apple-mobile-web-app-title\" content=\"GermainUX Docs\">\u003cmeta data-mint-head name=\"msapplication-TileColor\" content=\"#2E7DF2\">\u003cmeta data-mint-head name=\"og:locale\" content=\"en_US\">\u003clink data-mint-head rel=\"canonical\" href=\"https://docs.germainux.com/use-cases/salesforce-release-regression-analysis\">\u003clink data-mint-head rel=\"alternate\" type=\"application/xml\" href=\"/sitemap.xml\">\u003clink data-mint-head rel=\"alternate\" type=\"text/markdown\" href=\"/use-cases/salesforce-release-regression-analysis.md\">\u003cscript data-mint-head type=\"application/ld+json\">{\"@context\":\"https://schema.org\",\"@graph\":[{\"@type\":\"Organization\",\"@id\":\"https://docs.germainux.com/#organization\",\"name\":\"GermainUX Docs\",\"url\":\"https://docs.germainux.com\",\"logo\":{\"@type\":\"ImageObject\",\"url\":\"https://mintcdn.com/germain-ux/ok7-BbqwVV0uk3t8/images/logo-light.png?fit=max\u0026auto=format\u0026n=ok7-BbqwVV0uk3t8\u0026q=85\u0026s=3cfe3238ac55802e43da3e4da5806f0d\"}},{\"@type\":\"WebSite\",\"@id\":\"https://docs.germainux.com#website\",\"name\":\"GermainUX Docs\",\"url\":\"https://docs.germainux.com\",\"publisher\":{\"@id\":\"https://docs.germainux.com/#organization\"}},{\"@type\":\"WebPage\",\"@id\":\"https://docs.germainux.com/use-cases/salesforce-release-regression-analysis#webpage\",\"url\":\"https://docs.germainux.com/use-cases/salesforce-release-regression-analysis\",\"name\":\"Find and Fix a Salesforce Release Regression from Your IDE with the GermainUX MCP Server\",\"description\":\"Ask your coding assistant what a Salesforce release broke in production, find the Apex line behind it, fix it in your repo and confirm the fix, in one conversation.\",\"dateModified\":\"2026-11-20T10:04:43.576Z\",\"isPartOf\":{\"@id\":\"https://docs.germainux.com#website\"},\"breadcrumb\":{\"@id\":\"https://docs.germainux.com/use-cases/salesforce-release-regression-analysis#breadcrumb\"}},{\"@type\":\"BreadcrumbList\",\"@id\":\"https://docs.germainux.com/use-cases/salesforce-release-regression-analysis#breadcrumb\",\"itemListElement\":[{\"@type\":\"ListItem\",\"position\":1,\"name\":\"Use Cases\",\"item\":\"https://docs.germainux.com/use-cases/overview\"},{\"@type\":\"ListItem\",\"position\":2,\"name\":\"Find and Fix a Salesforce Release Regression from Your IDE with the GermainUX MCP Server\",\"item\":\"https://docs.germainux.com/use-cases/salesforce-release-regression-analysis\"}]},{\"@type\":[\"Article\",\"TechArticle\"],\"@id\":\"https://docs.germainux.com/use-cases/salesforce-release-regression-analysis#article\",\"headline\":\"Find and Fix a Salesforce Release Regression from Your IDE with the GermainUX MCP Server\",\"name\":\"Find and Fix a Salesforce Release Regression from Your IDE with the GermainUX MCP Server\",\"description\":\"Ask your coding assistant what a Salesforce release broke in production, find the Apex line behind it, fix it in your repo and confirm the fix, in one conversation.\",\"url\":\"https://docs.germainux.com/use-cases/salesforce-release-regression-analysis\",\"mainEntityOfPage\":{\"@id\":\"https://docs.germainux.com/use-cases/salesforce-release-regression-analysis#webpage\"},\"dateModified\":\"2026-11-20T10:04:43.576Z\",\"keywords\":\"Salesforce release regression, Too many SOQL queries: 101, SOQL in a loop, Apex governor limits, slow Opportunity save, Salesforce debug logs, MCP Server, Claude Code Salesforce, AI coding assistant production data, root cause analysis\",\"publisher\":{\"@id\":\"https://docs.germainux.com/#organization\"},\"isPartOf\":{\"@id\":\"https://docs.germainux.com#website\"}}]}\u003c/script>\u003cscript data-mint-head type=\"application/ld+json\">{\"@context\":\"https://schema.org\",\"@type\":\"WebSite\",\"name\":\"GermainUX Docs\",\"publisher\":{\"@type\":\"Organization\",\"name\":\"GermainUX Docs\"},\"provider\":{\"@type\":\"Organization\",\"name\":\"Mintlify\",\"url\":\"https://mintlify.com\"}}\u003c/script>","agentPointerHref":"/use-cases/salesforce-release-regression-analysis.md","siteName":"GermainUX Docs","nav":{"global":null,"tabs":[{"tab":"Documentation","pages":[{"title":"Documentation","href":""}]},{"tab":"Release Notes","pages":[{"title":"Release Notes","href":"/release-notes/overview"}]},{"tab":"Success Stories","pages":[{"title":"Success Stories","href":"/success-stories/overview"}]},{"tab":"Use Cases","groups":[{"group":"Use Cases","icon":"lightbulb","pages":[{"title":"Use Cases","sidebarTitle":"Use Cases","icon":"lightbulb","href":"/use-cases/overview"},{"title":"Find Why Agentforce Isn't Helping Your Salesforce Users","sidebarTitle":"Adoption \u0026 Failure Analysis (Agentforce)","icon":"lightbulb","href":"/use-cases/agentforce-adoption-analysis"},{"title":"Prevent and Trace Slow Calls Across RingCentral or Genesys, Salesforce Service Cloud and Citrix","sidebarTitle":"Call-to-Case Monitoring (RC or Genesys, SFDC SC, Citrix)","icon":"lightbulb","href":"/use-cases/call-to-case-monitoring"},{"title":"Turn a Customer Complaint into an Evidence-Backed Jira Ticket with the GermainUX MCP Server","sidebarTitle":"Complaint-to-Ticket Investigation (MCP, Jira)","icon":"lightbulb","href":"/use-cases/complaint-to-ticket-analysis"},{"title":"Find Why Oracle E-Business Suite Concurrent Requests Pile Up or Fail","sidebarTitle":"Concurrent Request Troubleshooting (EBS)","icon":"lightbulb","href":"/use-cases/ebs-concurrent-request-analysis"},{"title":"Prevent and Trace Failed Orders Across Salesforce, MuleSoft and SAP ERP","sidebarTitle":"Failed Order Monitoring (SFDC, MuleSoft, SAP ERP)","icon":"lightbulb","href":"/use-cases/order-to-erp-monitoring"},{"title":"Find What Patching and Maintenance Broke Across Oracle BI Publisher, IBM MQ, Elasticsearch and AWS","sidebarTitle":"Maintenance Impact Analysis (BIP, MQ, ES, AWS)","icon":"lightbulb","href":"/use-cases/maintenance-impact-analysis"},{"title":"Find the Portal Failures Behind Rising Calls and Cases Across Salesforce Experience Cloud, Service Cloud and RingCentral","sidebarTitle":"Portal Case Volume Analysis (SFDC EC, SFDC SC, RC)","description":"Find out whether calls and cases rose because self-service broke on your portal, for which customers and since which release, and see what those customers saw.","icon":"lightbulb","href":"/use-cases/portal-case-volume-analysis"},{"title":"Find and Fix a Salesforce Release Regression from Your IDE with the GermainUX MCP Server","sidebarTitle":"Release Regression Diagnosis \u0026 Fix (SFDC, MCP)","icon":"lightbulb","href":"/use-cases/salesforce-release-regression-analysis"},{"title":"Find the Release Behind a Production Problem Across MuleSoft, NGINX and PostgreSQL","sidebarTitle":"Release Impact Analysis (MuleSoft, NGINX, Postgres)","description":"Find out whether a release caused the errors, slowdown or outage you see, on which layer, and whether to roll back, from the API to the database.","icon":"lightbulb","href":"/use-cases/release-impact-analysis"},{"title":"Find What Slows Down Your Salesforce Users Without Watching Every Session","sidebarTitle":"User Productivity Analysis (SFDC)","icon":"lightbulb","href":"/use-cases/salesforce-ai-friction-discovery"},{"title":"Save Customers Who Are About to Cancel on Salesforce Experience Cloud and Genesys Chat","sidebarTitle":"Cancellation Prevention (SFDC EC, Genesys)","icon":"lightbulb","href":"/use-cases/cancellation-journey-monitoring"},{"title":"Find Why Conversion Dropped on Your Shopify Store","sidebarTitle":"Conversion Drop Analysis (Shopify)","icon":"lightbulb","href":"/use-cases/conversion-drop-analysis"},{"title":"Increase Oracle Siebel CRM Adoption by Finding, Hearing and Helping Stuck Users","sidebarTitle":"User Adoption Improvement (Siebel CRM)","icon":"lightbulb","href":"/use-cases/siebel-adoption-enhancement"}]}]}]},"basePath":"","title":"Find and Fix a Salesforce Release Regression from Your IDE with the GermainUX MCP Server - GermainUX Docs","deploymentId":"dpl_2pTxFtyBudBMYZiCw1MyvoA1wxpd","buildId":"dpl_2pTxFtyBudBMYZiCw1MyvoA1wxpd","dynamics":["07c022d89b","a74be98ba7"],"chunks":["Frame-B0oVBAXA.js","DynamicMarkdown-BvJIe00T.js","zoom-image-lightbox-BXthlMNf.js","lightbox-handle-r17bVUz3.js"]}