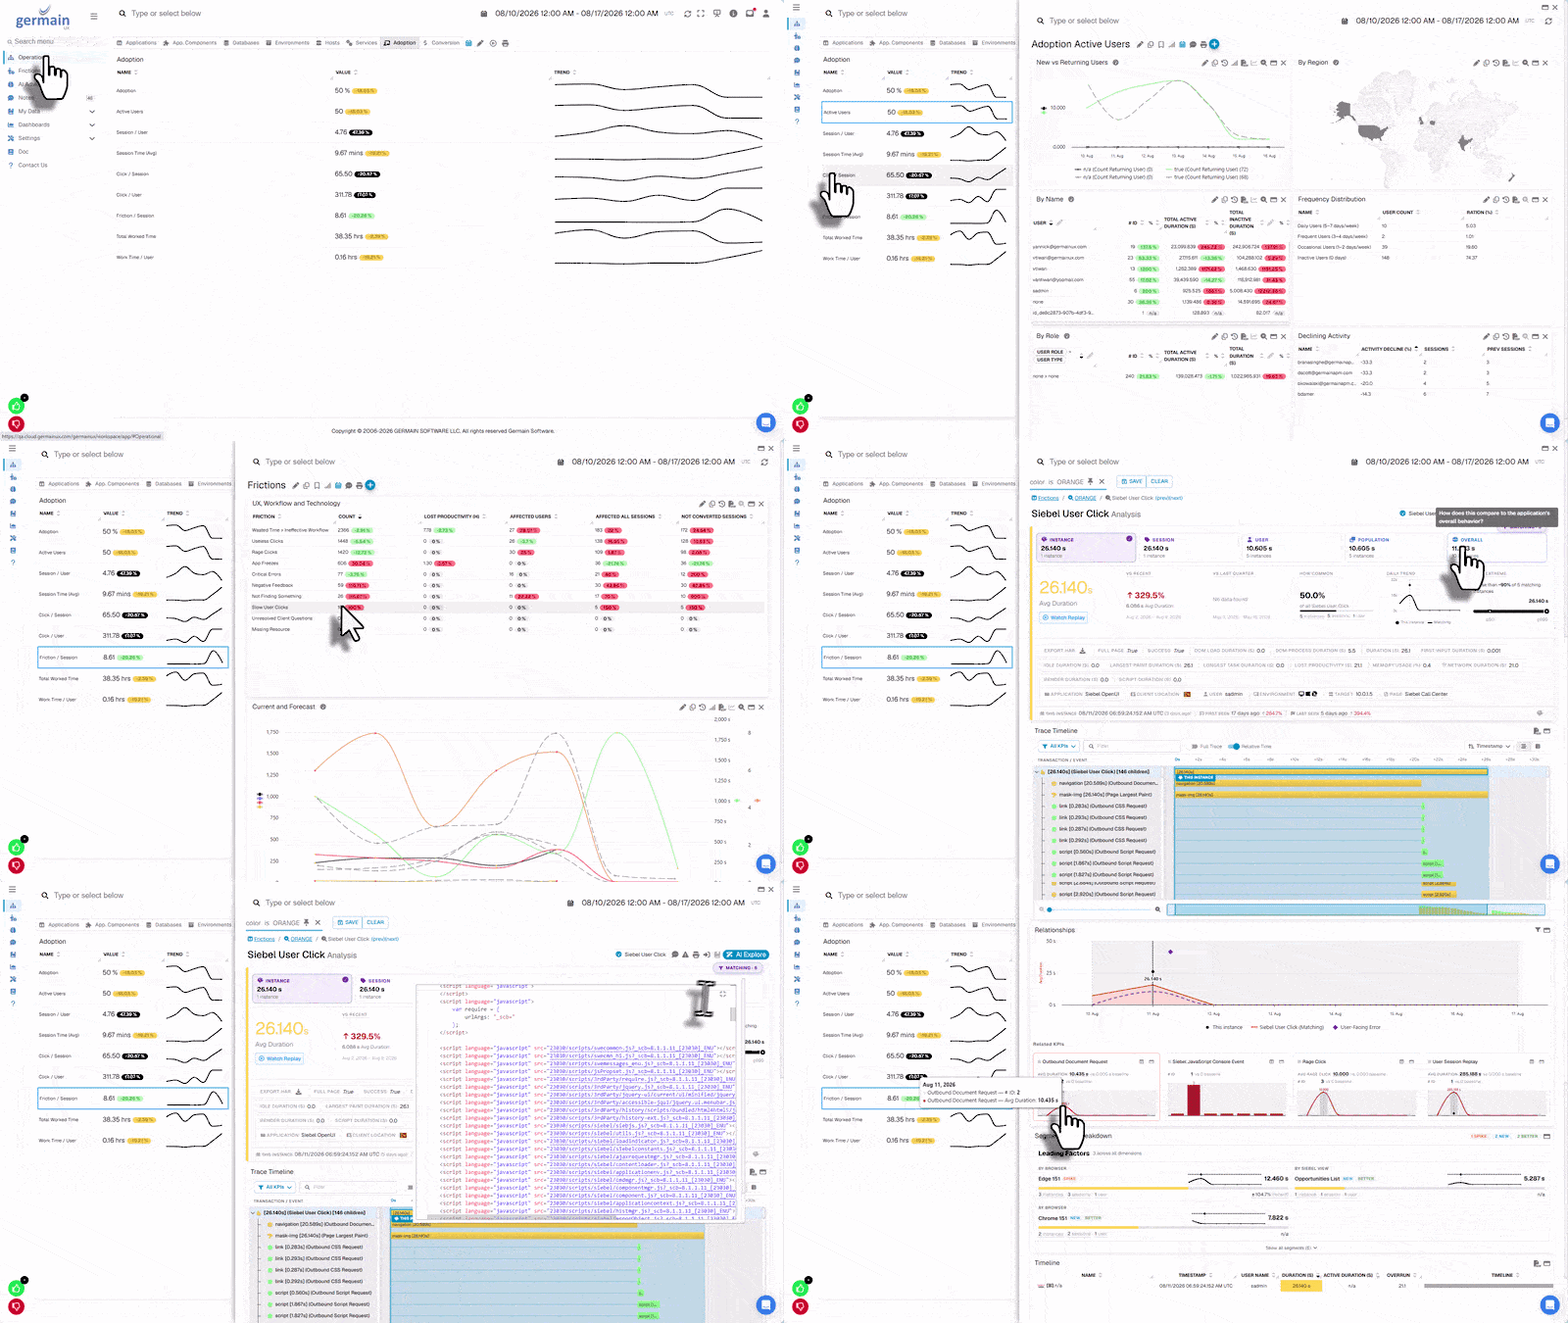
Your organization invested in Oracle Siebel CRM, but users don’t always work the way it was designed. They skip a new view, repeat searches, keep a spreadsheet on the side, or give up on a task halfway. Most of them never open a ticket, so the problem stays invisible until adoption figures disappoint.GermainUX measures how users actually work in Siebel and shows why adoption stalls: the view nobody finds, the step that takes too long, the error that sends users to a workaround. It also gives users a quick way to tell you what they feel, alerts your support team when a user is stuck, and tests key workflows before users meet a broken one.
AdoptionFrictionAffected UsersAnalysisSession ReplayHelp the User
This page uses Oracle Siebel CRM as the example. The same approach works for any application GermainUX records, including customer-facing and eCommerce sites, where the people you hear and help are visitors.
Questions It Answers
Which Siebel views and features do users avoid?
Why do agents skip the new Service Request view?
Which step makes creating an order take so long?
Which teams, roles or locations struggle the most?
What do users say about Siebel, and what were they doing when they said it?
Which user needs help right now?
What GermainUX Watches
GermainUX combines usage, behavior, process and technical signals from every recorded Siebel session.
Signal
What it tells you
Where it comes from
Adoption and active users
How many users work in Siebel, how often and for how long, and whether it’s improving
The investigation is the same for every adoption question. Start from the adoption KPI or the process that disappoints, find who is affected and where, rule out what stayed normal, and then watch one session as evidence. See Adoption Insights for the full method.
Open the Adoption tab to see which signal moved: active users, feature usage, frictions or work time.
Open the Analysis Dashboard on that KPI. Leading Factors show whether the problem concentrates in one team, role, view, location or browser.
Open one affected session in Session Replay to see what the user saw and did.
After the fix, compare the same KPI for the same users before and after the change.
Example: Agents Avoid the New Service Request View
Your team released a new Service Request view for the call center. In this example, about half the agents try it in the first days, but two weeks later only one agent in five still uses it. The others went back to creating Service Requests the old way.
1
Measure who uses it
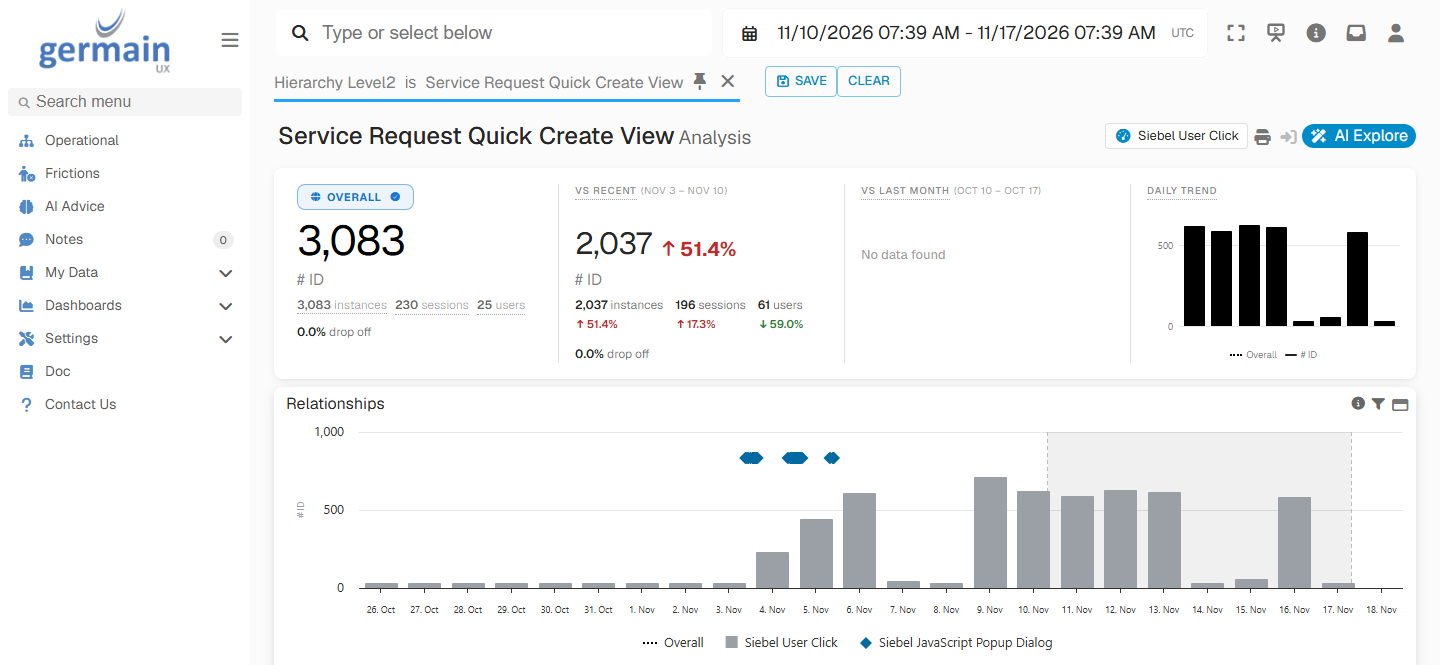
Open feature-usage analysis for the new view. In the last 7 days, 25 agents used it, against 61 in the release week.
Usage of the New Service Request View - GermainUX
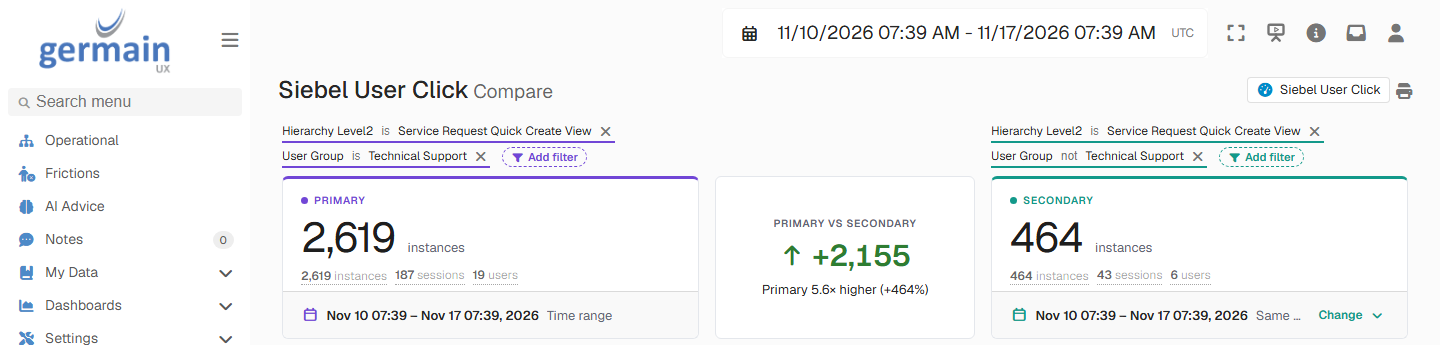
To see which teams still use it, compare one team with the others. In this example, 19 of the 25 agents who still use the view are in Technical Support, nearly the whole team. The other 6 come from the other three teams together.
Technical Support Against the Other Teams - GermainUX
2
Find what stops the others
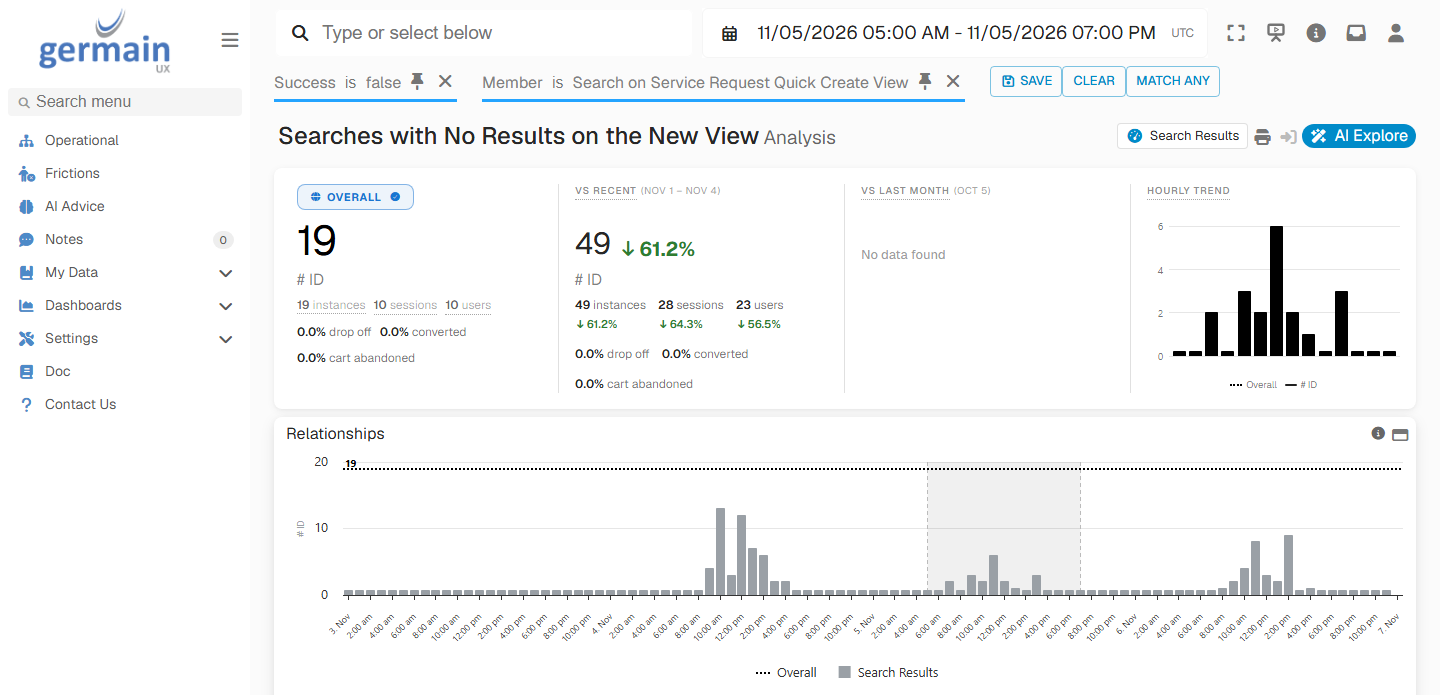
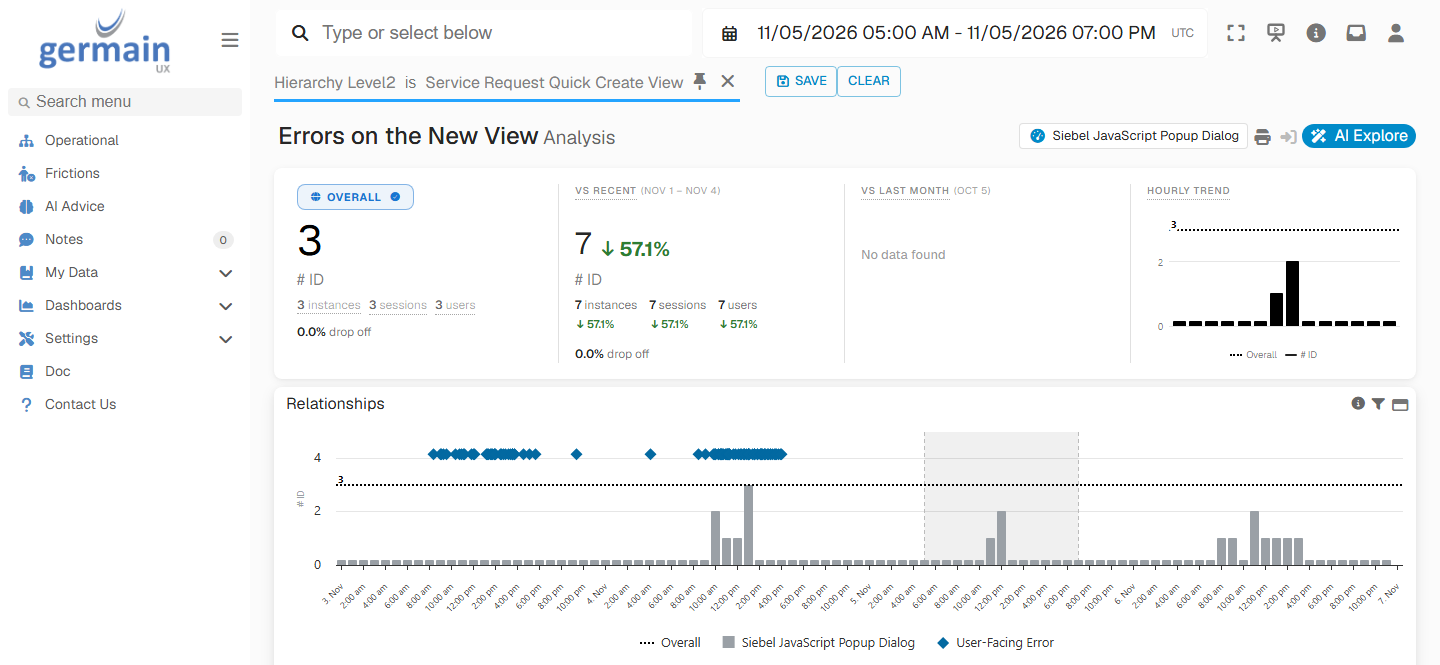
Filter the frictions to the new view. Searches with no results and back-and-forth navigation point to a discoverability problem. Validation errors and slow saves point to a usability or technical one.
Searches with No Results on the New View - GermainUX
Siebel Errors on the New View - GermainUX
3
Watch one agent try
Open a session where an agent opened the view and left it. Read its AI summary for where they gave up, then watch that moment in Session Replay.
You now know whether agents need training, a layout change or a technical fix. After the change, check that usage of the view grows for the teams that avoided it.
Example: Creating an Order Takes Four Times Longer Than Expected
The order-creation process is expected to take two minutes. In this example, users need almost eight minutes, in every team, and some keep notes outside Siebel to get through it.
1
Find the slow steps
Open the order business process. The step durations show where the time goes: adding line items takes over four minutes instead of one, and pricing and validating takes over two and a half instead of half a minute.
2
Rule out the technology
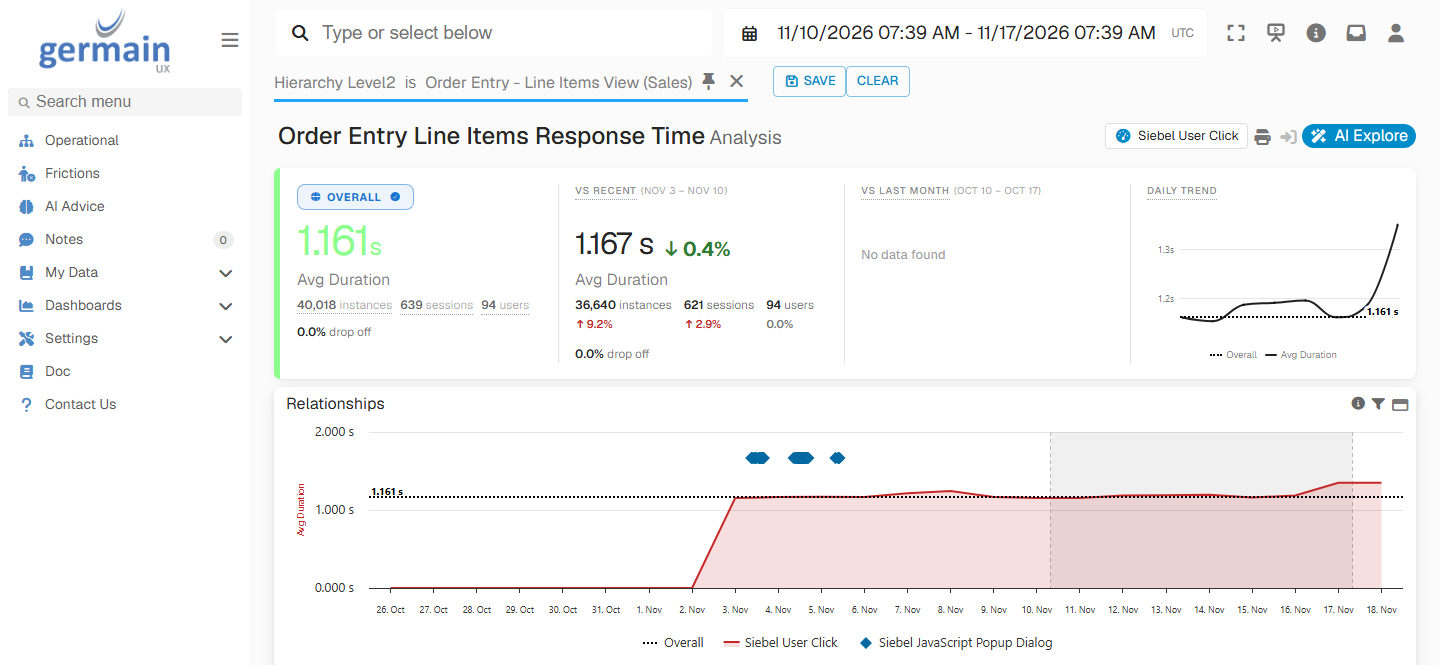
Check the errors and response times of those steps. If they stayed normal, the delay comes from the workflow itself, not from Siebel or its integrations.
Response Time of the Order Line Items View - GermainUX
3
See where users wait or repeat
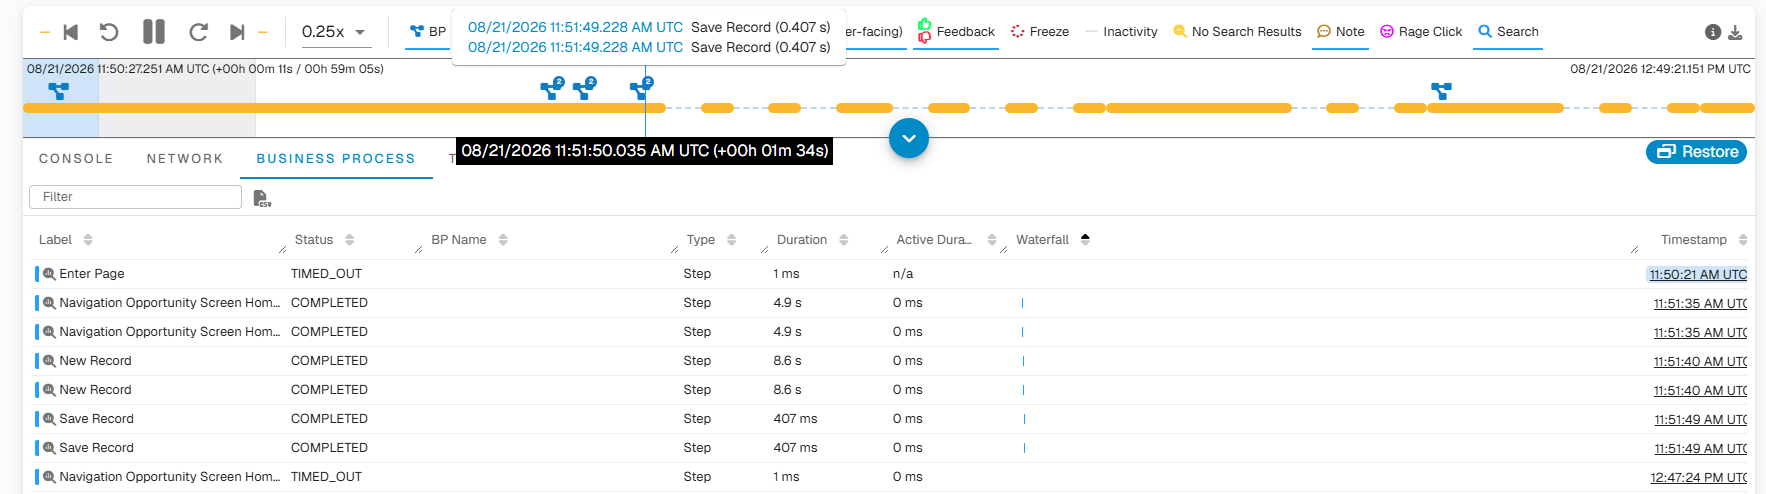
Open a slow order in Session Replay. The Business Process tab lists each step with its status and duration, so you can jump to the step where the user waited or repeated work.
Business Process Steps in Session Replay - GermainUX
Simplify or automate the slowest step, then compare the process duration before and after the change.
Hear and Help Your Users
Analysis finds frictions after the fact. GermainUX can also hear from users while they work, help the ones who are stuck, and catch broken workflows before users meet them.
Let Users Share What They Feel
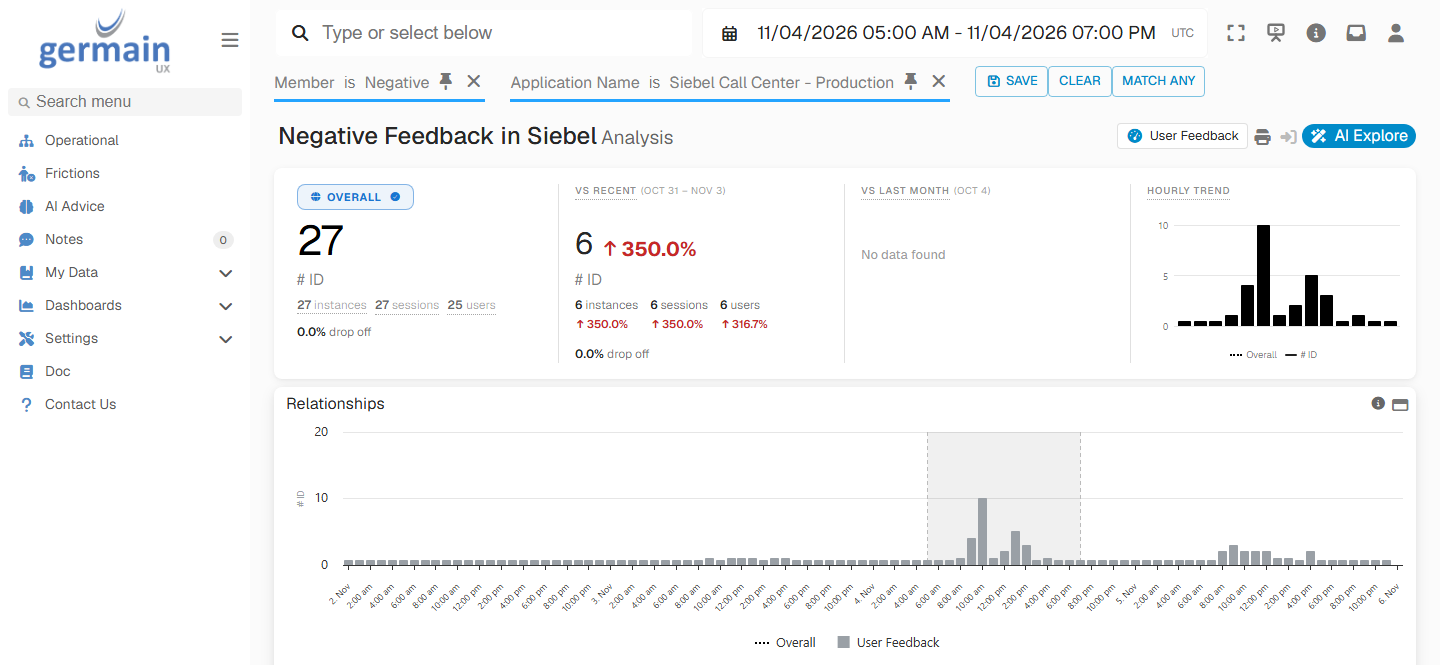
Make it easy and quick for users to tell you what they think. The GermainUX Feedback Popup appears inside Siebel, so a user can give a thumbs up or down, a rating or a short comment in a few seconds, without leaving their work or opening a ticket.Each response is linked to the user’s recorded session and their Siebel context: the screen, view and applet, the recent clicks, errors and business-process steps. Open the feedback in Session Replay to see what the user was doing and what they saw when they wrote it. Then group recurring comments with AI feedback analysis, so you act on the topics that come back most often.
Negative Feedback on the Day of a Release - GermainUX
GermainUX detects, while it happens, that a user is stuck: repeated searches with no results, back-and-forth navigation between views, rage clicks, a negative feedback comment, or a conversation that doesn’t answer their question, picked up by sentiment analysis.
Detect. Real-time monitoring and sentiment analysis flag the user who can’t find what they need.
Alert. An alert tells your support team which user needs help, what they were trying to do, and links to the session.
Respond. Your team reaches out to the user, through a notification or by email, and helps them finish the task.
Users get help before they give up on the task, use a workaround or open a ticket. See Proactive User Engagement.
Avoid Frictions with Synthetic Scenarios
Some frictions can be caught before any user meets them. A synthetic user scenario, recorded with the RPA Bot Recorder, runs a key Siebel workflow on a schedule, such as signing in, searching for an account and creating a Service Request. GermainUX alerts you when a step fails or slows down. Add HTTP checks for the web services and integrations behind the workflow.
Prioritize and Act
Each finding can start a response:
Adoption reports that deliver adoption trends, frictions and lost time to application owners and managers every week or month
SLAs on adoption, friction and process-duration KPIs, so a new or growing problem raises an alert
Configure business processes for the workflows that matter most to adoption, such as order creation or Service Request handling, with their expected duration.
3
Turn on the feedback popup
Enable the Feedback Popup in the Siebel UX Monitoring Profile, and decide who reviews and responds to feedback.
4
Alert your support team
Create alerts on the frictions, negative feedback and sentiment that mean a user needs help, and send them to the channel your support team watches.
Every Siebel deployment has its own applications, processes and user groups. The GermainUX team can help you choose the processes to monitor, set up the feedback popup and the support alerts, and record the synthetic scenarios for your key workflows.
Contact GermainUX Support
The GermainUX team helps you get up and running faster, empower your team, turn data into actionable insights, and optimize performance to deliver measurable business outcomes.
Can't Find What You Need?
Search all GermainUX docs with Ctrl + K, or use the feedback buttons at the bottom of this page to tell us what is missing.
The content of this document is proprietary to GERMAIN SOFTWARE.
Was this page helpful?
{"docsConfig":{"theme":"mint","$schema":"https://mintlify.com/docs.json","name":"GermainUX Docs","description":"GermainUX is a real-time Operational Experience Intelligence platform that combines Monitoring + Analytics + AI + Automation to help organizations detect and resolve user, workflow, and technology issues faster, in order to 1)Improve CRM and ERP Adoption and Productivity 2)Increase eCommerce Conversion","colors":{"primary":"#2E7DF2","light":"#5B9CFF","dark":"#1A5FC8"},"logo":{"light":"https://mintcdn.com/germain-ux/ok7-BbqwVV0uk3t8/images/logo-light.png?fit=max\u0026auto=format\u0026n=ok7-BbqwVV0uk3t8\u0026q=85\u0026s=3cfe3238ac55802e43da3e4da5806f0d","dark":"https://mintcdn.com/germain-ux/ok7-BbqwVV0uk3t8/images/logo-dark.png?fit=max\u0026auto=format\u0026n=ok7-BbqwVV0uk3t8\u0026q=85\u0026s=1886121bf4312c96b6321ea733078b7f","href":"/"},"favicon":"https://mintcdn.com/germain-ux/Jw6D65yKWJ4U5yOS/images/favicon.png?fit=max\u0026auto=format\u0026n=Jw6D65yKWJ4U5yOS\u0026q=85\u0026s=bcc4dd08f0edb299e0b2af2f079f8526","appearance":{"default":"light"},"background":{"color":{"light":"#FFFFFF","dark":"#00112A"}},"navbar":{"links":[{"href":"https://germainux.atlassian.net/servicedesk/customer/portal/1","label":"Ticket"},{"href":"https://calendly.com/germainux","label":"Schedule"}],"primary":{"type":"button","label":"Contact GermainUX","href":"https://docs.germainux.com/getting-started/support"}},"footer":{"socials":{"website":"https://germainux.com"}},"seo":{"metatags":{"canonical":"https://docs.germainux.com","og:locale":"en_US","og:site_name":"GermainUX Docs","twitter:card":"summary_large_image"},"indexing":"navigable"},"styling":{"eyebrows":"section","latex":true},"integrations":{"gtm":{"tagId":"GTM-MRCBSV5R"}},"contextual":{"options":["view","chatgpt","claude"],"display":"header"},"navigation":{"pages":[]}},"deployment":{"deploymentMetadataValue":{"subdomain":"germain-ux","hasAudioNarration":false,"actualSubdomain":"germain-ux","customDomains":["docs.germainux.com"],"gitSource":{"type":"github","owner":"germainsoftware","repo":"germain-docs","deployBranch":"main","contentDirectory":"","isPrivate":true,"mountPath":"","label":"","_id":"6ae890c6c73aaa2ebb8f7a7f"},"feedback":{"contextualFeedback":{"allowEmail":true,"textInputOnly":false},"edits":false,"issues":false,"thumbs":true},"entitlements":{"AI_CHAT":{"status":"ENABLED"},"WEB_MCP":{"status":"ENABLED"},"NARRATION":{"status":"ENABLED"}},"buildId":"6afce1af74df63670e0e687f","clientVersion":"0.0.4177","searchFilterCounts":[{"language":"default","tag":"Documentation","count":511},{"language":"default","tag":"GermainUX Documentation","count":511},{"language":"default","tag":"Integrations","count":274},{"language":"default","tag":"Release Notes","count":81},{"language":"default","tag":"Archive","count":73},{"language":"default","tag":"Management","count":57},{"language":"default","tag":"Analytics","count":53},{"language":"default","tag":"Deploy GermainUX","count":53},{"language":"default","tag":"Action","count":48},{"language":"default","tag":"Success Stories","count":34}],"searchSettings":{"fullPageSearch":true,"showContentSnippets":true}},"assistantConfig":{"enableAskAiButton":false,"enableStarterQuestions":false,"enableContextualStarterQuestions":false,"enableAskAiSearchBar":true},"basePath":"","hasChatPermissions":true,"hasWebMcpPermissions":true,"toggles":[{"name":"kill-isr","enabled":true,"variant":{"name":"disabled","enabled":false,"feature_enabled":true},"impressionData":false},{"name":"custom-rbac-roles","enabled":true,"variant":{"name":"disabled","enabled":false,"feature_enabled":true},"impressionData":false},{"name":"agent-mintlify-slack","enabled":true,"variant":{"name":"disabled","enabled":false,"feature_enabled":true},"impressionData":false},{"name":"agent-integrations-settings","enabled":true,"variant":{"name":"disabled","enabled":false,"feature_enabled":true},"impressionData":false},{"name":"rbac-expansion","enabled":true,"variant":{"name":"disabled","enabled":false,"feature_enabled":true},"impressionData":false},{"name":"automations-pr-grouping","enabled":true,"variant":{"name":"disabled","enabled":false,"feature_enabled":true},"impressionData":false},{"name":"custom-prefix","enabled":true,"variant":{"name":"disabled","enabled":false,"feature_enabled":true},"impressionData":false},{"name":"analytics-v7","enabled":true,"variant":{"name":"disabled","enabled":false,"feature_enabled":true},"impressionData":false},{"name":"user-flows-analytics","enabled":true,"variant":{"name":"disabled","enabled":false,"feature_enabled":true},"impressionData":false},{"name":"no-publish-flow","enabled":true,"variant":{"name":"disabled","enabled":false,"feature_enabled":true},"impressionData":false},{"name":"workos-onboarding","enabled":true,"variant":{"name":"disabled","enabled":false,"feature_enabled":true},"impressionData":false},{"name":"snapshot-serving-live","enabled":true,"variant":{"name":"disabled","enabled":false,"feature_enabled":true},"impressionData":false},{"name":"stripTemperatureMiddleware","enabled":true,"variant":{"name":"disabled","enabled":false,"feature_enabled":true},"impressionData":false},{"name":"support-platform-pylon-zendesk","enabled":true,"variant":{"name":"disabled","enabled":false,"feature_enabled":true},"impressionData":false},{"name":"snapshot-serving","enabled":true,"variant":{"name":"disabled","enabled":false,"feature_enabled":true},"impressionData":false},{"name":"instant-rollback","enabled":true,"variant":{"name":"disabled","enabled":false,"feature_enabled":true},"impressionData":false},{"name":"granular-notifications-server","enabled":true,"variant":{"name":"disabled","enabled":false,"feature_enabled":true},"impressionData":false},{"name":"granular-notifications","enabled":true,"variant":{"name":"disabled","enabled":false,"feature_enabled":true},"impressionData":false},{"name":"automations-fable","enabled":true,"variant":{"name":"disabled","enabled":false,"feature_enabled":true},"impressionData":false},{"name":"fixed-ai-action-pricing","enabled":true,"variant":{"name":"disabled","enabled":false,"feature_enabled":true},"impressionData":false},{"name":"automation-resolve-merge-conflict","enabled":true,"variant":{"name":"disabled","enabled":false,"feature_enabled":true},"impressionData":false},{"name":"scoped-publishing","enabled":true,"variant":{"name":"disabled","enabled":false,"feature_enabled":true},"impressionData":false},{"name":"mintql","enabled":true,"variant":{"name":"disabled","enabled":false,"feature_enabled":true},"impressionData":false},{"name":"page-level-analytics","enabled":true,"variant":{"name":"disabled","enabled":false,"feature_enabled":true},"impressionData":false},{"name":"editor-version-history-v2","enabled":true,"variant":{"name":"disabled","enabled":false,"feature_enabled":true},"impressionData":false},{"name":"billing-page-v2","enabled":true,"variant":{"name":"disabled","enabled":false,"feature_enabled":true},"impressionData":false},{"name":"full-page-search","enabled":true,"variant":{"name":"disabled","enabled":false,"feature_enabled":true},"impressionData":false},{"name":"workspace-projects","enabled":true,"variant":{"name":"disabled","enabled":false,"feature_enabled":true},"impressionData":false},{"name":"assistant-v5","enabled":true,"variant":{"name":"disabled","enabled":false,"feature_enabled":true},"impressionData":false},{"name":"fork-pr-previews","enabled":true,"variant":{"name":"disabled","enabled":false,"feature_enabled":true},"impressionData":false},{"name":"revalidation-jwt","enabled":true,"variant":{"name":"disabled","enabled":false,"feature_enabled":true},"impressionData":false},{"name":"workos-sso-scim","enabled":true,"variant":{"name":"disabled","enabled":false,"feature_enabled":true},"impressionData":false},{"name":"hobby-abuse-scan","enabled":true,"variant":{"name":"disabled","enabled":false,"feature_enabled":true},"impressionData":false},{"name":"dashboard-inbox","enabled":true,"variant":{"name":"disabled","enabled":false,"feature_enabled":true},"impressionData":false},{"name":"workos-signup","enabled":true,"variant":{"name":"disabled","enabled":false,"feature_enabled":true},"impressionData":false},{"name":"turbopuffer-dual-write","enabled":true,"variant":{"name":"disabled","enabled":false,"feature_enabled":true},"impressionData":false},{"name":"workos-enabled","enabled":true,"variant":{"name":"disabled","enabled":false,"feature_enabled":true},"impressionData":false},{"name":"approve-review-flow","enabled":true,"variant":{"name":"disabled","enabled":false,"feature_enabled":true},"impressionData":false},{"name":"editor-metadata","enabled":true,"variant":{"name":"disabled","enabled":false,"feature_enabled":true},"impressionData":false},{"name":"sso-setup-deadline-banner","enabled":true,"variant":{"name":"disabled","enabled":false,"feature_enabled":true},"impressionData":false},{"name":"turbopuffer-serve","enabled":true,"variant":{"name":"disabled","enabled":false,"feature_enabled":true},"impressionData":false},{"name":"live-agents","enabled":true,"variant":{"name":"disabled","enabled":false,"feature_enabled":true},"impressionData":false},{"name":"starter-pricing","enabled":true,"variant":{"name":"treatment","enabled":true,"payload":{"type":"string","value":"treatment"},"feature_enabled":true},"impressionData":false},{"name":"llms-txt-v2","enabled":true,"variant":{"name":"disabled","enabled":false,"feature_enabled":true},"impressionData":false},{"name":"wildcard-email-auth","enabled":true,"variant":{"name":"disabled","enabled":false,"feature_enabled":true},"impressionData":false}],"googleFontsInlined":false},"customCss":[],"page":{"pagePath":"use-cases/siebel-adoption-enhancement","slug":"/use-cases/siebel-adoption-enhancement","pageMetadata":{"title":"Increase Oracle Siebel CRM Adoption by Finding, Hearing and Helping Stuck Users","sidebarTitle":"Siebel Adoption Enhancement","description":"Find what keeps users from adopting Oracle Siebel CRM, let them tell you in seconds, and help the ones who are stuck before they give up.","icon":"lightbulb","keywords":["Siebel adoption","Oracle Siebel CRM adoption","CRM adoption","Siebel user experience","Siebel user feedback","Siebel productivity","Siebel session replay","Siebel synthetic monitoring","user sentiment analysis"],"href":"/use-cases/siebel-adoption-enhancement"},"description":{"compiledSource":"\"use strict\";\nconst {jsx: _jsx} = arguments[0];\nconst {useMDXComponents: _provideComponents} = arguments[0];\nfunction _createMdxContent(props) {\n const _components = {\n p: \"p\",\n ..._provideComponents(),\n ...props.components\n };\n return _jsx(_components.p, {\n children: \"Find what keeps users from adopting Oracle Siebel CRM, let them tell you in seconds, and help the ones who are stuck before they give up.\"\n });\n}\nfunction MDXContent(props = {}) {\n const {wrapper: MDXLayout} = {\n ..._provideComponents(),\n ...props.components\n };\n return MDXLayout ? _jsx(MDXLayout, {\n ...props,\n children: _jsx(_createMdxContent, {\n ...props\n })\n }) : _createMdxContent(props);\n}\nreturn {\n default: MDXContent\n};\n","frontmatter":{},"scope":{}},"pageType":"default","mdx":{"mdxSource":{"compiledSource":"\"use strict\";const{Fragment:_Fragment,jsx:_jsx,jsxs:_jsxs}=arguments[0];const{useMDXComponents:_provideComponents}=arguments[0];const GxFooter=()=>_jsx(`p`,{className:`gx-fine`,children:`The content of this document is proprietary to GERMAIN SOFTWARE.`});const GxStyle=()=>_jsx(`style`,{children:`\n.gx-meta { display:flex; flex-direction:column; gap:10px; margin:22px 0 6px; padding:16px 18px; border:1px solid rgba(15,23,42,.08); border-radius:16px; background:rgba(46,125,242,.035); font-size:13.5px; }\n.gx-meta-row { display:flex; flex-wrap:wrap; align-items:center; gap:6px; }\n.gx-meta-label { width:96px; flex:none; color:#64748b; }\n.dark .gx-meta-label { color:#94a3b8; }\n.gx-meta code { border-color:rgba(46,125,242,.25) !important; color:#1A5FC8 !important; background:rgba(46,125,242,.08) !important; }\n.dark .gx-meta { background:linear-gradient(135deg,rgba(46,125,242,.16),rgba(0,17,42,.4)); border-color:rgba(91,156,255,.22); }\n.dark .gx-meta code { color:#BFD6FF !important; background:rgba(91,156,255,.12) !important; border-color:rgba(91,156,255,.28) !important; }\n.gx-list ul { columns:2; column-gap:24px; list-style:none !important; padding-left:0 !important; margin:14px 0 0 !important; }\n.gx-list ul:has(> li:only-child) { columns:1; }\n.gx-list li { break-inside:avoid; position:relative; padding:4px 0 4px 22px !important; margin:0 !important; font-size:14.5px; }\n.gx-list li::marker { content:\"\"; }\n.gx-list li::before { content:\"\"; position:absolute; left:3px; top:13px; width:7px; height:7px; border-radius:50%; background:#2E7DF2; opacity:.75; }\n.dark .gx-list li::before { background:#5B9CFF; }\n.gx-flow { display:flex; flex-wrap:wrap; align-items:center; gap:10px 32px; margin:16px 0; }\n.gx-flow span { position:relative; display:inline-flex; align-items:center; padding:6px 12px; border-radius:8px; font-size:13.5px; font-weight:500; background:#fff; border:1px solid rgba(15,23,42,.12); color:#0f172a; box-shadow:0 1px 2px rgba(15,23,42,.05); }\n.gx-flow span:first-child, .gx-flow span:last-child { background:rgba(46,125,242,.08); border-color:rgba(46,125,242,.25); color:#1A5FC8; }\n.gx-flow span:not(:last-child)::after { content:\"\\\\2192\"; position:absolute; left:calc(100% + 9px); color:#94a3b8; font-weight:400; }\n.dark .gx-flow span { background:rgba(255,255,255,.03); border-color:rgba(255,255,255,.12); color:#e2e8f0; box-shadow:none; }\n.dark .gx-flow span:first-child, .dark .gx-flow span:last-child { background:rgba(91,156,255,.10); border-color:rgba(91,156,255,.28); color:#BFD6FF; }\n.dark .gx-flow span:not(:last-child)::after { color:#64748b; }\n#sidebar li[id] > a > div:first-child:has(> svg[aria-hidden]) { display: none; }\n#sidebar svg[style*=\"mask-image\"], #sidebar-content svg[style*=\"mask-image\"], #navigation-items svg[style*=\"mask-image\"], aside svg[style*=\"mask-image\"] { display: none !important; }\n#sidebar div:has(> svg[style*=\"mask-image\"]), #sidebar-content div:has(> svg[style*=\"mask-image\"]), #navigation-items div:has(> svg[style*=\"mask-image\"]), aside div:has(> svg[style*=\"mask-image\"]) { display: none !important; }\n.gx-fine { margin-top:56px; padding-top:20px; border-top:1px solid rgba(15,23,42,.08); font-size:13px; color:#64748b; }\n.dark .gx-fine { border-top-color:rgba(255,255,255,.08); color:#94a3b8; }\n.gx-fine p { margin:0 !important; font-size:13px !important; color:inherit !important; }\n.eyebrow { font-size:13px !important; font-weight:700 !important; letter-spacing:.12em !important; text-transform:uppercase; color:#2E7DF2 !important; display:inline-flex; align-items:center; gap:8px; padding:4px 12px; border-radius:999px; background:rgba(46,125,242,.10); border:1px solid rgba(46,125,242,.25); height:auto !important; margin-bottom:6px; }\n.dark .eyebrow { color:#8DB8FF !important; background:rgba(91,156,255,.12); border-color:rgba(91,156,255,.30); }\n#page-title { letter-spacing:-.02em; }\n.dark #page-title { background:linear-gradient(90deg,#FFFFFF 0%,#BFD6FF 100%); -webkit-background-clip:text; background-clip:text; -webkit-text-fill-color:transparent; }\n.mdx-content h2:not(.not-prose) { position:relative; padding-left:16px; }\n.mdx-content h2:not(.not-prose)::before { content:\"\"; position:absolute; left:0; top:.2em; bottom:.2em; width:4px; border-radius:4px; background:linear-gradient(180deg,#2E7DF2,#5B9CFF); }\n.dark table th { color:#BFD6FF; }\n.dark table td:first-child { color:#FFFFFF; font-weight:500; }\n@media (max-width: 820px) { .gx-list ul { columns:1; } }\n.gx-list-more:not(.is-open) > ul > li:nth-child(n+11) { display:none; }\n.gx-more-toggle { display:inline-flex; align-items:center; gap:6px; margin:8px 0 12px 22px; padding:0; border:0; background:none; cursor:pointer; font-size:14px; font-weight:600; color:#1A5FC8; }\n.gx-more-toggle:hover { text-decoration:underline; }\n.gx-more-toggle::after { content:\"\\\\25BE\"; display:inline-block; font-size:12px; transition:transform .15s; }\n.gx-list-more.is-open .gx-more-toggle::after { transform:rotate(180deg); }\n.dark .gx-more-toggle { color:#8DB8FF; }\n/* === Concept #1: hero header + numbered section tiles === */\n#content-area { counter-reset: gxsec; }\n#header { position:relative; overflow:hidden; padding:36px 30px 24px; border-radius:24px; border:1px solid rgba(91,156,255,.22); background:radial-gradient(800px 300px at 100% 0%, rgba(46,125,242,.32), transparent 65%), #0B2147; }\n#header::before { content:\"\"; position:absolute; inset:0; pointer-events:none; background-image:linear-gradient(rgba(255,255,255,.045) 1px,transparent 1px),linear-gradient(90deg,rgba(255,255,255,.045) 1px,transparent 1px); background-size:34px 34px; -webkit-mask-image:linear-gradient(100deg,transparent 15%,#000 75%); mask-image:linear-gradient(100deg,transparent 15%,#000 75%); }\n#header > * { position:relative; }\n#header #page-title { color:#fff !important; -webkit-text-fill-color:#fff !important; background:none !important; font-size:clamp(1.9rem,3.4vw,2.6rem) !important; line-height:1.06 !important; font-weight:800 !important; letter-spacing:-.035em !important; }\n#header .prose, #header .prose p, #header p { color:rgba(222,233,255,.82) !important; font-size:1.06rem; line-height:1.6; }\n#header .eyebrow { color:#BFD6FF !important; background:rgba(91,156,255,.14) !important; border-color:rgba(91,156,255,.32) !important; }\n#header button, #header [role=\"button\"] { color:#DCE8FF !important; border-color:rgba(191,214,255,.25) !important; background:rgba(255,255,255,.04) !important; }\n#content-area:has(#content > .gx-meta:first-child) #header { border-radius:24px 24px 0 0; border-bottom:0; padding-bottom:18px; }\n#content:has(> .gx-meta:first-child) { margin-top:0 !important; }\n#content > .gx-meta:first-child { margin:0 !important; padding:4px 30px 28px !important; border-radius:0 0 24px 24px !important; border:1px solid rgba(91,156,255,.22) !important; border-top:0 !important; background:#0B2147 !important; }\n#content > .gx-meta:first-child:has(+ .columns) { border-radius:0 !important; border-bottom:0 !important; padding-bottom:18px !important; }\n#content > .gx-meta:first-child + .columns { margin:0 0 8px !important; padding:4px 30px 30px !important; border:1px solid rgba(91,156,255,.22); border-top:0; border-radius:0 0 24px 24px; background:#0B2147; gap:12px !important; }\n#content > .gx-meta:first-child + .columns > * { background:rgba(255,255,255,.035) !important; border-color:rgba(91,156,255,.28) !important; border-radius:16px !important; }\n#content > .gx-meta:first-child + .columns h2, #content > .gx-meta:first-child + .columns [data-component-part=\"card-title\"] { color:#fff !important; font-size:15px !important; overflow-wrap:normal !important; word-break:normal !important; }\n#content > .gx-meta:first-child + .columns p, #content > .gx-meta:first-child + .columns [data-component-part=\"card-content\"] { color:rgba(214,226,250,.7) !important; }\n#content > .gx-meta:first-child + .columns svg { background-color:#5B9CFF !important; }\n#content > .gx-meta:first-child .gx-meta-label { color:rgba(191,214,255,.6) !important; }\n#content > .gx-meta:first-child code { font-family:inherit !important; font-weight:600 !important; font-size:12.5px !important; padding:5px 13px !important; border-radius:999px !important; color:#DCE8FF !important; background:rgba(46,125,242,.14) !important; border:1px solid rgba(91,156,255,.55) !important; }\n#content > .gx-meta:first-child a { text-decoration:none !important; border:0 !important; }\n#content > .gx-meta:first-child a:not(:has(code)) { color:#BFD6FF !important; font-weight:600; }\n#content > .gx-meta:first-child .gx-meta-row > span:not(.gx-meta-label) { color:#86EFAC !important; background:rgba(34,197,94,.14) !important; border-color:rgba(134,239,172,.35) !important; }\n.mdx-content > h2:not(.not-prose), #content > h2 { counter-increment:gxsec; display:flex !important; align-items:center; gap:14px; padding-left:0 !important; margin-top:2.6em !important; font-weight:750; letter-spacing:-.02em; }\n.mdx-content > h2:not(.not-prose)::before, #content > h2::before { content:counter(gxsec, decimal-leading-zero) !important; position:static !important; flex:none; width:40px; height:40px; border-radius:12px; display:inline-flex; align-items:center; justify-content:center; font-size:13px; font-weight:700; letter-spacing:0; color:#fff; background:linear-gradient(135deg,#2E7DF2,#5B9CFF) !important; box-shadow:0 6px 18px rgba(46,125,242,.35); }\n@media (max-width:820px) { #header, #content > .gx-meta:first-child, #content > .gx-meta:first-child + .columns { padding-left:20px !important; padding-right:20px !important; } }\n#content-area:has(#content > .columns:first-child) #header { border-radius:24px 24px 0 0; border-bottom:0; padding-bottom:18px; }\n#content:has(> .columns:first-child) { margin-top:0 !important; }\n#content > .columns:first-child { margin:0 0 8px !important; padding:4px 30px 30px !important; border:1px solid rgba(91,156,255,.22); border-top:0; border-radius:0 0 24px 24px; background:#0B2147; gap:12px !important; }\n#content > .columns:first-child > * { background:rgba(255,255,255,.035) !important; border-color:rgba(91,156,255,.28) !important; border-radius:16px !important; }\n#content > .columns:first-child h2, #content > .columns:first-child [data-component-part=\"card-title\"] { color:#fff !important; font-size:15px !important; overflow-wrap:normal !important; word-break:normal !important; }\n#content > .columns:first-child p, #content > .columns:first-child [data-component-part=\"card-content\"] { color:rgba(214,226,250,.7) !important; }\n#content > .columns:first-child svg { background-color:#5B9CFF !important; }\n/* === Shell: concept #1 (top bar, menus, page) === */\n#navbar, #navbar-transition, #navbar > div { background:#00112A !important; }\n#navbar { border-bottom:1px solid rgba(91,156,255,.18) !important; }\n#navbar a, #navbar button, #navbar .nav-tabs-item { color:rgba(220,232,255,.78) !important; }\n#navbar a:hover, #navbar button:hover, #navbar .nav-tabs-item[data-active=\"true\"] { color:#FFFFFF !important; }\n#navbar a[class*=\"bg-primary\"], #navbar a[class*=\"bg-primary\"] * { color:#FFFFFF !important; }\n#navbar a[href=\"/\"], #navbar a[href=\"/\"] * { color:#FFFFFF !important; }\n#search-bar-entry { background:rgba(255,255,255,.06) !important; border:1px solid rgba(255,255,255,.14) !important; box-shadow:none !important; }\n#search-bar-entry, #search-bar-entry * { color:rgba(220,232,255,.72) !important; }\nhtml:not(.dark) #navbar img[src*=\"logo-light\"] { display:none !important; }\nhtml:not(.dark) #navbar img[src*=\"logo-dark\"] { display:block !important; }\nhtml:not(.dark) #sidebar, html:not(.dark) #sidebar-content { background:#FFFFFF !important; }\nhtml:not(.dark) #sidebar { border-right:1px solid #E6ECF5 !important; }\n#navigation-items .sidebar-group-header { font-size:11.5px !important; letter-spacing:.08em; text-transform:uppercase; }\nhtml:not(.dark) #navigation-items .sidebar-group-header { color:#0B1B33 !important; }\n#navigation-items a { font-size:13.5px !important; border-radius:10px !important; }\nhtml:not(.dark) #navigation-items a { color:#4A5A75 !important; }\nhtml:not(.dark) #navigation-items a:hover { background:#F1F5FC !important; color:#0B1B33 !important; }\n#navigation-items li[data-active] > a, #navigation-items a[aria-current=\"page\"], #navigation-items a[class*=\"bg-primary\"] { background:#EAF2FF !important; color:#1A5FC8 !important; font-weight:600 !important; box-shadow:inset 3px 0 0 #2E7DF2; }\n.dark #navigation-items li[data-active] > a, .dark #navigation-items a[aria-current=\"page\"], .dark #navigation-items a[class*=\"bg-primary\"] { background:rgba(46,125,242,.16) !important; color:#BFD6FF !important; }\nhtml:not(.dark) #table-of-contents a { color:#5B6B85; }\nhtml:not(.dark) .mdx-content h2, html:not(.dark) .mdx-content h3 { color:#0B1B33; }\nhtml:not(.dark) .mdx-content p, html:not(.dark) .mdx-content li { color:#33415C; }\n`});function _createMdxContent(props){const _components={a:`a`,li:`li`,ol:`ol`,p:`p`,strong:`strong`,tbody:`tbody`,td:`td`,th:`th`,thead:`thead`,tr:`tr`,ul:`ul`,..._provideComponents(),...props.components},{Card,CardGroup,Frame,Heading,OptimizedImage,Step,Steps,Table,_MdxComponentBoundary}=_components;if(!Card)_missingMdxReference(`Card`,true);if(!CardGroup)_missingMdxReference(`CardGroup`,true);if(!Frame)_missingMdxReference(`Frame`,true);if(!Heading)_missingMdxReference(`Heading`,true);if(!OptimizedImage)_missingMdxReference(`OptimizedImage`,true);if(!Step)_missingMdxReference(`Step`,true);if(!Steps)_missingMdxReference(`Steps`,true);if(!Table)_missingMdxReference(`Table`,true);if(!_MdxComponentBoundary)_missingMdxReference(`_MdxComponentBoundary`,true);return _jsxs(_Fragment,{children:[_jsx(`div`,{className:`gx-meta`,children:_jsxs(`div`,{className:`gx-meta-row`,children:[_jsx(`span`,{className:`gx-meta-label`,children:`Components`}),_jsx(_components.a,{href:`/deploy/germain-ux-engine`,children:_jsx(`code`,{children:`Engine`})}),_jsx(_components.a,{href:`/deploy/germain-ux-rpa-bot-recorder`,children:_jsx(`code`,{children:`RPA Bot Recorder`})}),_jsx(_components.a,{href:`/deploy/germain-ux-rum-js`,children:_jsx(`code`,{children:`RUM JS`})})]})}),`\n`,_jsxs(CardGroup,{cols:4,children:[_jsx(Card,{title:`What GermainUX Watches`,icon:`binoculars`,href:`#what-germainux-watches`,children:_jsx(_components.p,{children:`Usage, frictions and feedback`})}),_jsx(Card,{title:`Find the Cause`,icon:`magnifying-glass-chart`,href:`#find-the-cause`,children:_jsx(_components.p,{children:`Two worked examples`})}),_jsx(Card,{title:`Hear and Help Your Users`,icon:`headset`,href:`#hear-and-help-your-users`,children:_jsx(_components.p,{children:`Feedback, help and synthetic tests`})}),_jsx(Card,{title:`Set It Up`,icon:`sliders`,href:`#set-it-up`,children:_jsx(_components.p,{children:`What to deploy and configure`})})]}),`\n`,_jsx(Heading,{level:`2`,id:`overview`,children:`Overview`}),`\n`,_jsx(_components.p,{children:`Your organization invested in Oracle Siebel CRM, but users don’t always work the way it was designed. They skip a new view, repeat searches, keep a spreadsheet on the side, or give up on a task halfway. Most of them never open a ticket, so the problem stays invisible until adoption figures disappoint.`}),`\n`,_jsxs(_components.p,{children:[`GermainUX measures how users actually work in Siebel and shows `,_jsx(_components.strong,{children:`why adoption stalls`}),`: the view nobody finds, the step that takes too long, the error that sends users to a workaround. It also gives users a quick way to tell you what they feel, alerts your support team when a user is stuck, and tests key workflows before users meet a broken one.`]}),`\n`,_jsxs(`div`,{className:`gx-flow`,children:[_jsx(`span`,{children:`Adoption`}),_jsx(`span`,{children:`Friction`}),_jsx(`span`,{children:`Affected Users`}),_jsx(`span`,{children:`Analysis`}),_jsx(`span`,{children:`Session Replay`}),_jsx(`span`,{children:`Help the User`})]}),`\n`,_jsx(_components.p,{children:`This page uses Oracle Siebel CRM as the example. The same approach works for any application GermainUX records, including customer-facing and eCommerce sites, where the people you hear and help are visitors.`}),`\n`,_jsx(Heading,{level:`3`,id:`questions-it-answers`,children:`Questions It Answers`}),`\n`,_jsx(`div`,{className:`gx-list`,children:_jsxs(_components.ul,{children:[`\n`,_jsx(_components.li,{children:`Which Siebel views and features do users avoid?`}),`\n`,_jsx(_components.li,{children:`Why do agents skip the new Service Request view?`}),`\n`,_jsx(_components.li,{children:`Which step makes creating an order take so long?`}),`\n`,_jsx(_components.li,{children:`Which teams, roles or locations struggle the most?`}),`\n`,_jsx(_components.li,{children:`What do users say about Siebel, and what were they doing when they said it?`}),`\n`,_jsx(_components.li,{children:`Which user needs help right now?`}),`\n`]})}),`\n`,_jsx(Heading,{level:`2`,id:`what-germainux-watches`,children:`What GermainUX Watches`}),`\n`,_jsx(_components.p,{children:`GermainUX combines usage, behavior, process and technical signals from every recorded Siebel session.`}),`\n`,_jsxs(Table,{children:[_jsx(_components.thead,{children:_jsxs(_components.tr,{children:[_jsx(_components.th,{children:`Signal`}),_jsx(_components.th,{children:`What it tells you`}),_jsx(_components.th,{children:`Where it comes from`})]})}),_jsxs(_components.tbody,{children:[_jsxs(_components.tr,{children:[_jsx(_components.td,{children:_jsx(_components.strong,{children:`Adoption and active users`})}),_jsx(_components.td,{children:`How many users work in Siebel, how often and for how long, and whether it’s improving`}),_jsxs(_components.td,{children:[_jsx(_components.a,{href:`/dashboards/operational-dashboard/adoption-tab`,children:`Adoption tab`}),` on the Operational Dashboard`]})]}),_jsxs(_components.tr,{children:[_jsx(_components.td,{children:_jsx(_components.strong,{children:`Feature usage`})}),_jsx(_components.td,{children:`Which views, screens and actions users open, and which ones they avoid`}),_jsx(_components.td,{children:_jsx(_components.a,{href:`/analytics/adoption-insights#feature-usage-analysis`,children:`Feature-usage analysis`})})]}),_jsxs(_components.tr,{children:[_jsx(_components.td,{children:_jsx(_components.strong,{children:`Business processes`})}),_jsx(_components.td,{children:`Whether users complete key workflows, such as Quote to Order or Service Request open to close, and how long each step takes`}),_jsx(_components.td,{children:_jsx(_components.a,{href:`/integrations/oracle-siebel-crm/siebel-business-process-monitoring-configuration`,children:`Siebel business process monitoring`})})]}),_jsxs(_components.tr,{children:[_jsx(_components.td,{children:_jsx(_components.strong,{children:`Frictions`})}),_jsx(_components.td,{children:`Rage and dead clicks, searches with no results, repeated actions, inactivity and abandoned tasks`}),_jsx(_components.td,{children:_jsx(_components.a,{href:`/analytics/user-monitoring-and-replay#automated-friction-detection`,children:`Automated friction detection`})})]}),_jsxs(_components.tr,{children:[_jsx(_components.td,{children:_jsx(_components.strong,{children:`Errors and slowness`})}),_jsx(_components.td,{children:`Validation messages, Siebel errors and slow views that push users to a workaround`}),_jsxs(_components.td,{children:[_jsx(_components.a,{href:`/integrations/oracle-siebel-crm/siebel-error-monitoring-configuration`,children:`Siebel error monitoring`}),`, `,_jsx(_components.a,{href:`/integrations/oracle-siebel-crm/siebel-user-monitoring-and-replay-configuration`,children:`Siebel user monitoring`})]})]}),_jsxs(_components.tr,{children:[_jsx(_components.td,{children:_jsx(_components.strong,{children:`Feedback and sentiment`})}),_jsx(_components.td,{children:`What users say about their work in Siebel, and whether it’s positive or negative`}),_jsxs(_components.td,{children:[_jsx(_components.a,{href:`/integrations/oracle-siebel-crm/siebel-user-feedback-configuration`,children:`User feedback for Siebel`}),`, `,_jsx(_components.a,{href:`/analytics/sentiment-analysis-ai-driven`,children:`Sentiment Analysis`})]})]}),_jsxs(_components.tr,{children:[_jsx(_components.td,{children:_jsx(_components.strong,{children:`AI session summaries`})}),_jsx(_components.td,{children:`What each user set out to do, where they lost time, and the frictions that recur across sessions`}),_jsx(_components.td,{children:_jsx(_components.a,{href:`/analytics/ai-driven-insights#individual-session-ai-summary`,children:`AI-Driven Insights`})})]})]})]}),`\n`,_jsx(Frame,{caption:`Siebel Adoption to Friction Analysis - GermainUX`,children:_jsx(OptimizedImage,{loading:`lazy`,src:`https://mintcdn.com/germain-ux/A5V4ExbdsH-e9Odt/images/main/oracle-siebel-crm-operational-experience-intelligence/adoptiontorcasiebel-ezgif.com-video-to-gif-converter.gif?s=10ddc91473ce5b89008f8b582f14a202`,alt:`Adoption tab for Siebel with adoption, active users and friction per session, drilling down into friction analysis and recommendations`,\"data-og-width\":`800`,width:`800`,\"data-og-height\":`450`,height:`450`,\"data-path\":`images/main/oracle-siebel-crm-operational-experience-intelligence/adoptiontorcasiebel-ezgif.com-video-to-gif-converter.gif`,\"data-optimize\":`true`,\"data-opv\":`3`})}),`\n`,_jsx(Heading,{level:`2`,id:`find-the-cause`,children:`Find the Cause`}),`\n`,_jsxs(_components.p,{children:[`The investigation is the same for every adoption question. Start from the adoption KPI or the process that disappoints, find who is affected and where, rule out what stayed normal, and then watch one session as evidence. See `,_jsx(_components.a,{href:`/analytics/adoption-insights`,children:`Adoption Insights`}),` for the full method.`]}),`\n`,_jsxs(_components.ol,{children:[`\n`,_jsxs(_components.li,{children:[`Open the `,_jsx(_components.a,{href:`/dashboards/operational-dashboard/adoption-tab`,children:`Adoption tab`}),` to see which signal moved: active users, feature usage, frictions or work time.`]}),`\n`,_jsxs(_components.li,{children:[`Open the `,_jsx(_components.a,{href:`/dashboards/analytics-dashboard/4-analysis-dashboard`,children:`Analysis Dashboard`}),` on that KPI. `,_jsx(_components.a,{href:`/dashboards/analytics-dashboard/4-analysis-dashboard#leading-factors`,children:`Leading Factors`}),` show whether the problem concentrates in one team, role, view, location or browser.`]}),`\n`,_jsxs(_components.li,{children:[`Open one affected session in `,_jsx(_components.a,{href:`/analytics/user-monitoring-and-replay`,children:`Session Replay`}),` to see what the user saw and did.`]}),`\n`,_jsx(_components.li,{children:`After the fix, compare the same KPI for the same users before and after the change.`}),`\n`]}),`\n`,_jsx(Heading,{level:`3`,id:`example-agents-avoid-the-new-service-request-view`,children:`Example: Agents Avoid the New Service Request View`}),`\n`,_jsx(_components.p,{children:`Your team released a new Service Request view for the call center. In this example, about half the agents try it in the first days, but two weeks later only one agent in five still uses it. The others went back to creating Service Requests the old way.`}),`\n`,_jsxs(Steps,{children:[_jsxs(Step,{title:`Measure who uses it`,children:[_jsxs(_components.p,{children:[`Open `,_jsx(_components.a,{href:`/analytics/adoption-insights#feature-usage-analysis`,children:`feature-usage analysis`}),` for the new view. In the last 7 days, 25 agents used it, against 61 in the release week.`]}),_jsx(Frame,{caption:`Usage of the New Service Request View - GermainUX`,children:_jsx(OptimizedImage,{loading:`lazy`,src:`https://mintcdn.com/germain-ux/nEur1oy0CzSQgb4p/images/main/siebel-adoption-enhancement/new-view-usage.png?fit=max\u0026auto=format\u0026n=nEur1oy0CzSQgb4p\u0026q=85\u0026s=5e0254db56c9fe90fa2ab02033f86c58`,alt:`Analysis of clicks in the Service Request Quick Create View for the last 7 days, used by 25 agents against 61 in the release week, with daily clicks and the release markers on the Relationships chart`,\"data-og-width\":`1440`,width:`1440`,\"data-og-height\":`665`,height:`665`,\"data-path\":`images/main/siebel-adoption-enhancement/new-view-usage.png`,\"data-optimize\":`true`,\"data-opv\":`3`,srcset:`https://mintcdn.com/germain-ux/nEur1oy0CzSQgb4p/images/main/siebel-adoption-enhancement/new-view-usage.png?w=280\u0026fit=max\u0026auto=format\u0026n=nEur1oy0CzSQgb4p\u0026q=85\u0026s=0f21ca9bb64a438ff57d6d5ba4d925f1 280w, https://mintcdn.com/germain-ux/nEur1oy0CzSQgb4p/images/main/siebel-adoption-enhancement/new-view-usage.png?w=560\u0026fit=max\u0026auto=format\u0026n=nEur1oy0CzSQgb4p\u0026q=85\u0026s=a0c5d414ec44ecd6f7002f8dd11206b2 560w, https://mintcdn.com/germain-ux/nEur1oy0CzSQgb4p/images/main/siebel-adoption-enhancement/new-view-usage.png?w=840\u0026fit=max\u0026auto=format\u0026n=nEur1oy0CzSQgb4p\u0026q=85\u0026s=05b442459951be0b25b249e126c4d7ed 840w, https://mintcdn.com/germain-ux/nEur1oy0CzSQgb4p/images/main/siebel-adoption-enhancement/new-view-usage.png?w=1100\u0026fit=max\u0026auto=format\u0026n=nEur1oy0CzSQgb4p\u0026q=85\u0026s=990d5b979f8adb777f755bcd594f47ae 1100w, https://mintcdn.com/germain-ux/nEur1oy0CzSQgb4p/images/main/siebel-adoption-enhancement/new-view-usage.png?w=1650\u0026fit=max\u0026auto=format\u0026n=nEur1oy0CzSQgb4p\u0026q=85\u0026s=2d152e548b4b176dd5f02b4541e255bd 1650w, https://mintcdn.com/germain-ux/nEur1oy0CzSQgb4p/images/main/siebel-adoption-enhancement/new-view-usage.png?w=2500\u0026fit=max\u0026auto=format\u0026n=nEur1oy0CzSQgb4p\u0026q=85\u0026s=23f9f7c3e91cd4eaf00dd82cea55cadd 2500w`})}),_jsx(_components.p,{children:`To see which teams still use it, compare one team with the others. In this example, 19 of the 25 agents who still use the view are in Technical Support, nearly the whole team. The other 6 come from the other three teams together.`}),_jsx(Frame,{caption:`Technical Support Against the Other Teams - GermainUX`,children:_jsx(OptimizedImage,{loading:`lazy`,src:`https://mintcdn.com/germain-ux/nEur1oy0CzSQgb4p/images/main/siebel-adoption-enhancement/new-view-by-team.png?fit=max\u0026auto=format\u0026n=nEur1oy0CzSQgb4p\u0026q=85\u0026s=dbbffd14f5cc98b64193b5dcfeae29d3`,alt:`Compare page of clicks in the Service Request Quick Create View in the last 7 days: 19 Technical Support agents with 2,619 clicks against 6 agents in the other teams with 464 clicks`,\"data-og-width\":`1440`,width:`1440`,\"data-og-height\":`345`,height:`345`,\"data-path\":`images/main/siebel-adoption-enhancement/new-view-by-team.png`,\"data-optimize\":`true`,\"data-opv\":`3`,srcset:`https://mintcdn.com/germain-ux/nEur1oy0CzSQgb4p/images/main/siebel-adoption-enhancement/new-view-by-team.png?w=280\u0026fit=max\u0026auto=format\u0026n=nEur1oy0CzSQgb4p\u0026q=85\u0026s=35c9f5541f856a97ef0dd00ab3b73585 280w, https://mintcdn.com/germain-ux/nEur1oy0CzSQgb4p/images/main/siebel-adoption-enhancement/new-view-by-team.png?w=560\u0026fit=max\u0026auto=format\u0026n=nEur1oy0CzSQgb4p\u0026q=85\u0026s=ee80e32efe4e685c948ddb814d912dee 560w, https://mintcdn.com/germain-ux/nEur1oy0CzSQgb4p/images/main/siebel-adoption-enhancement/new-view-by-team.png?w=840\u0026fit=max\u0026auto=format\u0026n=nEur1oy0CzSQgb4p\u0026q=85\u0026s=377fb09648859dde62103aa4e793c5d5 840w, https://mintcdn.com/germain-ux/nEur1oy0CzSQgb4p/images/main/siebel-adoption-enhancement/new-view-by-team.png?w=1100\u0026fit=max\u0026auto=format\u0026n=nEur1oy0CzSQgb4p\u0026q=85\u0026s=7dbb4544912c4c8964d994d6a4049181 1100w, https://mintcdn.com/germain-ux/nEur1oy0CzSQgb4p/images/main/siebel-adoption-enhancement/new-view-by-team.png?w=1650\u0026fit=max\u0026auto=format\u0026n=nEur1oy0CzSQgb4p\u0026q=85\u0026s=d6c5a252bfec4a04f790342821063d1c 1650w, https://mintcdn.com/germain-ux/nEur1oy0CzSQgb4p/images/main/siebel-adoption-enhancement/new-view-by-team.png?w=2500\u0026fit=max\u0026auto=format\u0026n=nEur1oy0CzSQgb4p\u0026q=85\u0026s=5eed9b2fec5b6083fce790ee9659efd8 2500w`})})]}),_jsxs(Step,{title:`Find what stops the others`,children:[_jsx(_components.p,{children:`Filter the frictions to the new view. Searches with no results and back-and-forth navigation point to a discoverability problem. Validation errors and slow saves point to a usability or technical one.`}),_jsx(Frame,{caption:`Searches with No Results on the New View - GermainUX`,children:_jsx(OptimizedImage,{loading:`lazy`,src:`https://mintcdn.com/germain-ux/nEur1oy0CzSQgb4p/images/main/siebel-adoption-enhancement/new-view-no-results.png?fit=max\u0026auto=format\u0026n=nEur1oy0CzSQgb4p\u0026q=85\u0026s=7850a91b82b9b8e2b18ee8ee1d9c22c9`,alt:`Analysis of searches with no results in the new Service Request view, grouped in the first days after its release on the Relationships chart`,\"data-og-width\":`1440`,width:`1440`,\"data-og-height\":`695`,height:`695`,\"data-path\":`images/main/siebel-adoption-enhancement/new-view-no-results.png`,\"data-optimize\":`true`,\"data-opv\":`3`,srcset:`https://mintcdn.com/germain-ux/nEur1oy0CzSQgb4p/images/main/siebel-adoption-enhancement/new-view-no-results.png?w=280\u0026fit=max\u0026auto=format\u0026n=nEur1oy0CzSQgb4p\u0026q=85\u0026s=b61664755f4c400026b7c0ea1ce2637d 280w, https://mintcdn.com/germain-ux/nEur1oy0CzSQgb4p/images/main/siebel-adoption-enhancement/new-view-no-results.png?w=560\u0026fit=max\u0026auto=format\u0026n=nEur1oy0CzSQgb4p\u0026q=85\u0026s=448400601dfc7ba9b8f293d631c8f54c 560w, https://mintcdn.com/germain-ux/nEur1oy0CzSQgb4p/images/main/siebel-adoption-enhancement/new-view-no-results.png?w=840\u0026fit=max\u0026auto=format\u0026n=nEur1oy0CzSQgb4p\u0026q=85\u0026s=f2210eed2cba0376643cb4e5b2d06921 840w, https://mintcdn.com/germain-ux/nEur1oy0CzSQgb4p/images/main/siebel-adoption-enhancement/new-view-no-results.png?w=1100\u0026fit=max\u0026auto=format\u0026n=nEur1oy0CzSQgb4p\u0026q=85\u0026s=4a80a3dc0b9bdead48ee298a8e3118da 1100w, https://mintcdn.com/germain-ux/nEur1oy0CzSQgb4p/images/main/siebel-adoption-enhancement/new-view-no-results.png?w=1650\u0026fit=max\u0026auto=format\u0026n=nEur1oy0CzSQgb4p\u0026q=85\u0026s=28ceea5e594e9c6f0a368d8a043720b9 1650w, https://mintcdn.com/germain-ux/nEur1oy0CzSQgb4p/images/main/siebel-adoption-enhancement/new-view-no-results.png?w=2500\u0026fit=max\u0026auto=format\u0026n=nEur1oy0CzSQgb4p\u0026q=85\u0026s=ab0e3c1a0ca598d6fdab73868c2f584c 2500w`})}),_jsx(Frame,{caption:`Siebel Errors on the New View - GermainUX`,children:_jsx(OptimizedImage,{loading:`lazy`,src:`https://mintcdn.com/germain-ux/nEur1oy0CzSQgb4p/images/main/siebel-adoption-enhancement/new-view-validation-errors.png?fit=max\u0026auto=format\u0026n=nEur1oy0CzSQgb4p\u0026q=85\u0026s=55dff6a232b7e24ec2bf6d4e28e68695`,alt:`Analysis of Siebel error popups in the new Service Request view the day after its release, with errors per hour peaking on the release day, and markers for the user-facing errors across Siebel`,\"data-og-width\":`1440`,width:`1440`,\"data-og-height\":`665`,height:`665`,\"data-path\":`images/main/siebel-adoption-enhancement/new-view-validation-errors.png`,\"data-optimize\":`true`,\"data-opv\":`3`,srcset:`https://mintcdn.com/germain-ux/nEur1oy0CzSQgb4p/images/main/siebel-adoption-enhancement/new-view-validation-errors.png?w=280\u0026fit=max\u0026auto=format\u0026n=nEur1oy0CzSQgb4p\u0026q=85\u0026s=6c9e4fb624ab46c2b79b27a1706785a3 280w, https://mintcdn.com/germain-ux/nEur1oy0CzSQgb4p/images/main/siebel-adoption-enhancement/new-view-validation-errors.png?w=560\u0026fit=max\u0026auto=format\u0026n=nEur1oy0CzSQgb4p\u0026q=85\u0026s=c09faefd3051d3a96c0f6837292028c9 560w, https://mintcdn.com/germain-ux/nEur1oy0CzSQgb4p/images/main/siebel-adoption-enhancement/new-view-validation-errors.png?w=840\u0026fit=max\u0026auto=format\u0026n=nEur1oy0CzSQgb4p\u0026q=85\u0026s=fd4db57985acafbe0782c2d1dd261613 840w, https://mintcdn.com/germain-ux/nEur1oy0CzSQgb4p/images/main/siebel-adoption-enhancement/new-view-validation-errors.png?w=1100\u0026fit=max\u0026auto=format\u0026n=nEur1oy0CzSQgb4p\u0026q=85\u0026s=8c2c2dc772eefd5394c06d0d484303a3 1100w, https://mintcdn.com/germain-ux/nEur1oy0CzSQgb4p/images/main/siebel-adoption-enhancement/new-view-validation-errors.png?w=1650\u0026fit=max\u0026auto=format\u0026n=nEur1oy0CzSQgb4p\u0026q=85\u0026s=e53dd45c0957ebb62bf084877a1bf82a 1650w, https://mintcdn.com/germain-ux/nEur1oy0CzSQgb4p/images/main/siebel-adoption-enhancement/new-view-validation-errors.png?w=2500\u0026fit=max\u0026auto=format\u0026n=nEur1oy0CzSQgb4p\u0026q=85\u0026s=74df795c0436703c72305eacb9556ffc 2500w`})})]}),_jsx(Step,{title:`Watch one agent try`,children:_jsx(_components.p,{children:`Open a session where an agent opened the view and left it. Read its AI summary for where they gave up, then watch that moment in Session Replay.`})})]}),`\n`,_jsx(_components.p,{children:`You now know whether agents need training, a layout change or a technical fix. After the change, check that usage of the view grows for the teams that avoided it.`}),`\n`,_jsx(Heading,{level:`3`,id:`example-creating-an-order-takes-four-times-longer-than-expected`,children:`Example: Creating an Order Takes Four Times Longer Than Expected`}),`\n`,_jsx(_components.p,{children:`The order-creation process is expected to take two minutes. In this example, users need almost eight minutes, in every team, and some keep notes outside Siebel to get through it.`}),`\n`,_jsxs(Steps,{children:[_jsx(Step,{title:`Find the slow steps`,children:_jsxs(_components.p,{children:[`Open the order `,_jsx(_components.a,{href:`/integrations/oracle-siebel-crm/siebel-business-process-monitoring-configuration`,children:`business process`}),`. The step durations show where the time goes: adding line items takes over four minutes instead of one, and pricing and validating takes over two and a half instead of half a minute.`]})}),_jsxs(Step,{title:`Rule out the technology`,children:[_jsxs(_components.p,{children:[`Check the `,_jsx(_components.a,{href:`/integrations/oracle-siebel-crm/siebel-error-monitoring-configuration`,children:`errors`}),` and response times of those steps. If they stayed normal, the delay comes from the workflow itself, not from Siebel or its integrations.`]}),_jsx(Frame,{caption:`Response Time of the Order Line Items View - GermainUX`,children:_jsx(OptimizedImage,{loading:`lazy`,src:`https://mintcdn.com/germain-ux/nEur1oy0CzSQgb4p/images/main/siebel-adoption-enhancement/order-entry-response-time.png?fit=max\u0026auto=format\u0026n=nEur1oy0CzSQgb4p\u0026q=85\u0026s=7a9cf722f7c934edff1054ddd32117de`,alt:`Analysis of click response time in Order Entry - Line Items View, 1.161 seconds against 1.167 seconds the week before, flat on the Relationships chart`,\"data-og-width\":`1440`,width:`1440`,\"data-og-height\":`665`,height:`665`,\"data-path\":`images/main/siebel-adoption-enhancement/order-entry-response-time.png`,\"data-optimize\":`true`,\"data-opv\":`3`,srcset:`https://mintcdn.com/germain-ux/nEur1oy0CzSQgb4p/images/main/siebel-adoption-enhancement/order-entry-response-time.png?w=280\u0026fit=max\u0026auto=format\u0026n=nEur1oy0CzSQgb4p\u0026q=85\u0026s=994d9b6fe900eed5bbb2f133e81ff1bd 280w, https://mintcdn.com/germain-ux/nEur1oy0CzSQgb4p/images/main/siebel-adoption-enhancement/order-entry-response-time.png?w=560\u0026fit=max\u0026auto=format\u0026n=nEur1oy0CzSQgb4p\u0026q=85\u0026s=370483a416d592049b3563c2f8b99aae 560w, https://mintcdn.com/germain-ux/nEur1oy0CzSQgb4p/images/main/siebel-adoption-enhancement/order-entry-response-time.png?w=840\u0026fit=max\u0026auto=format\u0026n=nEur1oy0CzSQgb4p\u0026q=85\u0026s=2fb1d9cb42b576e2dc875c178651ce70 840w, https://mintcdn.com/germain-ux/nEur1oy0CzSQgb4p/images/main/siebel-adoption-enhancement/order-entry-response-time.png?w=1100\u0026fit=max\u0026auto=format\u0026n=nEur1oy0CzSQgb4p\u0026q=85\u0026s=92295cc101aee3a017afee1c65ed5b2a 1100w, https://mintcdn.com/germain-ux/nEur1oy0CzSQgb4p/images/main/siebel-adoption-enhancement/order-entry-response-time.png?w=1650\u0026fit=max\u0026auto=format\u0026n=nEur1oy0CzSQgb4p\u0026q=85\u0026s=227337d53fc4cbbb41556ffe893e7229 1650w, https://mintcdn.com/germain-ux/nEur1oy0CzSQgb4p/images/main/siebel-adoption-enhancement/order-entry-response-time.png?w=2500\u0026fit=max\u0026auto=format\u0026n=nEur1oy0CzSQgb4p\u0026q=85\u0026s=bc58d2613b01303e10f7820e7420111b 2500w`})})]}),_jsx(Step,{title:`See where users wait or repeat`,children:_jsxs(_components.p,{children:[`Open a slow order in Session Replay. The `,_jsx(_components.strong,{children:`Business Process`}),` tab lists each step with its status and duration, so you can jump to the step where the user waited or repeated work.`]})})]}),`\n`,_jsx(Frame,{caption:`Business Process Steps in Session Replay - GermainUX`,children:_jsx(OptimizedImage,{loading:`lazy`,src:`https://mintcdn.com/germain-ux/A5V4ExbdsH-e9Odt/images/main/oracle-siebel-crm-operational-experience-intelligence/image-20260823-160528.png?fit=max\u0026auto=format\u0026n=A5V4ExbdsH-e9Odt\u0026q=85\u0026s=c95aa9680e3d5f0e658f7fe229030e4d`,alt:`Session Replay with the Business Process tab listing each step with its status, duration and timestamp`,\"data-og-width\":`1766`,width:`1766`,\"data-og-height\":`494`,height:`494`,\"data-path\":`images/main/oracle-siebel-crm-operational-experience-intelligence/image-20260823-160528.png`,\"data-optimize\":`true`,\"data-opv\":`3`,srcset:`https://mintcdn.com/germain-ux/A5V4ExbdsH-e9Odt/images/main/oracle-siebel-crm-operational-experience-intelligence/image-20260823-160528.png?w=280\u0026fit=max\u0026auto=format\u0026n=A5V4ExbdsH-e9Odt\u0026q=85\u0026s=ed2e3f56f806cf8d06cfb8a6d27eb01d 280w, https://mintcdn.com/germain-ux/A5V4ExbdsH-e9Odt/images/main/oracle-siebel-crm-operational-experience-intelligence/image-20260823-160528.png?w=560\u0026fit=max\u0026auto=format\u0026n=A5V4ExbdsH-e9Odt\u0026q=85\u0026s=9f7d2696bd6d5ed5dd8eebafb87816d3 560w, https://mintcdn.com/germain-ux/A5V4ExbdsH-e9Odt/images/main/oracle-siebel-crm-operational-experience-intelligence/image-20260823-160528.png?w=840\u0026fit=max\u0026auto=format\u0026n=A5V4ExbdsH-e9Odt\u0026q=85\u0026s=664e127a25d6dcef761f6280ef6aba4e 840w, https://mintcdn.com/germain-ux/A5V4ExbdsH-e9Odt/images/main/oracle-siebel-crm-operational-experience-intelligence/image-20260823-160528.png?w=1100\u0026fit=max\u0026auto=format\u0026n=A5V4ExbdsH-e9Odt\u0026q=85\u0026s=38e8d1838bde46ec0cde454b9ad8bf14 1100w, https://mintcdn.com/germain-ux/A5V4ExbdsH-e9Odt/images/main/oracle-siebel-crm-operational-experience-intelligence/image-20260823-160528.png?w=1650\u0026fit=max\u0026auto=format\u0026n=A5V4ExbdsH-e9Odt\u0026q=85\u0026s=3cde2c6b916f53ad7cc343b05ed3d542 1650w, https://mintcdn.com/germain-ux/A5V4ExbdsH-e9Odt/images/main/oracle-siebel-crm-operational-experience-intelligence/image-20260823-160528.png?w=2500\u0026fit=max\u0026auto=format\u0026n=A5V4ExbdsH-e9Odt\u0026q=85\u0026s=e2b31e6cbac4cd4179b951e06eac3b6f 2500w`})}),`\n`,_jsx(_components.p,{children:`Simplify or automate the slowest step, then compare the process duration before and after the change.`}),`\n`,_jsx(Heading,{level:`2`,id:`hear-and-help-your-users`,children:`Hear and Help Your Users`}),`\n`,_jsx(_components.p,{children:`Analysis finds frictions after the fact. GermainUX can also hear from users while they work, help the ones who are stuck, and catch broken workflows before users meet them.`}),`\n`,_jsx(Heading,{level:`3`,id:`let-users-share-what-they-feel`,children:`Let Users Share What They Feel`}),`\n`,_jsxs(_components.p,{children:[`Make it easy and quick for users to tell you what they think. The `,_jsx(_components.a,{href:`/automation/user-feedback`,children:`GermainUX Feedback Popup`}),` appears inside Siebel, so a user can give a thumbs up or down, a rating or a short comment in a few seconds, without leaving their work or opening a ticket.`]}),`\n`,_jsxs(_components.p,{children:[`Each response is linked to the user’s recorded session and their Siebel context: the screen, view and applet, the recent clicks, errors and business-process steps. Open the feedback in `,_jsx(_components.a,{href:`/automation/user-feedback#investigate-with-session-replay`,children:`Session Replay`}),` to see what the user was doing and what they saw when they wrote it. Then group recurring comments with `,_jsx(_components.a,{href:`/automation/user-feedback#analyze-feedback-with-ai`,children:`AI feedback analysis`}),`, so you act on the topics that come back most often.`]}),`\n`,_jsx(Frame,{caption:`Negative Feedback on the Day of a Release - GermainUX`,children:_jsx(OptimizedImage,{loading:`lazy`,src:`https://mintcdn.com/germain-ux/nEur1oy0CzSQgb4p/images/main/siebel-adoption-enhancement/negative-feedback.png?fit=max\u0026auto=format\u0026n=nEur1oy0CzSQgb4p\u0026q=85\u0026s=92fa5b3831e05388e993daf74f4247ab`,alt:`Analysis of negative feedback from Siebel users on the day a new view is released, 27 responses against 6 the day before, peaking mid-morning`,\"data-og-width\":`1440`,width:`1440`,\"data-og-height\":`665`,height:`665`,\"data-path\":`images/main/siebel-adoption-enhancement/negative-feedback.png`,\"data-optimize\":`true`,\"data-opv\":`3`,srcset:`https://mintcdn.com/germain-ux/nEur1oy0CzSQgb4p/images/main/siebel-adoption-enhancement/negative-feedback.png?w=280\u0026fit=max\u0026auto=format\u0026n=nEur1oy0CzSQgb4p\u0026q=85\u0026s=7fcaa59d8c822e31213e42f83e4ab514 280w, https://mintcdn.com/germain-ux/nEur1oy0CzSQgb4p/images/main/siebel-adoption-enhancement/negative-feedback.png?w=560\u0026fit=max\u0026auto=format\u0026n=nEur1oy0CzSQgb4p\u0026q=85\u0026s=e4331589721ec82192ec41df2fef25ab 560w, https://mintcdn.com/germain-ux/nEur1oy0CzSQgb4p/images/main/siebel-adoption-enhancement/negative-feedback.png?w=840\u0026fit=max\u0026auto=format\u0026n=nEur1oy0CzSQgb4p\u0026q=85\u0026s=60e3bd753457a22fca537ff474836df4 840w, https://mintcdn.com/germain-ux/nEur1oy0CzSQgb4p/images/main/siebel-adoption-enhancement/negative-feedback.png?w=1100\u0026fit=max\u0026auto=format\u0026n=nEur1oy0CzSQgb4p\u0026q=85\u0026s=01db6138ab10e4a3643ea4384af1ffe5 1100w, https://mintcdn.com/germain-ux/nEur1oy0CzSQgb4p/images/main/siebel-adoption-enhancement/negative-feedback.png?w=1650\u0026fit=max\u0026auto=format\u0026n=nEur1oy0CzSQgb4p\u0026q=85\u0026s=51ed0cf9bcd524e4c8de580863e7239a 1650w, https://mintcdn.com/germain-ux/nEur1oy0CzSQgb4p/images/main/siebel-adoption-enhancement/negative-feedback.png?w=2500\u0026fit=max\u0026auto=format\u0026n=nEur1oy0CzSQgb4p\u0026q=85\u0026s=7adb27573b3f4cbded3c77be5e3deeb6 2500w`})}),`\n`,_jsxs(_components.p,{children:[`See `,_jsx(_components.a,{href:`/integrations/oracle-siebel-crm/siebel-user-feedback-configuration`,children:`User Feedback for Oracle Siebel CRM`}),`.`]}),`\n`,_jsx(Heading,{level:`3`,id:`engage-users-who-can’t-find-what-they-need`,children:`Engage Users Who Can’t Find What They Need`}),`\n`,_jsxs(_components.p,{children:[`GermainUX detects, while it happens, that a user is stuck: repeated searches with no results, back-and-forth navigation between views, rage clicks, a negative feedback comment, or a conversation that doesn’t answer their question, picked up by `,_jsx(_components.a,{href:`/analytics/sentiment-analysis-ai-driven`,children:`sentiment analysis`}),`.`]}),`\n`,_jsxs(_components.ol,{children:[`\n`,_jsxs(_components.li,{children:[_jsx(_components.strong,{children:`Detect.`}),` Real-time monitoring and sentiment analysis flag the user who can’t find what they need.`]}),`\n`,_jsxs(_components.li,{children:[_jsx(_components.strong,{children:`Alert.`}),` An `,_jsx(_components.a,{href:`/automation/notifications/create-an-alert`,children:`alert`}),` tells your support team which user needs help, what they were trying to do, and links to the session.`]}),`\n`,_jsxs(_components.li,{children:[_jsx(_components.strong,{children:`Respond.`}),` Your team reaches out to the user, through a notification or by email, and helps them finish the task.`]}),`\n`]}),`\n`,_jsxs(_components.p,{children:[`Users get help before they give up on the task, use a workaround or open a ticket. See `,_jsx(_components.a,{href:`/analytics/adoption-insights#proactive-user-engagement`,children:`Proactive User Engagement`}),`.`]}),`\n`,_jsx(Heading,{level:`3`,id:`avoid-frictions-with-synthetic-scenarios`,children:`Avoid Frictions with Synthetic Scenarios`}),`\n`,_jsxs(_components.p,{children:[`Some frictions can be caught before any user meets them. A `,_jsx(_components.a,{href:`/integrations/oracle-siebel-crm/synthetic-user-scenario-recording`,children:`synthetic user scenario`}),`, recorded with the RPA Bot Recorder, runs a key Siebel workflow on a schedule, such as signing in, searching for an account and creating a Service Request. GermainUX alerts you when a step fails or slows down. Add `,_jsx(_components.a,{href:`/automation/synthetic-http-execution`,children:`HTTP checks`}),` for the web services and integrations behind the workflow.`]}),`\n`,_jsx(Heading,{level:`2`,id:`prioritize-and-act`,children:`Prioritize and Act`}),`\n`,_jsx(_components.p,{children:`Each finding can start a response:`}),`\n`,_jsx(`div`,{className:`gx-list`,children:_jsxs(_components.ul,{children:[`\n`,_jsxs(_components.li,{children:[_jsx(_components.strong,{children:_jsx(_components.a,{href:`/analytics/adoption-insights#automated-adoption-reports`,children:`Adoption reports`})}),` that deliver adoption trends, frictions and lost time to application owners and managers every week or month`]}),`\n`,_jsxs(_components.li,{children:[_jsx(_components.strong,{children:_jsx(_components.a,{href:`/analytics/slas`,children:`SLAs`})}),` on adoption, friction and process-duration KPIs, so a new or growing problem raises an alert`]}),`\n`,_jsxs(_components.li,{children:[_jsx(_components.strong,{children:_jsx(_components.a,{href:`/dashboards/ai-advice-dashboard`,children:`The AI Advice dashboard`})}),` as the team’s shared list of improvements, ranked by estimated gain`]}),`\n`,_jsxs(_components.li,{children:[_jsx(_components.strong,{children:_jsx(_components.a,{href:`/automation/notifications/alert-email-and-sms`,children:`Alerts`})}),` by email, SMS, `,_jsx(_components.a,{href:`/automation/notifications/microsoft-teams-notification`,children:`Microsoft Teams`}),` or `,_jsx(_components.a,{href:`/automation/notifications/slack`,children:`Slack`}),`, routed to the team that owns the fix`]}),`\n`]})}),`\n`,_jsx(Heading,{level:`2`,id:`set-it-up`,children:`Set It Up`}),`\n`,_jsx(_components.p,{children:`Each step adds value on its own. Start with user monitoring, then add the rest.`}),`\n`,_jsxs(Steps,{children:[_jsx(Step,{title:`Record Siebel sessions`,children:_jsxs(_components.p,{children:[_jsx(_components.a,{href:`/integrations/oracle-siebel-crm/deploy-rum-js-siebel-openui`,children:`Deploy RUM JS in Siebel Open UI`}),`, then `,_jsx(_components.a,{href:`/integrations/oracle-siebel-crm/siebel-user-monitoring-and-replay-configuration`,children:`create the Siebel UX Monitoring Profile`}),` with Session Replay and the privacy settings you need. Add each user’s team and role with `,_jsx(_components.a,{href:`/analytics/user-role-lookup`,children:`User Role Lookup`}),`, so the analysis can compare them.`]})}),_jsx(Step,{title:`Configure your processes`,children:_jsxs(_components.p,{children:[_jsx(_components.a,{href:`/integrations/oracle-siebel-crm/siebel-business-process-monitoring-configuration`,children:`Configure business processes`}),` for the workflows that matter most to adoption, such as order creation or Service Request handling, with their expected duration.`]})}),_jsx(Step,{title:`Turn on the feedback popup`,children:_jsxs(_components.p,{children:[_jsx(_components.a,{href:`/integrations/oracle-siebel-crm/siebel-user-feedback-configuration`,children:`Enable the Feedback Popup`}),` in the Siebel UX Monitoring Profile, and decide who reviews and responds to feedback.`]})}),_jsx(Step,{title:`Alert your support team`,children:_jsxs(_components.p,{children:[_jsx(_components.a,{href:`/automation/notifications/create-an-alert`,children:`Create alerts`}),` on the frictions, negative feedback and sentiment that mean a user needs help, and send them to the channel your support team watches.`]})}),_jsx(Step,{title:`Test key workflows`,children:_jsxs(_components.p,{children:[_jsx(_components.a,{href:`/integrations/oracle-siebel-crm/rpa-bot-recorder-deployment-for-oracle-siebel-crm`,children:`Deploy the RPA Bot Recorder`}),`, then `,_jsx(_components.a,{href:`/integrations/oracle-siebel-crm/synthetic-user-scenario-recording`,children:`record a synthetic scenario`}),` for each critical workflow and run it from a GermainUX Engine.`]})}),_jsx(Step,{title:`Schedule the reports`,children:_jsxs(_components.p,{children:[`Schedule `,_jsx(_components.a,{href:`/automation/notifications/reporting-automatic`,children:`adoption reports`}),` and the `,_jsx(_components.a,{href:`/analytics/ai-driven-insights#scheduled-bulk-session-ai-analysis`,children:`bulk session AI analysis`}),` for the teams that act on them.`]})})]}),`\n`,_jsx(Heading,{level:`2`,id:`additional-resources`,children:`Additional Resources`}),`\n`,_jsxs(CardGroup,{cols:3,children:[_jsx(Card,{title:`Adoption Insights`,icon:`users`,href:`/analytics/adoption-insights`,children:_jsx(_components.p,{children:`Measure and improve adoption`})}),_jsx(Card,{title:`Oracle Siebel CRM`,icon:`plug`,href:`/integrations/oracle-siebel-crm`,children:_jsx(_components.p,{children:`Users, processes, servers and more`})}),_jsx(Card,{title:`Use Cases`,icon:`lightbulb`,href:`/use-cases/overview`,children:_jsx(_components.p,{children:`More Use Cases`})})]}),`\n`,_jsx(Heading,{level:`2`,id:`get-help`,children:`Get Help`}),`\n`,_jsx(_components.p,{children:`Every Siebel deployment has its own applications, processes and user groups. The GermainUX team can help you choose the processes to monitor, set up the feedback popup and the support alerts, and record the synthetic scenarios for your key workflows.`}),`\n`,_jsxs(CardGroup,{cols:2,children:[_jsx(Card,{title:`Contact GermainUX Support`,icon:`headset`,href:`/getting-started/support`,children:_jsx(_components.p,{children:`The GermainUX team helps you get up and running faster, empower your team, turn data into actionable insights, and optimize performance to deliver measurable business outcomes.`})}),_jsx(Card,{title:`Can't Find What You Need?`,icon:`magnifying-glass`,children:_jsxs(_components.p,{children:[`Search all GermainUX docs with `,_jsx(_components.strong,{children:`Ctrl + K`}),`, or use the feedback buttons at the bottom of this page to tell us what is missing.`]})})]}),`\n`,_jsx(_MdxComponentBoundary,{name:`GxFooter`,children:_jsx(GxFooter,{})}),`\n`,_jsx(_MdxComponentBoundary,{name:`GxStyle`,children:_jsx(GxStyle,{})})]})}function MDXContent(props={}){const{wrapper:MDXLayout}={..._provideComponents(),...props.components};return MDXLayout?_jsx(MDXLayout,{...props,children:_jsx(_createMdxContent,{...props})}):_createMdxContent(props)}return{GxFooter,GxStyle,default:MDXContent};function _missingMdxReference(id,component){throw new Error(`Expected `+(component?`component`:`object`)+\" `\"+id+\"` to be defined: you likely forgot to import, pass, or provide it.\")}","frontmatter":{},"scope":{"config":{},"pageMetadata":{"title":"Increase Oracle Siebel CRM Adoption by Finding, Hearing and Helping Stuck Users","sidebarTitle":"Siebel Adoption Enhancement","description":"Find what keeps users from adopting Oracle Siebel CRM, let them tell you in seconds, and help the ones who are stuck before they give up.","icon":"lightbulb","keywords":["Siebel adoption","Oracle Siebel CRM adoption","CRM adoption","Siebel user experience","Siebel user feedback","Siebel productivity","Siebel session replay","Siebel synthetic monitoring","user sentiment analysis"],"href":"/use-cases/siebel-adoption-enhancement"}}},"mdxSourceWithNoJs":null,"noJsSplices":[[136,153,"Style=()=>null;const GxFooter=()=>_jsx(`"],[255,12837,""],[49476,49496,"Style,GxFooter,defau"]]},"mdxExtracts":{"tableOfContents":[{"title":"Overview","slug":"overview","depth":2,"children":[{"title":"Questions It Answers","slug":"questions-it-answers","depth":3,"children":[]}]},{"title":"What GermainUX Watches","slug":"what-germainux-watches","depth":2,"children":[]},{"title":"Find the Cause","slug":"find-the-cause","depth":2,"children":[{"title":"Example: Agents Avoid the New Service Request View","slug":"example-agents-avoid-the-new-service-request-view","depth":3,"children":[]},{"title":"Example: Creating an Order Takes Four Times Longer Than Expected","slug":"example-creating-an-order-takes-four-times-longer-than-expected","depth":3,"children":[]}]},{"title":"Hear and Help Your Users","slug":"hear-and-help-your-users","depth":2,"children":[{"title":"Let Users Share What They Feel","slug":"let-users-share-what-they-feel","depth":3,"children":[]},{"title":"Engage Users Who Can’t Find What They Need","slug":"engage-users-who-can’t-find-what-they-need","depth":3,"children":[]},{"title":"Avoid Frictions with Synthetic Scenarios","slug":"avoid-frictions-with-synthetic-scenarios","depth":3,"children":[]}]},{"title":"Prioritize and Act","slug":"prioritize-and-act","depth":2,"children":[]},{"title":"Set It Up","slug":"set-it-up","depth":2,"children":[]},{"title":"Additional Resources","slug":"additional-resources","depth":2,"children":[]},{"title":"Get Help","slug":"get-help","depth":2,"children":[]}],"codeExamples":{}},"jsLinks":[],"subdomain":"germain-ux","siteName":"GermainUX Docs","title":"Increase Oracle Siebel CRM Adoption by Finding, Hearing and Helping Stuck Users - GermainUX Docs","navMaps":{"firstHrefInVersion":{},"firstHrefInLanguage":{}},"lastModified":"2026-11-17T13:44:29.203Z","originalFileLocation":"use-cases/siebel-adoption-enhancement.mdx"},"headHtml":"\u003cscript data-mint-head>(function(){var d=document.documentElement,p=null;if(!p){try{p=localStorage.getItem(\"isDarkMode\")}catch(e){}if(p==='true')p='dark';else if(p==='false')p='light';if(p!=='light'\u0026\u0026p!=='dark'\u0026\u0026p!=='system')p=\"light\"}var r=p==='system'?(matchMedia(\"(prefers-color-scheme: dark)\").matches?'dark':'light'):p;d.classList.remove(r==='dark'?'light':'dark');d.classList.add(r);d.setAttribute(\"data-theme-preference\",p)})();\u003c/script>\u003cmeta data-mint-head name=\"description\" content=\"Find what keeps users from adopting Oracle Siebel CRM, let them tell you in seconds, and help the ones who are stuck before they give up.\">\u003cmeta data-mint-head name=\"application-name\" content=\"GermainUX Docs\">\u003cmeta data-mint-head name=\"generator\" content=\"Mintlify\">\u003clink data-mint-head rel=\"icon\" type=\"image/png\" sizes=\"192x192\" href=\"/mintlify-assets/_mintlify/favicons/germain-ux/_Kw8Od9IpYFcCZNX/_generated/favicon/android-chrome-192x192.png\" media=\"(prefers-color-scheme: light)\">\u003clink data-mint-head rel=\"apple-touch-icon\" type=\"image/png\" sizes=\"180x180\" href=\"/mintlify-assets/_mintlify/favicons/germain-ux/_Kw8Od9IpYFcCZNX/_generated/favicon/apple-touch-icon.png\">\u003clink data-mint-head rel=\"icon\" type=\"image/png\" sizes=\"16x16\" href=\"/mintlify-assets/_mintlify/favicons/germain-ux/_Kw8Od9IpYFcCZNX/_generated/favicon/favicon-16x16.png\" media=\"(prefers-color-scheme: light)\">\u003clink data-mint-head rel=\"icon\" type=\"image/png\" sizes=\"32x32\" href=\"/mintlify-assets/_mintlify/favicons/germain-ux/_Kw8Od9IpYFcCZNX/_generated/favicon/favicon-32x32.png\" media=\"(prefers-color-scheme: light)\">\u003clink data-mint-head rel=\"shortcut icon\" type=\"image/x-icon\" href=\"/mintlify-assets/_mintlify/favicons/germain-ux/_Kw8Od9IpYFcCZNX/_generated/favicon/favicon.ico\" media=\"(prefers-color-scheme: light)\">\u003clink data-mint-head rel=\"icon\" type=\"image/png\" sizes=\"192x192\" href=\"/mintlify-assets/_mintlify/favicons/germain-ux/_Kw8Od9IpYFcCZNX/_generated/favicon-dark/android-chrome-192x192.png\" media=\"(prefers-color-scheme: dark)\">\u003clink data-mint-head rel=\"icon\" type=\"image/png\" sizes=\"16x16\" href=\"/mintlify-assets/_mintlify/favicons/germain-ux/_Kw8Od9IpYFcCZNX/_generated/favicon-dark/favicon-16x16.png\" media=\"(prefers-color-scheme: dark)\">\u003clink data-mint-head rel=\"icon\" type=\"image/png\" sizes=\"32x32\" href=\"/mintlify-assets/_mintlify/favicons/germain-ux/_Kw8Od9IpYFcCZNX/_generated/favicon-dark/favicon-32x32.png\" media=\"(prefers-color-scheme: dark)\">\u003clink data-mint-head rel=\"shortcut icon\" type=\"image/x-icon\" href=\"/mintlify-assets/_mintlify/favicons/germain-ux/_Kw8Od9IpYFcCZNX/_generated/favicon-dark/favicon.ico\" media=\"(prefers-color-scheme: dark)\">\u003cmeta data-mint-head property=\"og:title\" content=\"Increase Oracle Siebel CRM Adoption by Finding, Hearing and Helping Stuck Users - GermainUX Docs\">\u003cmeta data-mint-head property=\"og:description\" content=\"Find what keeps users from adopting Oracle Siebel CRM, let them tell you in seconds, and help the ones who are stuck before they give up.\">\u003cmeta data-mint-head property=\"og:site_name\" content=\"GermainUX Docs\">\u003cmeta data-mint-head property=\"og:url\" content=\"https://docs.germainux.com/use-cases/siebel-adoption-enhancement\">\u003cmeta data-mint-head property=\"og:type\" content=\"website\">\u003cmeta data-mint-head property=\"og:image\" content=\"https://germain-ux.mintlify.site/_mintlify/api/og/v2?division=Use+Cases\u0026amp;title=Increase+Oracle+Siebel+CRM+Adoption+by+Finding%2C+Hearing+and+Helping+Stuck+Users\u0026amp;description=Find+what+keeps+users+from+adopting+Oracle+Siebel+CRM%2C+let+them+tell+you+in+seconds%2C+and+help+the+ones+who+are+stuck+before+they+give+up.\u0026amp;theme=f29cc06a49affea3bfdf77b7\u0026amp;signature=4d67149c6895fd615ebbe0aa50054509c805485ce7ff9eef9a27515f019d179f\">\u003cmeta data-mint-head property=\"og:image:width\" content=\"1200\">\u003cmeta data-mint-head property=\"og:image:height\" content=\"630\">\u003cmeta data-mint-head name=\"twitter:card\" content=\"summary_large_image\">\u003cmeta data-mint-head name=\"twitter:title\" content=\"Increase Oracle Siebel CRM Adoption by Finding, Hearing and Helping Stuck Users - GermainUX Docs\">\u003cmeta data-mint-head name=\"twitter:description\" content=\"Find what keeps users from adopting Oracle Siebel CRM, let them tell you in seconds, and help the ones who are stuck before they give up.\">\u003cmeta data-mint-head name=\"twitter:image\" content=\"https://germain-ux.mintlify.site/_mintlify/api/og/v2?division=Use+Cases\u0026amp;title=Increase+Oracle+Siebel+CRM+Adoption+by+Finding%2C+Hearing+and+Helping+Stuck+Users\u0026amp;description=Find+what+keeps+users+from+adopting+Oracle+Siebel+CRM%2C+let+them+tell+you+in+seconds%2C+and+help+the+ones+who+are+stuck+before+they+give+up.\u0026amp;theme=f29cc06a49affea3bfdf77b7\u0026amp;signature=4d67149c6895fd615ebbe0aa50054509c805485ce7ff9eef9a27515f019d179f\">\u003cmeta data-mint-head name=\"twitter:image:width\" content=\"1200\">\u003cmeta data-mint-head name=\"twitter:image:height\" content=\"630\">\u003cmeta data-mint-head name=\"msapplication-config\" content=\"/mintlify-assets/_mintlify/favicons/germain-ux/_Kw8Od9IpYFcCZNX/_generated/favicon/browserconfig.xml\">\u003cmeta data-mint-head name=\"apple-mobile-web-app-title\" content=\"GermainUX Docs\">\u003cmeta data-mint-head name=\"msapplication-TileColor\" content=\"#2E7DF2\">\u003cmeta data-mint-head name=\"og:locale\" content=\"en_US\">\u003clink data-mint-head rel=\"canonical\" href=\"https://docs.germainux.com/use-cases/siebel-adoption-enhancement\">\u003clink data-mint-head rel=\"alternate\" type=\"application/xml\" href=\"/sitemap.xml\">\u003clink data-mint-head rel=\"alternate\" type=\"text/markdown\" href=\"/use-cases/siebel-adoption-enhancement.md\">\u003cscript data-mint-head type=\"application/ld+json\">{\"@context\":\"https://schema.org\",\"@graph\":[{\"@type\":\"Organization\",\"@id\":\"https://docs.germainux.com/#organization\",\"name\":\"GermainUX Docs\",\"url\":\"https://docs.germainux.com\",\"logo\":{\"@type\":\"ImageObject\",\"url\":\"https://mintcdn.com/germain-ux/ok7-BbqwVV0uk3t8/images/logo-light.png?fit=max\u0026auto=format\u0026n=ok7-BbqwVV0uk3t8\u0026q=85\u0026s=3cfe3238ac55802e43da3e4da5806f0d\"}},{\"@type\":\"WebSite\",\"@id\":\"https://docs.germainux.com#website\",\"name\":\"GermainUX Docs\",\"url\":\"https://docs.germainux.com\",\"publisher\":{\"@id\":\"https://docs.germainux.com/#organization\"}},{\"@type\":\"WebPage\",\"@id\":\"https://docs.germainux.com/use-cases/siebel-adoption-enhancement#webpage\",\"url\":\"https://docs.germainux.com/use-cases/siebel-adoption-enhancement\",\"name\":\"Increase Oracle Siebel CRM Adoption by Finding, Hearing and Helping Stuck Users\",\"description\":\"Find what keeps users from adopting Oracle Siebel CRM, let them tell you in seconds, and help the ones who are stuck before they give up.\",\"dateModified\":\"2026-11-17T13:44:29.203Z\",\"isPartOf\":{\"@id\":\"https://docs.germainux.com#website\"},\"breadcrumb\":{\"@id\":\"https://docs.germainux.com/use-cases/siebel-adoption-enhancement#breadcrumb\"}},{\"@type\":\"BreadcrumbList\",\"@id\":\"https://docs.germainux.com/use-cases/siebel-adoption-enhancement#breadcrumb\",\"itemListElement\":[{\"@type\":\"ListItem\",\"position\":1,\"name\":\"Use Cases\",\"item\":\"https://docs.germainux.com/use-cases/overview\"},{\"@type\":\"ListItem\",\"position\":2,\"name\":\"Increase Oracle Siebel CRM Adoption by Finding, Hearing and Helping Stuck Users\",\"item\":\"https://docs.germainux.com/use-cases/siebel-adoption-enhancement\"}]},{\"@type\":[\"Article\",\"TechArticle\"],\"@id\":\"https://docs.germainux.com/use-cases/siebel-adoption-enhancement#article\",\"headline\":\"Increase Oracle Siebel CRM Adoption by Finding, Hearing and Helping Stuck Users\",\"name\":\"Increase Oracle Siebel CRM Adoption by Finding, Hearing and Helping Stuck Users\",\"description\":\"Find what keeps users from adopting Oracle Siebel CRM, let them tell you in seconds, and help the ones who are stuck before they give up.\",\"url\":\"https://docs.germainux.com/use-cases/siebel-adoption-enhancement\",\"mainEntityOfPage\":{\"@id\":\"https://docs.germainux.com/use-cases/siebel-adoption-enhancement#webpage\"},\"dateModified\":\"2026-11-17T13:44:29.203Z\",\"keywords\":\"Siebel adoption, Oracle Siebel CRM adoption, CRM adoption, Siebel user experience, Siebel user feedback, Siebel productivity, Siebel session replay, Siebel synthetic monitoring, user sentiment analysis\",\"publisher\":{\"@id\":\"https://docs.germainux.com/#organization\"},\"isPartOf\":{\"@id\":\"https://docs.germainux.com#website\"}}]}\u003c/script>\u003cscript data-mint-head type=\"application/ld+json\">{\"@context\":\"https://schema.org\",\"@type\":\"WebSite\",\"name\":\"GermainUX Docs\",\"publisher\":{\"@type\":\"Organization\",\"name\":\"GermainUX Docs\"},\"provider\":{\"@type\":\"Organization\",\"name\":\"Mintlify\",\"url\":\"https://mintlify.com\"}}\u003c/script>","agentPointerHref":"/use-cases/siebel-adoption-enhancement.md","siteName":"GermainUX Docs","nav":{"global":null,"tabs":[{"tab":"Documentation","pages":[{"title":"Documentation","href":""}]},{"tab":"Release Notes","pages":[{"title":"Release Notes","href":"/release-notes/overview"}]},{"tab":"Success Stories","pages":[{"title":"Success Stories","href":"/success-stories/overview"}]},{"tab":"Use Cases","groups":[{"group":"Use Cases","icon":"lightbulb","pages":[{"title":"Use Cases","sidebarTitle":"Use Cases","icon":"lightbulb","href":"/use-cases/overview"},{"title":"Prevent and Trace Failed Orders Across Salesforce, MuleSoft and SAP ERP","sidebarTitle":"Failed-Order Monitoring (Salesforce\u003c->MuleSoft\u003c->SAP)","icon":"lightbulb","href":"/use-cases/order-to-erp-monitoring"},{"title":"Find What Slows Down Your Salesforce Users Without Watching Every Session","sidebarTitle":"Salesforce AI Productivity Analysis","icon":"lightbulb","href":"/use-cases/salesforce-ai-friction-discovery"},{"title":"Save Customers Who Are About to Cancel on Salesforce Experience Cloud and Genesys Chat","sidebarTitle":"Salesforce Cancellation Prevention","icon":"lightbulb","href":"/use-cases/cancellation-journey-monitoring"},{"title":"Find Why Conversion Dropped on Your Shopify Store","sidebarTitle":"Shopify Conversion-Drop Analysis","description":"Find out why your store's conversion fell, whether the cause is a failing integration, a release or the traffic itself, and see the sessions behind it.","icon":"lightbulb","href":"/use-cases/conversion-drop-analysis"},{"title":"Increase Oracle Siebel CRM Adoption by Finding, Hearing and Helping Stuck Users","sidebarTitle":"Siebel Adoption Enhancement","icon":"lightbulb","href":"/use-cases/siebel-adoption-enhancement"}]}]}]},"basePath":"","title":"Increase Oracle Siebel CRM Adoption by Finding, Hearing and Helping Stuck Users - GermainUX Docs","deploymentId":"dpl_HhUetB7eHHDAmK9T1Teip38TgFx9","buildId":"dpl_HhUetB7eHHDAmK9T1Teip38TgFx9","dynamics":["07c022d89b","a74be98ba7"],"chunks":["Frame-DevImLcx.js","DynamicMarkdown-BGHukeRM.js","zoom-image-lightbox-DQG3o8Eu.js","lightbox-handle-r17bVUz3.js"]}