

What GermainUX Watches
Find the Cause
Alert and Act
Set It Up
Overview
Something went wrong in production, and a release went out this morning. The first question in the incident call is always the same: did the release cause it, and should we roll back? Developers, operations and database teams each check their own layer, and the release that caused it may not be the one everybody suspects. A health check answers only part of it. A bad release can fail half the calls of one API, slow down two pages without a single error, or leak resources for hours before anything breaks. Each one shows on a different layer and at a different time. GermainUX puts the releases on the same timeline as the KPIs of every layer. It compares the period after the release with the period before, shows which API, endpoint or host changed, and lets you rule out what stayed normal. You decide to roll back or fix forward from evidence, and then confirm that it worked.Questions It Answers
- Did this morning’s release cause the problem?
- Should we roll back, or fix forward?
- Which layer changed: the API, the web servers or the database?
- How many orders or users did the release affect?
- Is a release slowing things down without raising any error?
- Did the rollback bring everything back to normal?
What GermainUX Watches
GermainUX keeps each signal as a KPI, so the analysis can compare the time after a release with the time before.Find the Cause
The investigation follows the same path for every release:- Open Aggregate Analysis on the KPI that raised the alert, from before the release to now. GermainUX compares the period with its baseline.
- Find the release on the Relationships chart. A marker, or the first change in a KPI, shows when it started.
- Read the Leading Factors to see which API, operation, route or host changed, and check the Related KPIs on the other layers.
- Rule out what stayed normal. It tells you whether the release is the only suspect.
- Roll back or fix, then run the same analysis on the period after.
Example: A Payments API Release Fails Almost Half the Payments
At 08:00, a new version of the payments API rolls out on MuleSoft. Five minutes later, payments start to fail. In this example, 45% of payment calls fail, against less than 1% before.Spot the failures
POST /api/payments jump at 08:05, with a new error type, MULE:EXPRESSION. Response time doesn’t change, so an alert on response time alone wouldn’t fire.Find the release
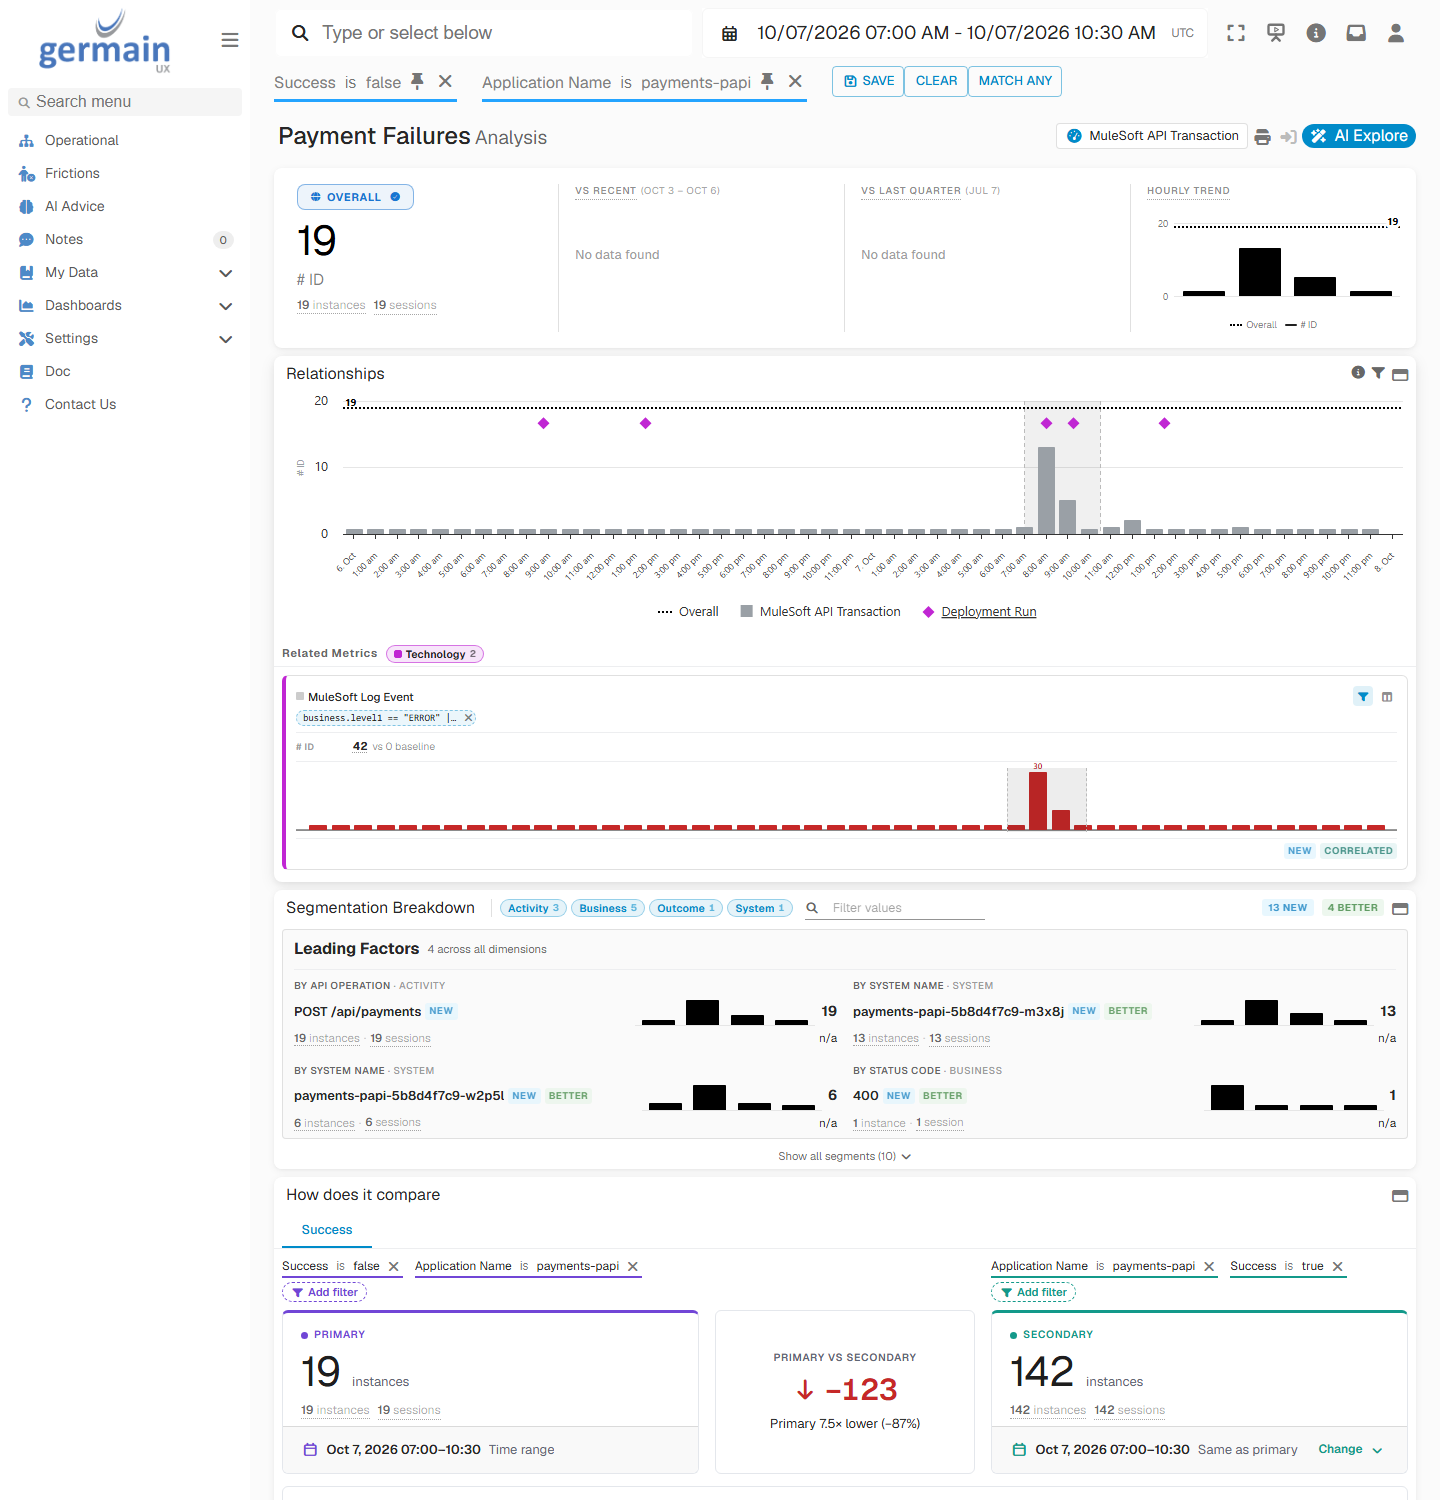
Payment Failures After the Payments API Release - GermainUX
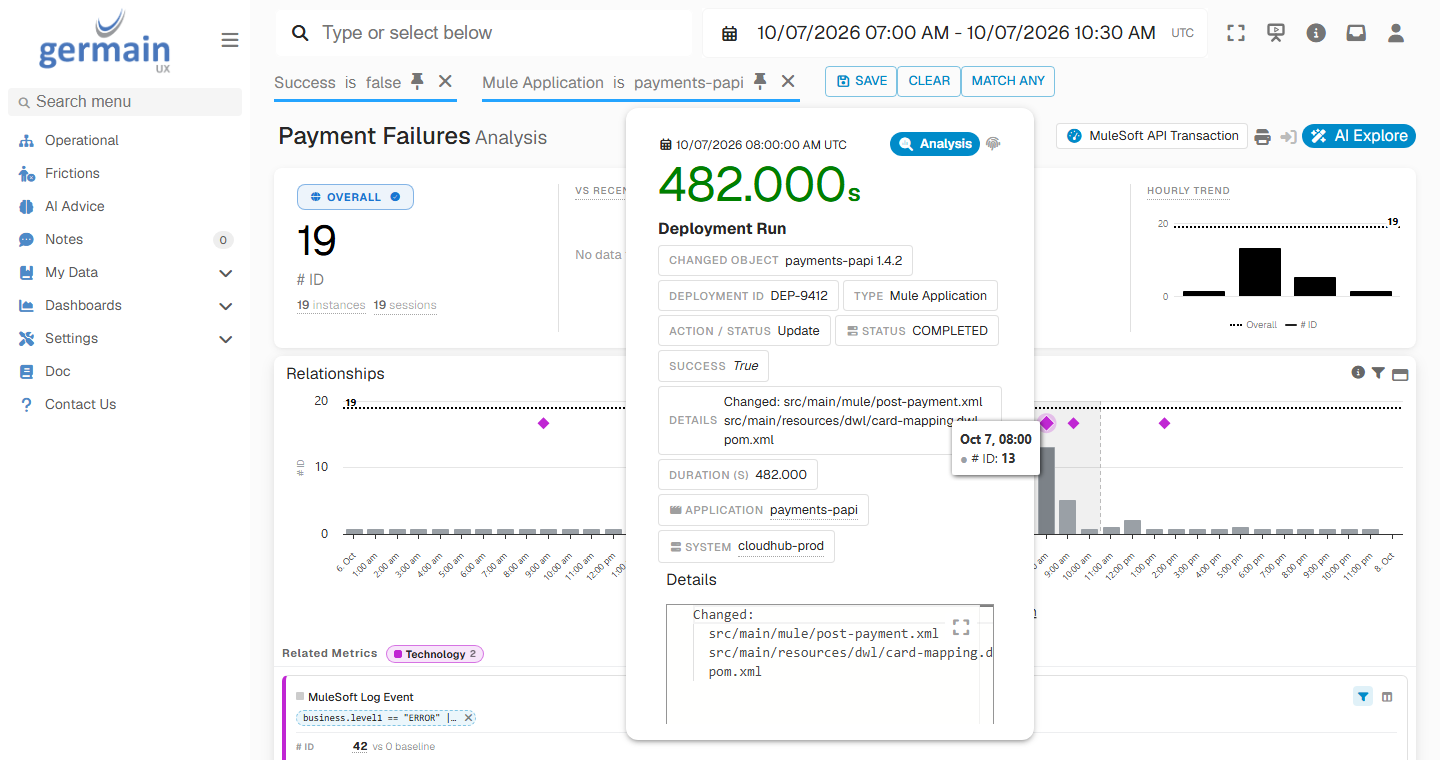
Payments API Release Details on the Release Marker - GermainUX
Measure the impact
502 on the calls that need a payment, so about 45% of order placements fail too.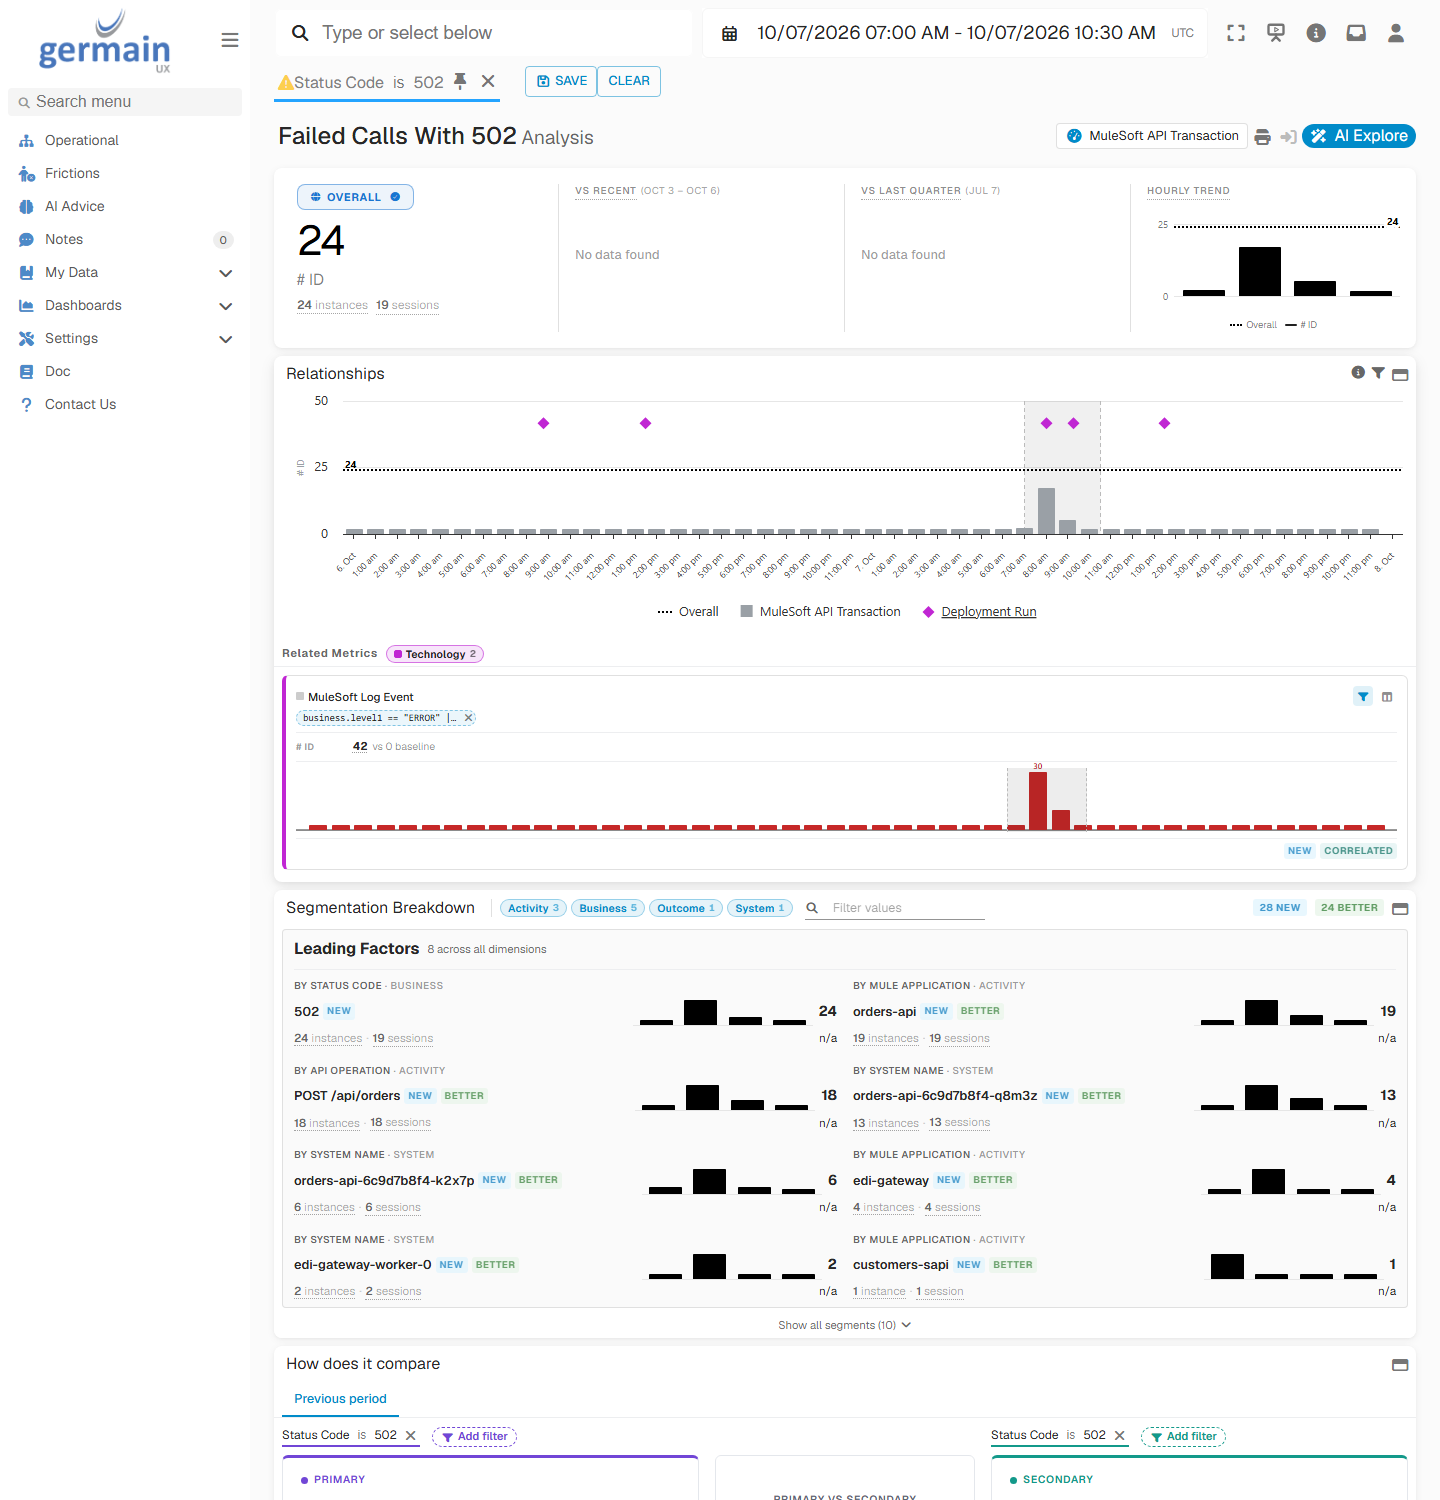
Calls Failing With 502 After the Payments API Release - GermainUX
Rule out the rest
Example: A Storefront Release Makes Search Four Times Slower
At 11:00, a storefront release changes the search and product-review pages. Nothing fails: every request still returns200. But in this example, search takes about 1 second instead of 0.3, and reviews 0.7 seconds instead of 0.18.
Spot the slowdown
Find the release
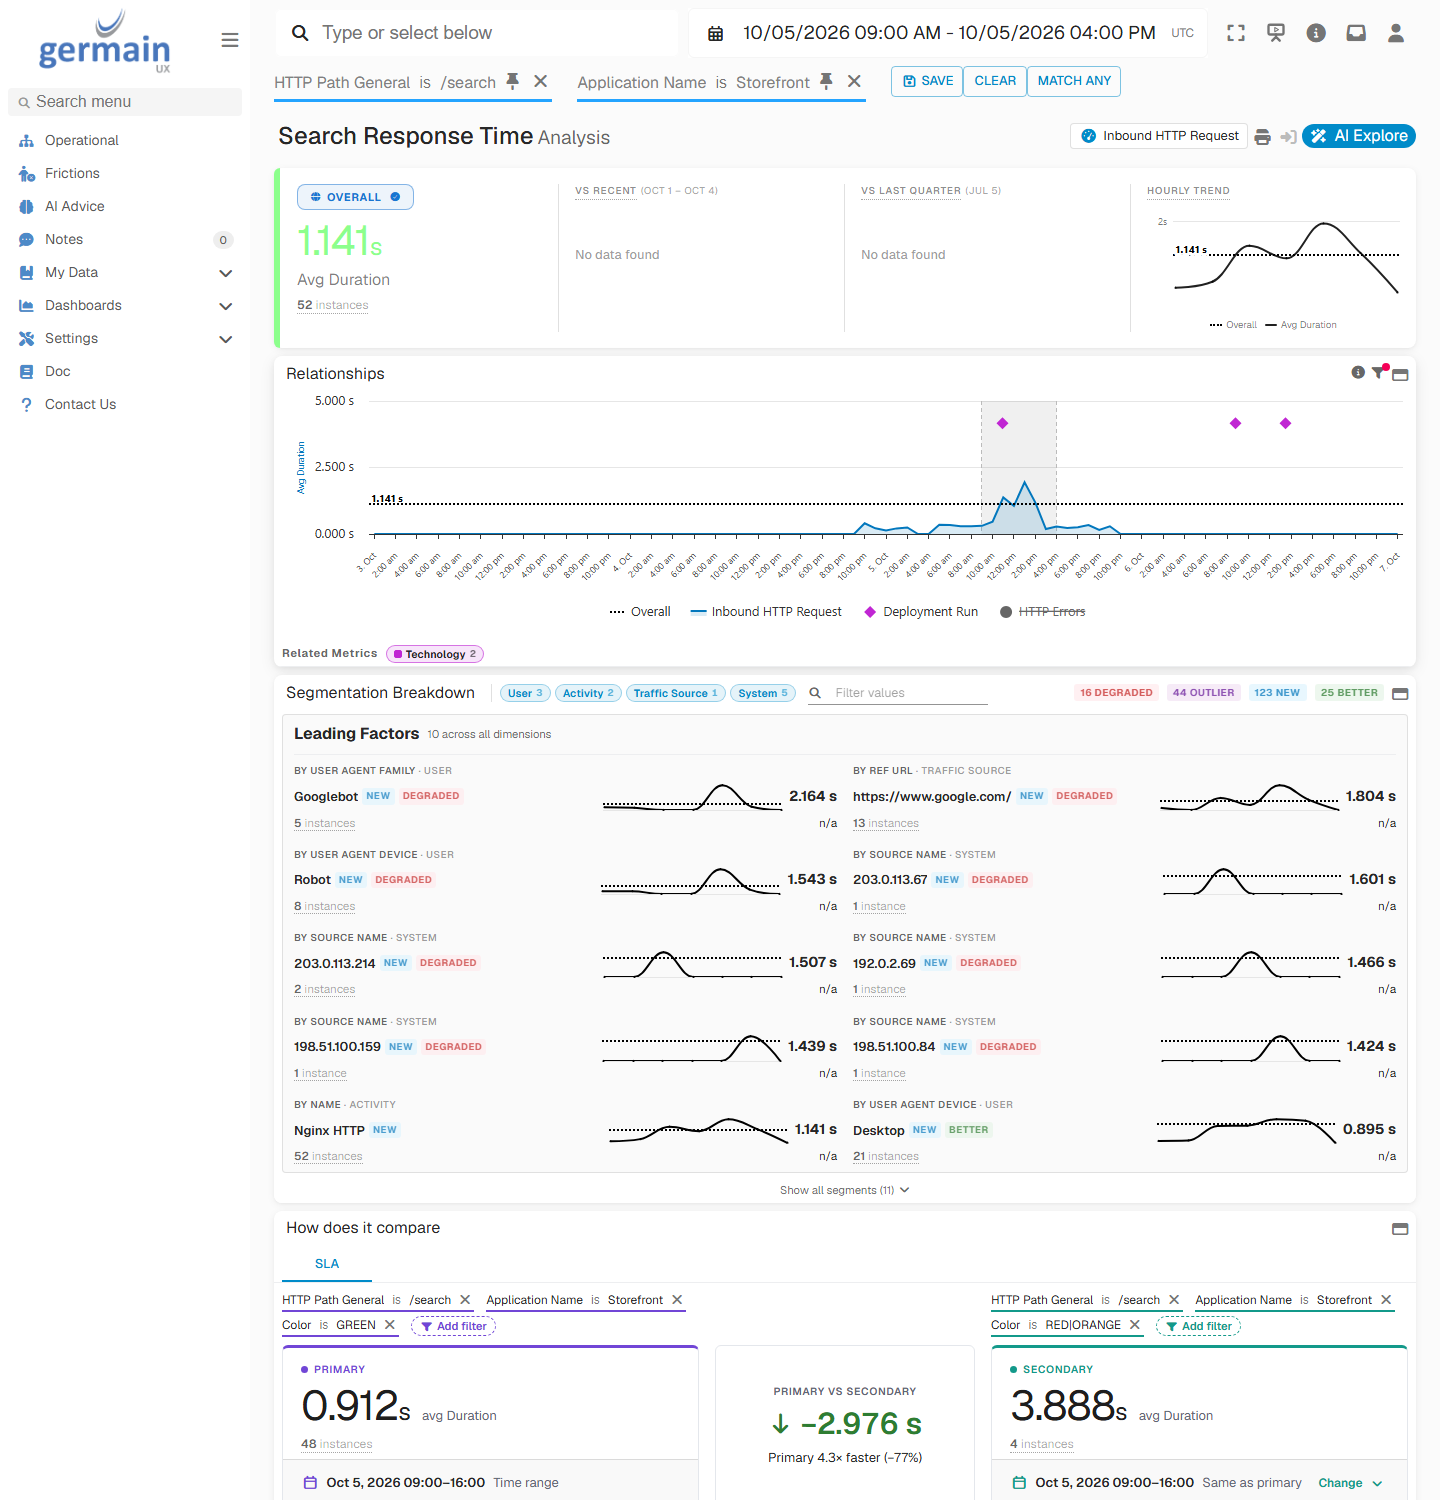
Search Response Time After the Storefront Release - GermainUX
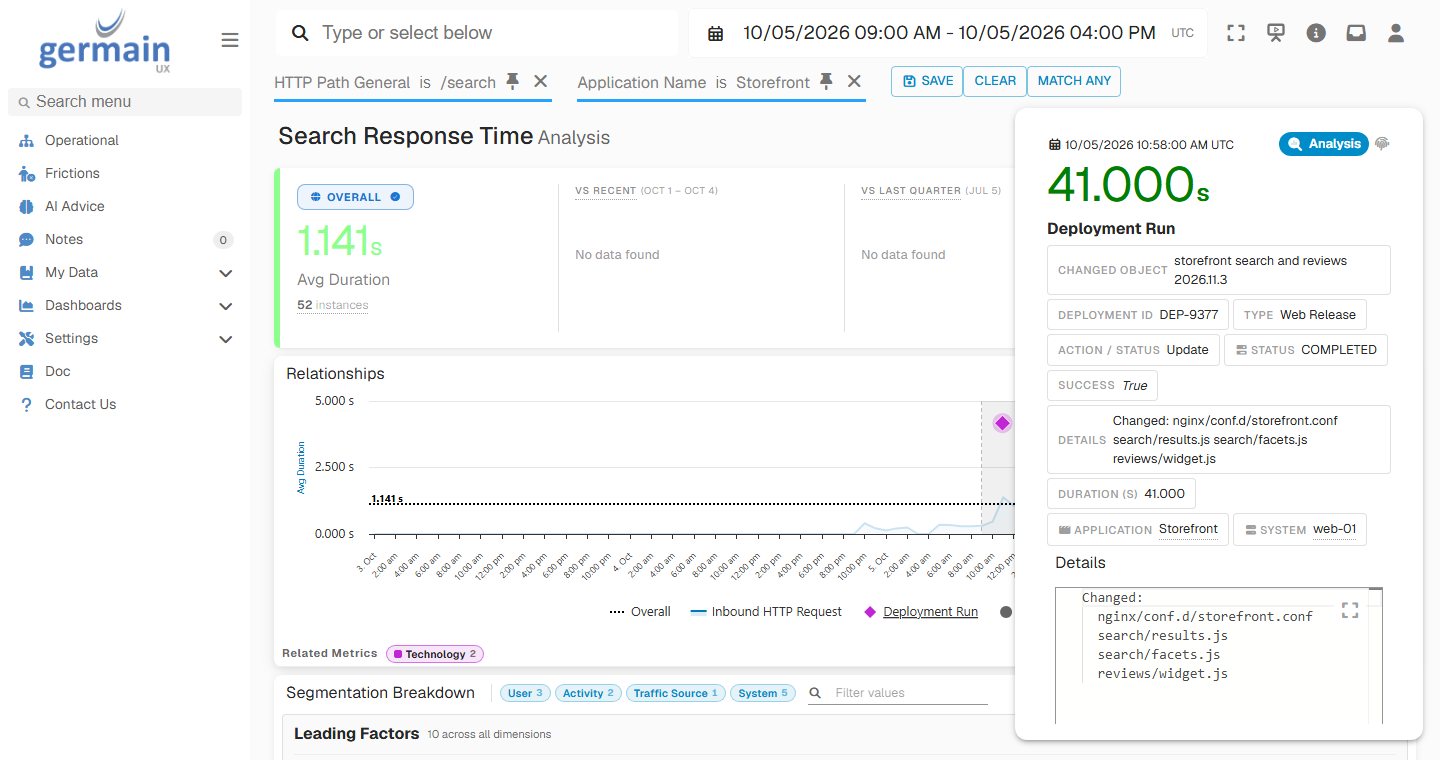
Storefront Release Details on the Release Marker - GermainUX
Read what changed
/search averages 1.1 seconds and stands out as an outlier, while the other storefront routes stay below 0.2 seconds. The product-review API slowed down too.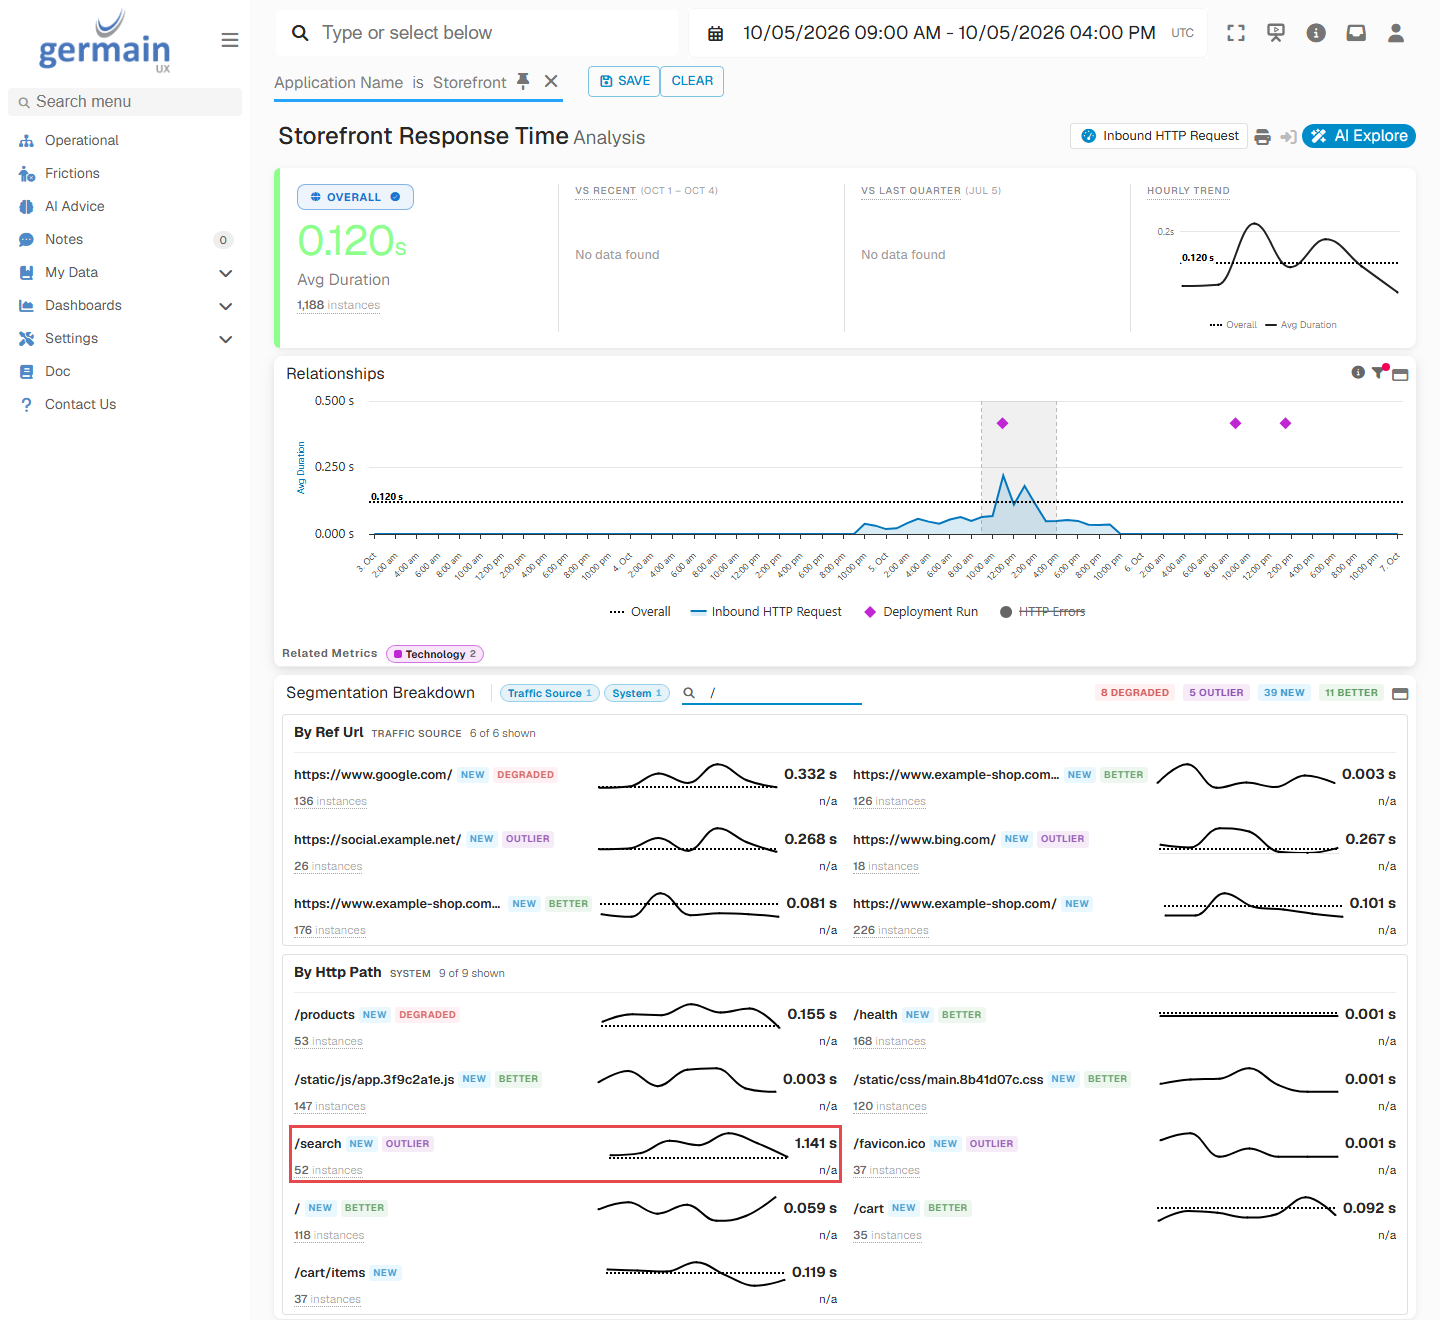
Search Stands Out Among the Storefront Routes - GermainUX
Rule out the rest
Example: A Release Leaks Database Connections for Three Hours
At 06:45, an application release goes out. Nothing fails for more than two hours. Then, at about 09:20, the database starts refusing new clients.Spot the outage
FATAL: sorry, too many clients already. While the database refuses clients, GermainUX gets no connection counts, so the database connections KPI has a gap for that period.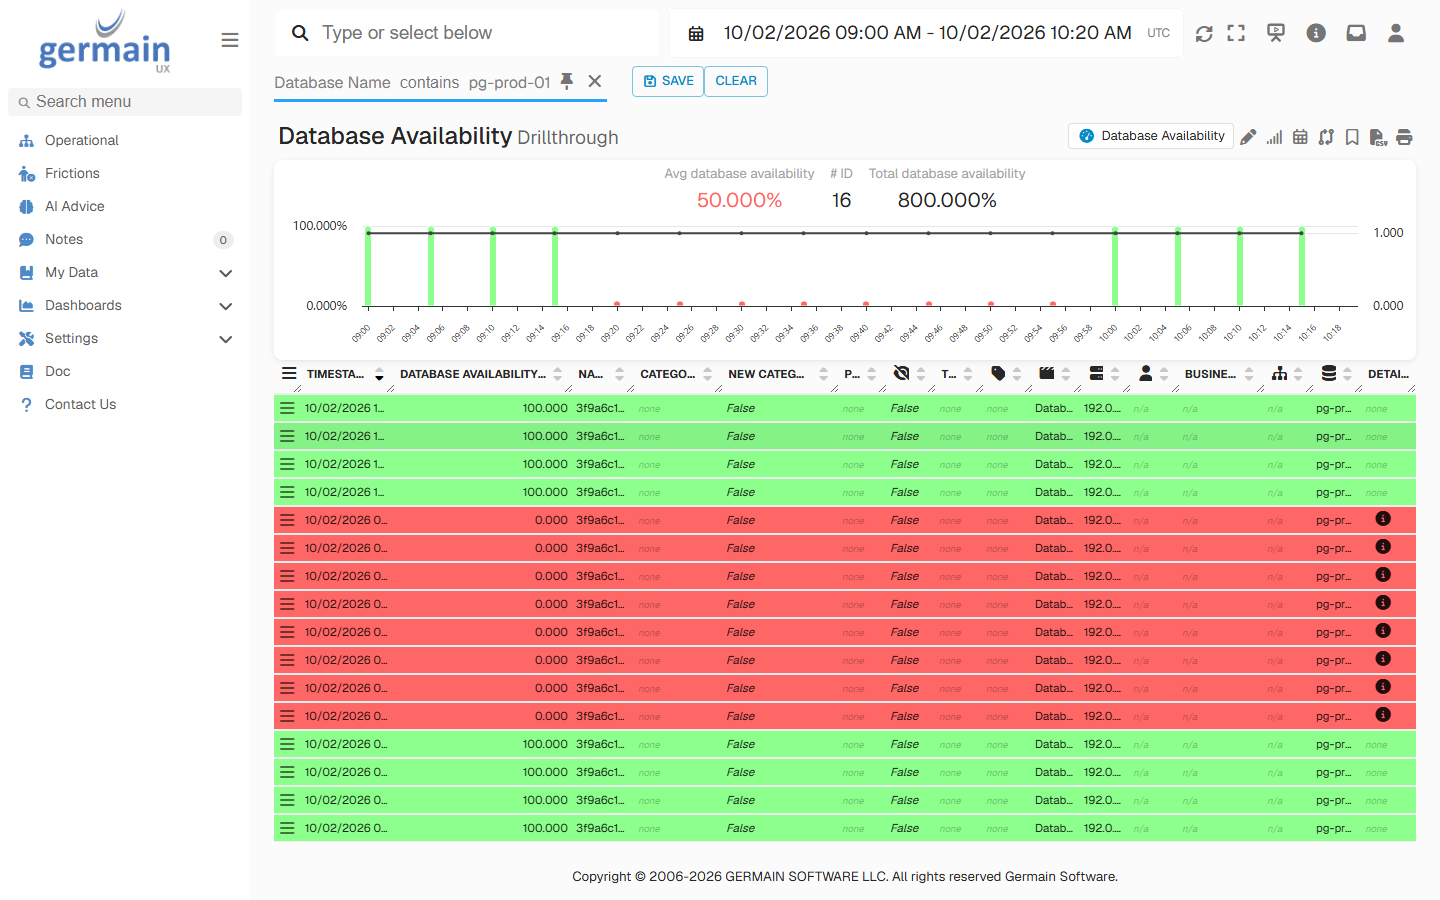
Primary Database Availability Drops to 0 - GermainUX
Look before the outage
Find the release
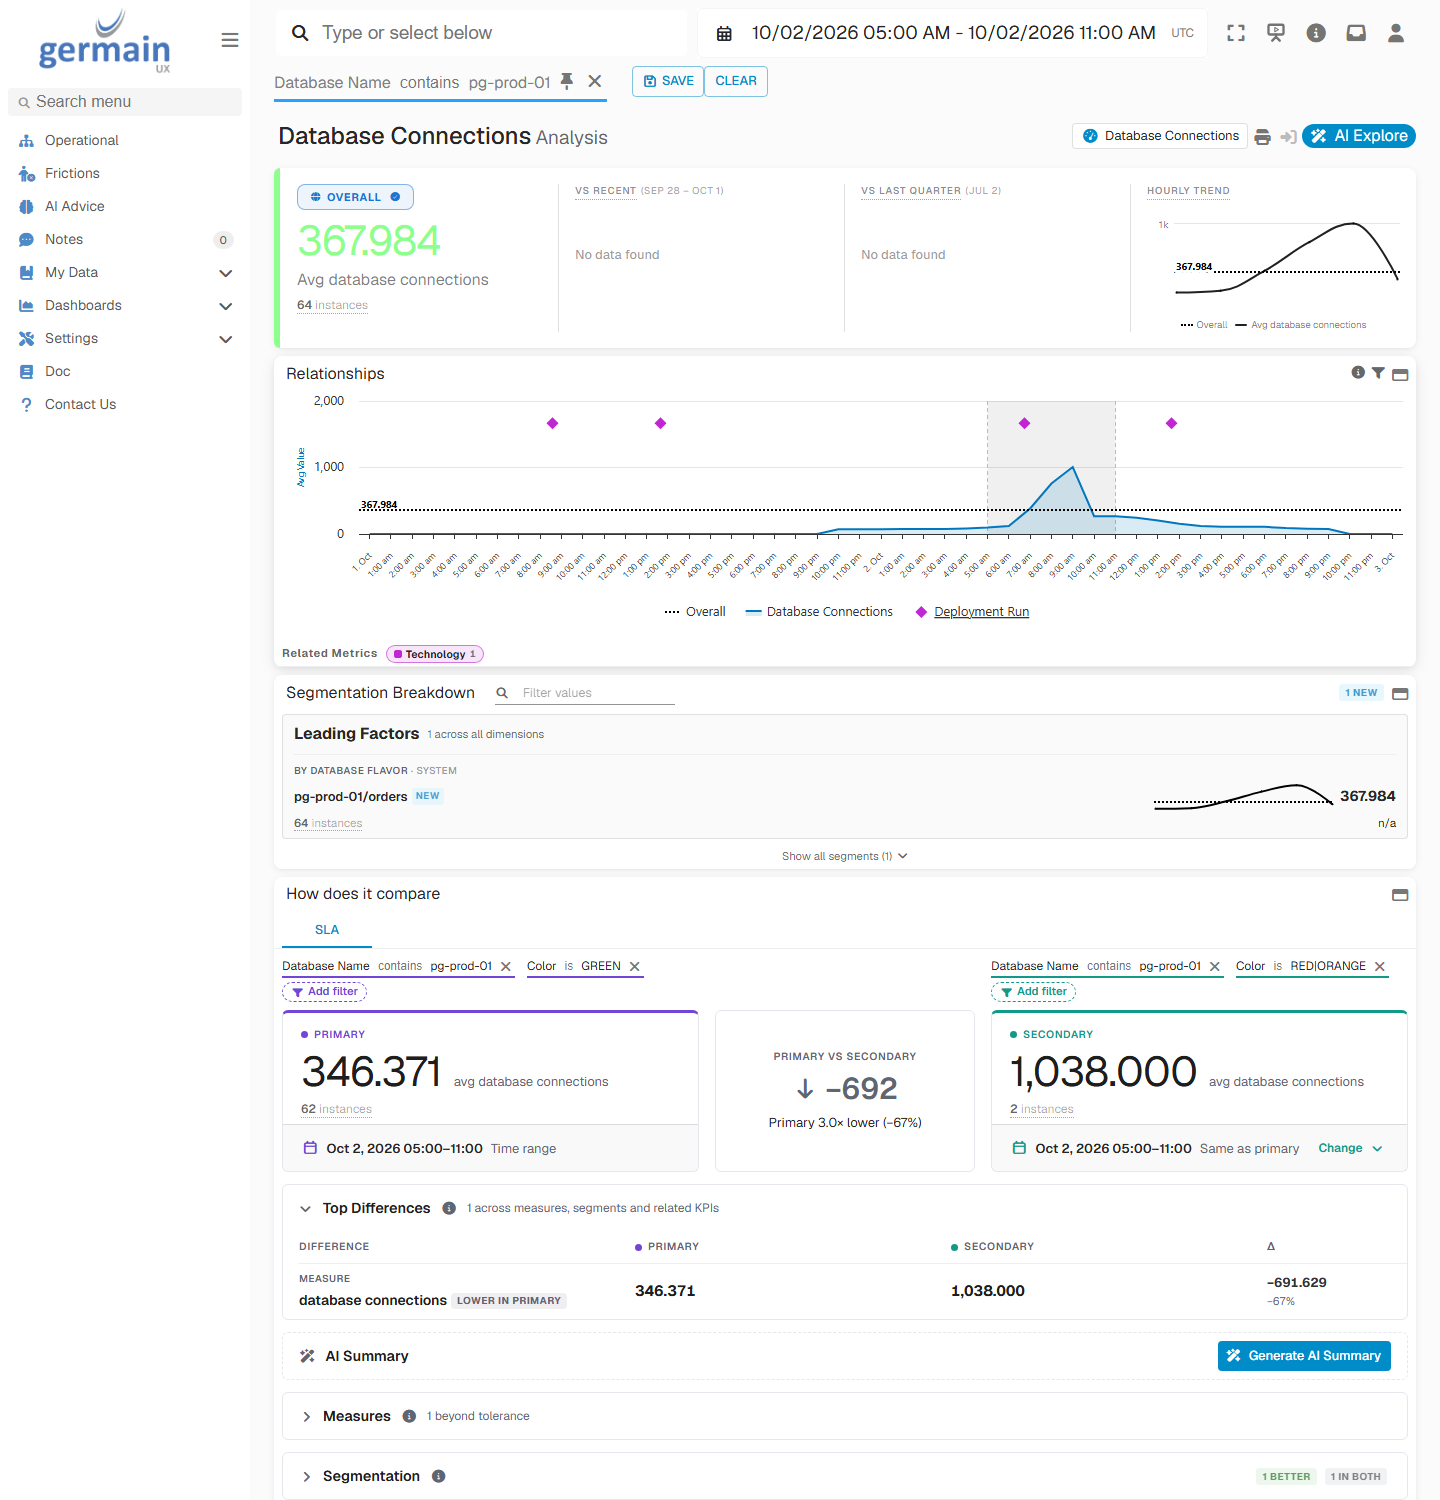
Database Connections Climbing From the Order Service Release - GermainUX
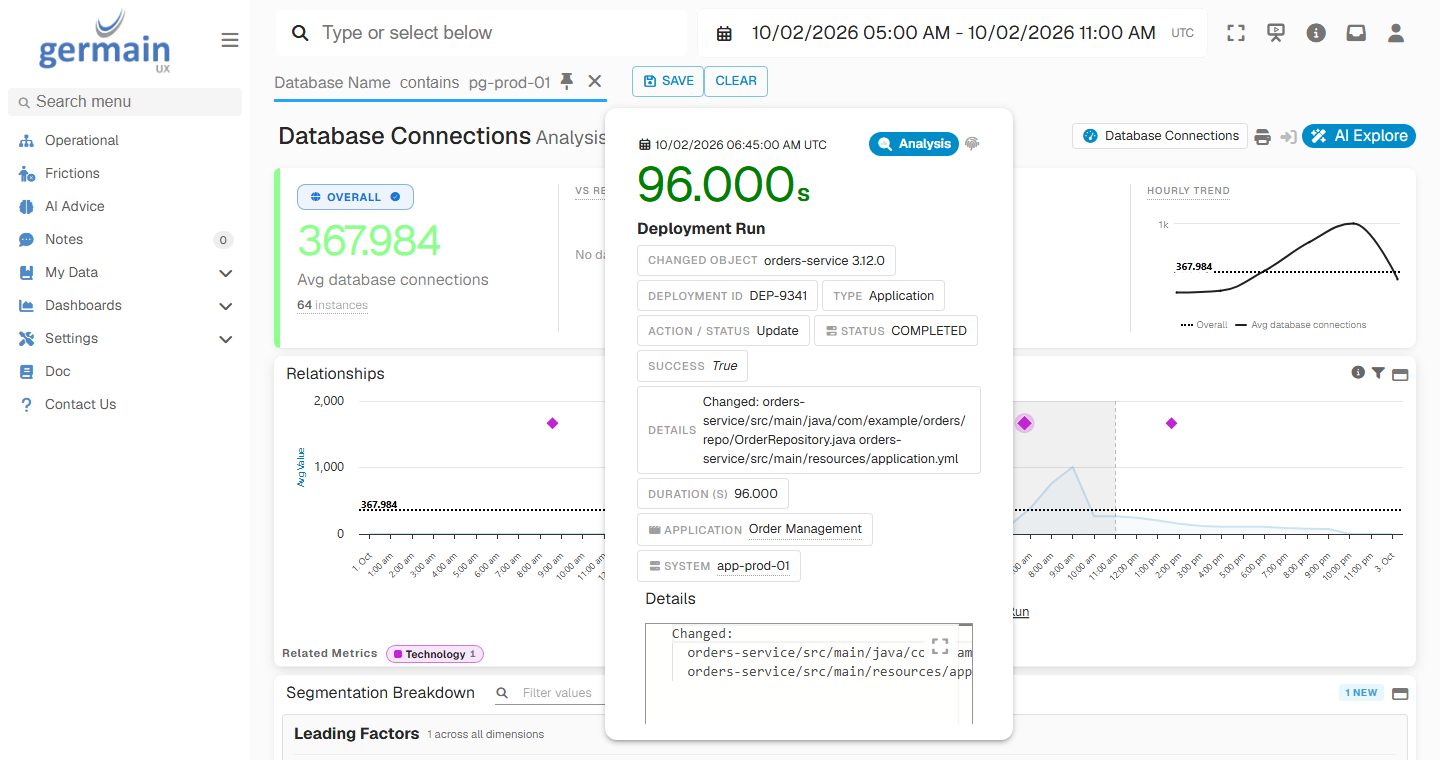
Order Service Release Details on the Release Marker - GermainUX
Rule out the rest
Alert and Act
Each example points to a signal you can catch sooner next time:- Percent change SLAs on error rates and response times, so a regression after a release raises an alert even when no fixed threshold is crossed
- New error detection, so an error type that never appeared before is flagged as soon as it does
- SLAs and outlier detection on resources that leak slowly, such as connections and memory
- Synthetic user scenarios and HTTP checks that run the critical paths right after each deployment
- Automated actions that roll back a deployment, with approval before they run
- Alerts to the team that shipped the release, by email, Microsoft Teams or Slack, and incidents in ServiceNow
Set It Up
Each layer adds value on its own. The more layers you monitor, the faster you rule out the ones that didn’t change.Monitor each layer
Show releases on the timeline
Test after each deployment
Set SLAs and alerts
Additional Resources
KPI Relationships
Analysis Dashboard
Use Cases
Get Help
Every team ships releases differently, through its own pipeline and to its own layers. The GermainUX team can help you bring your deployments onto the timeline, choose the SLAs that catch regressions early and set up the checks that run after each release.Contact GermainUX Support
Can't Find What You Need?
The content of this document is proprietary to GERMAIN SOFTWARE.