

Analysis Dashboard
Single view for investigation
User & Session Evidence
Who was affected and when
Analyze Impact at Scale
Measure how widely issues spread
From Detection to Resolution
Linking findings to follow-up actions
Overview
GermainUX Root-Cause Analysis helps teams move from what happened to why it happened, using the user, business workflow, application, and technology data collected and correlated by GermainUX. Root-Cause Analysis can be used to investigate issues affecting:
The objective is to connect a KPI or issue with the evidence available in GermainUX and identify the most likely contributing factors or root cause.
Analysis Dashboard
The Analysis Dashboard is GermainUX’s primary interface for root-cause investigation. It brings the investigation—from a business or technical symptom to supporting evidence—into a single analytical workflow. From an Aggregate, Pivot, or Drill-through Dashboard, users can drill into the Analysis Dashboard to investigate a selected KPI or data point. The Analysis Dashboard helps answer:- Is this abnormal?
Compare the selected KPI with its baseline, historical behavior, trends, and available statistical information. - What changed with it?
Identify related KPIs that changed during the same period. - What is most strongly related?
Analyze configured KPI relationships to identify signals that may help explain the selected KPI’s behavior. - Who or what is most affected?
Break down the issue by available dimensions such as users, sessions, applications, pages, workflows, products, systems, versions, or other monitored attributes. - Is it isolated or widespread?
Determine whether the issue affects an individual instance, session, user, population, or the broader monitored environment. - What happened in an individual instance?
Drill into the underlying event, error, transaction, request, session, or other raw data. - What contributed to it?
Examine available traces, relationships, duration breakdowns, errors, requests, services, queries, code execution, infrastructure conditions, or Session Replay evidence.
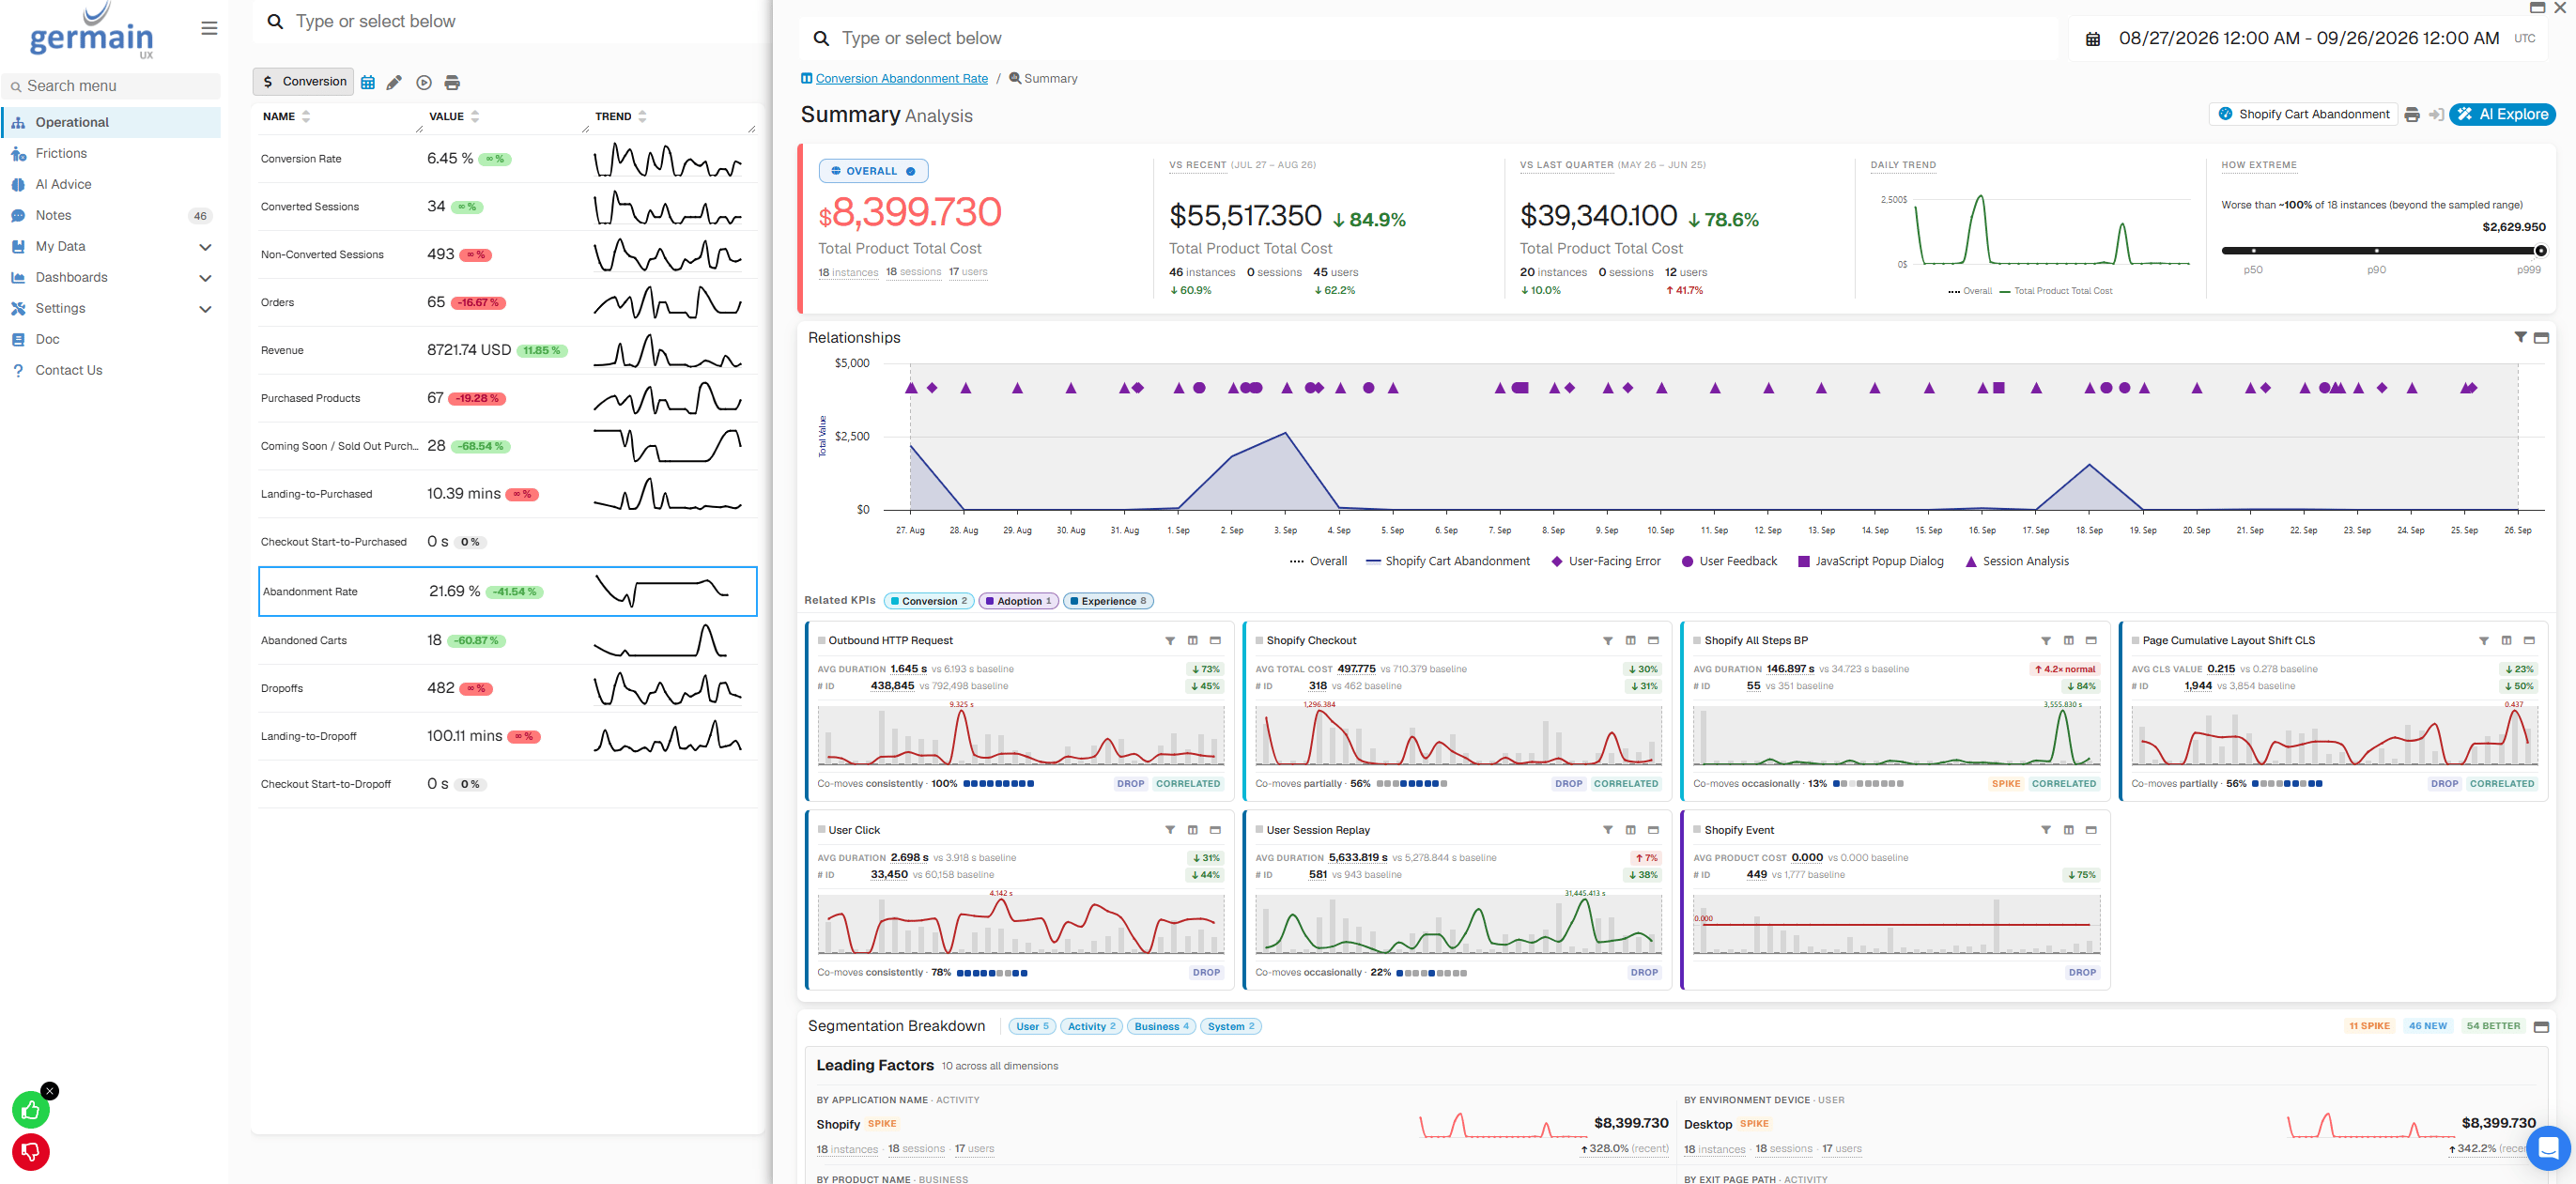
Analysis Dashboard: KPI compared with baselines, related KPIs, and Leading Factors - GermainUX
Correlation & Relationships
GermainUX correlates monitored data to help identify relationships between user activity, workflows, applications, and technologies. Correlation can use:- Exact-match correlation
- ID-based correlation
- Stream correlation
- Configured KPI relationships
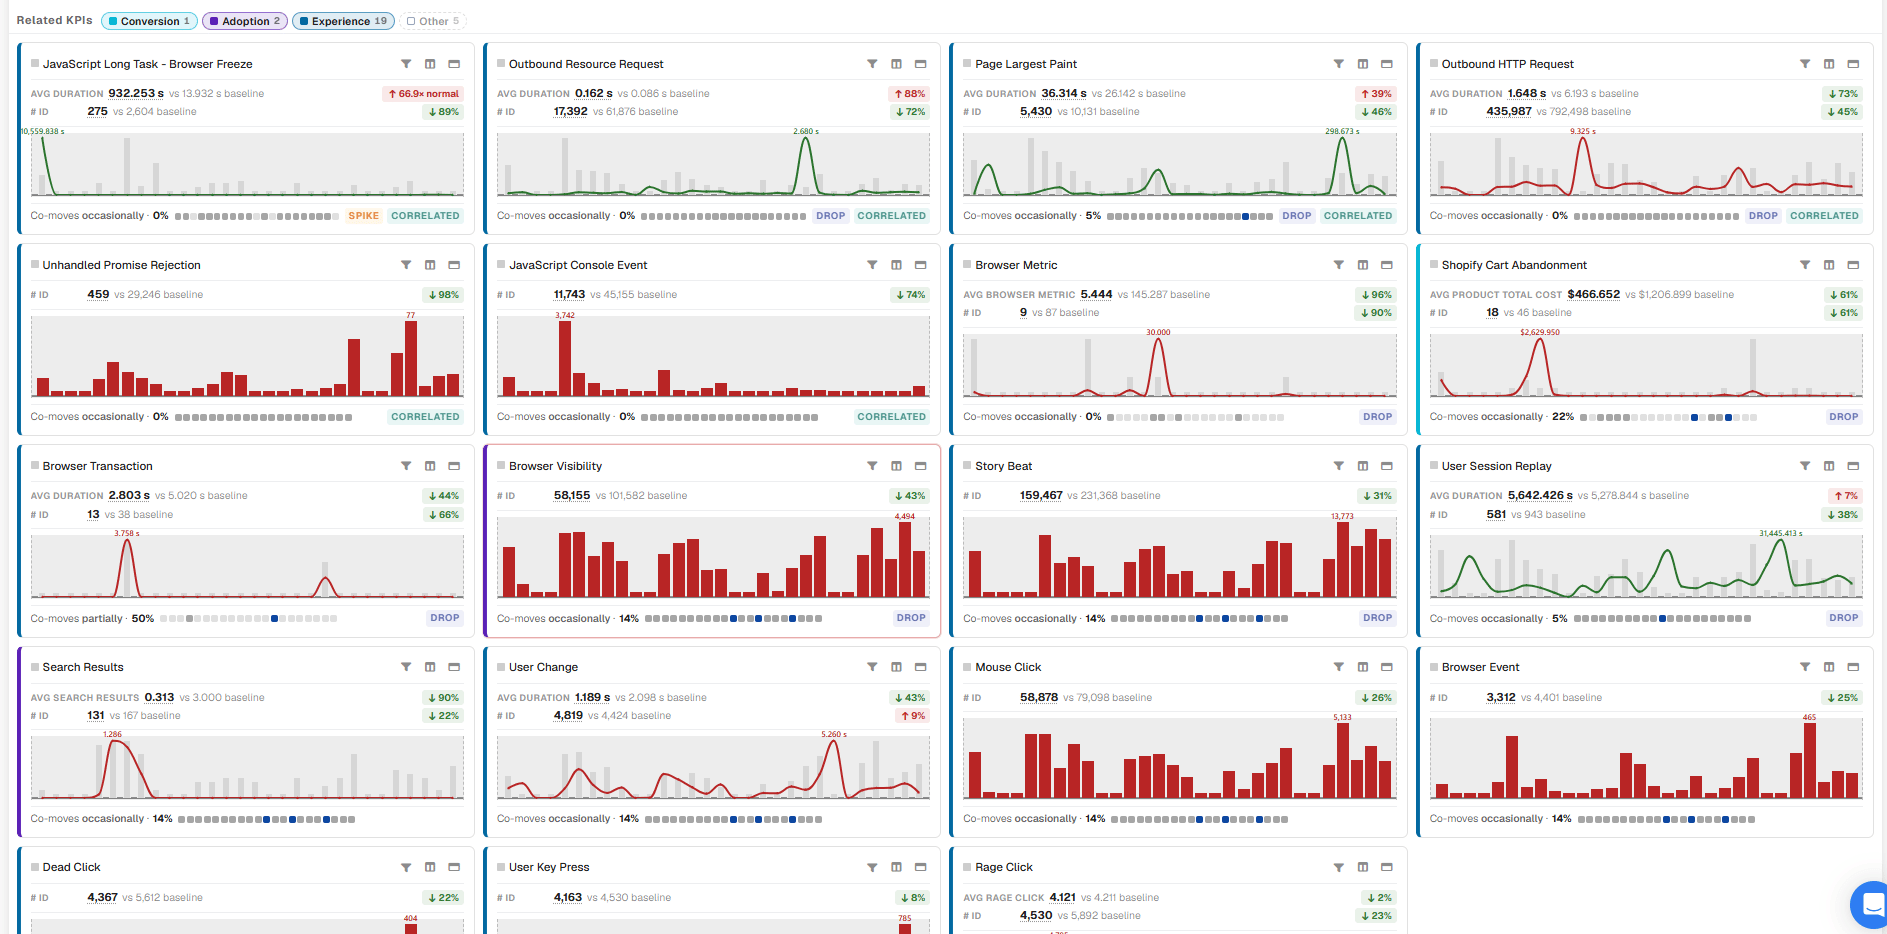
Related KPIs with baseline comparison and co-movement - GermainUX
User & Session Evidence
When User Monitoring is deployed, GermainUX can connect an issue to the user experience in which it occurred. Depending on the deployed monitoring capabilities, investigators can examine:- User
- Session
- Page or application
- User actions
- Errors
- Network activity
- Transactions
- Business-process activity
- Session Replay
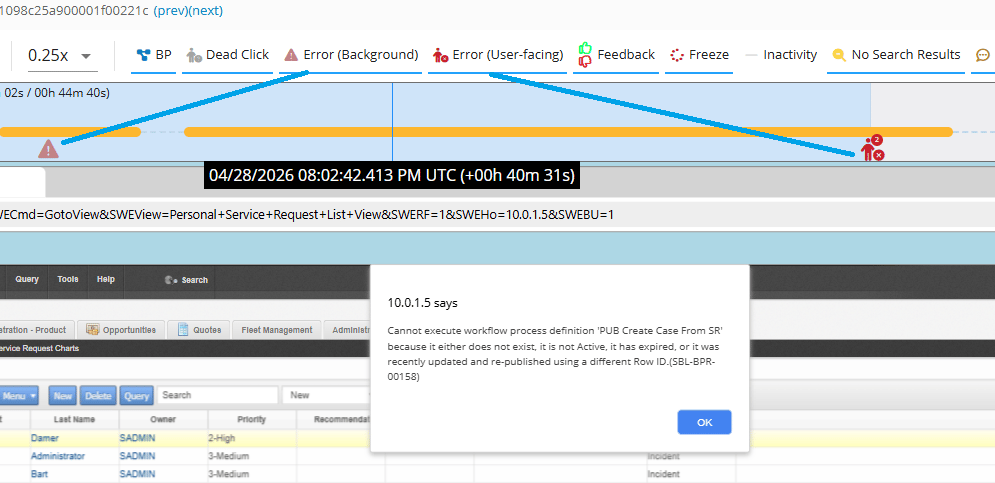
Background and user-facing errors on the Session Replay timeline - GermainUX
Business Workflow Analysis
For configured business processes, GermainUX can analyze the workflow in which an issue occurred. Depending on the configured process and available data, teams can investigate:- Workflow duration
- Process steps
- Delays and bottlenecks
- Failed steps
- Drop-offs
- Repeated actions
- Workflow completion
- Related user or technology events

Process timeline with duration and overrun per step - GermainUX
Technology Root-Cause Analysis
GermainUX can correlate technology performance with user and business impact. Depending on the monitored technology and deployed components, investigation evidence can include:- Application errors and exceptions
- Browser and HTTP activity
- Application transactions
- APIs and web services
- Distributed or correlated transactions
- Application services
- Database activity and SQL
- Code execution
- Infrastructure and system metrics
- Integration activity
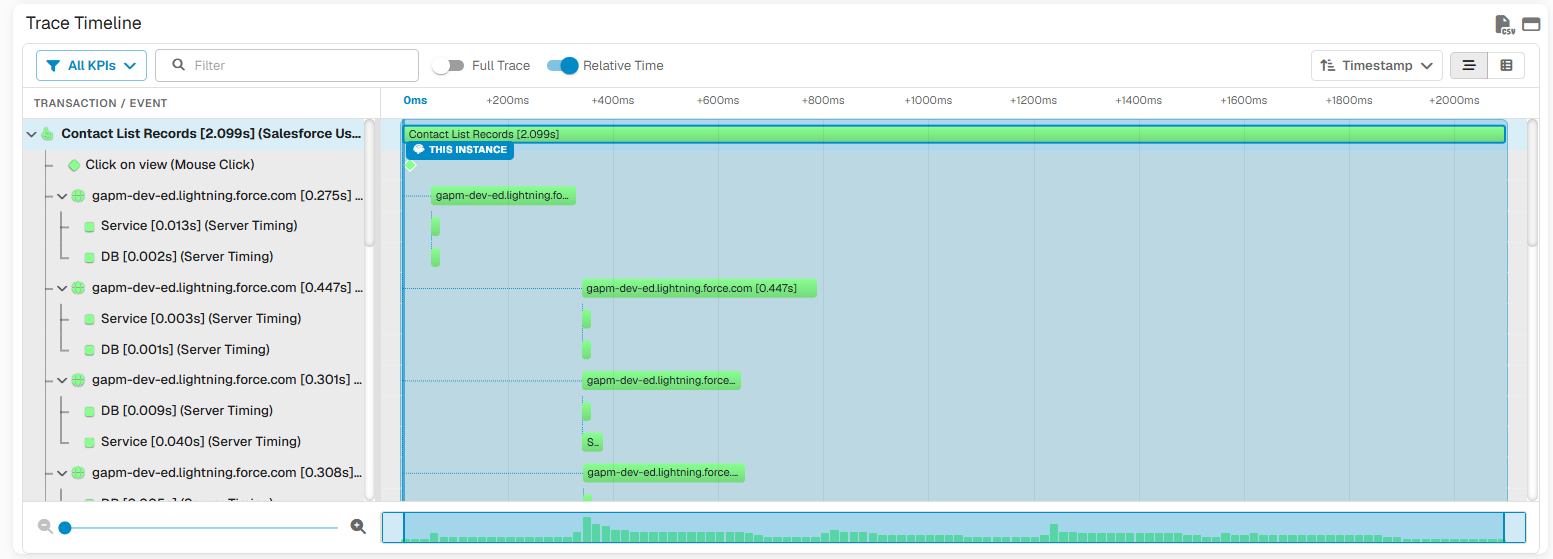
Trace Timeline from user click to server and database - GermainUX
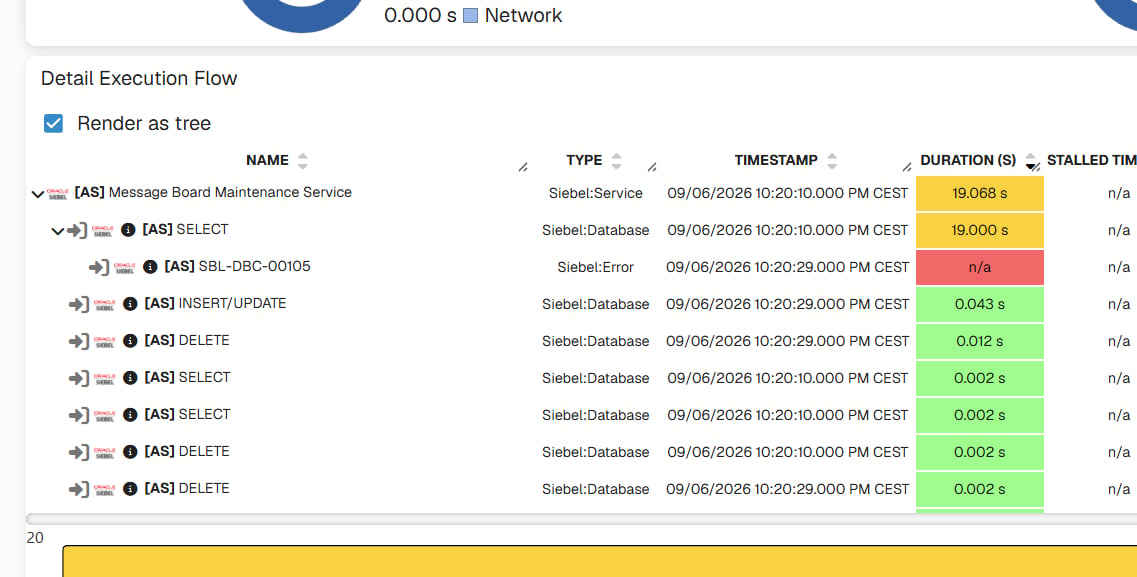
Execution flow with a slow query and a database error - GermainUX
Analyze Impact at Scale
Root-cause investigation is not limited to an occurrence. GermainUX can use data to determine how broadly an issue is occurring and which populations are most affected. For example:IssueRelated FactorsAffected PopulationIndividual InstancesSupporting Evidence
This helps teams distinguish an isolated occurrence from an issue affecting many users, sessions, workflows, transactions, or systems.
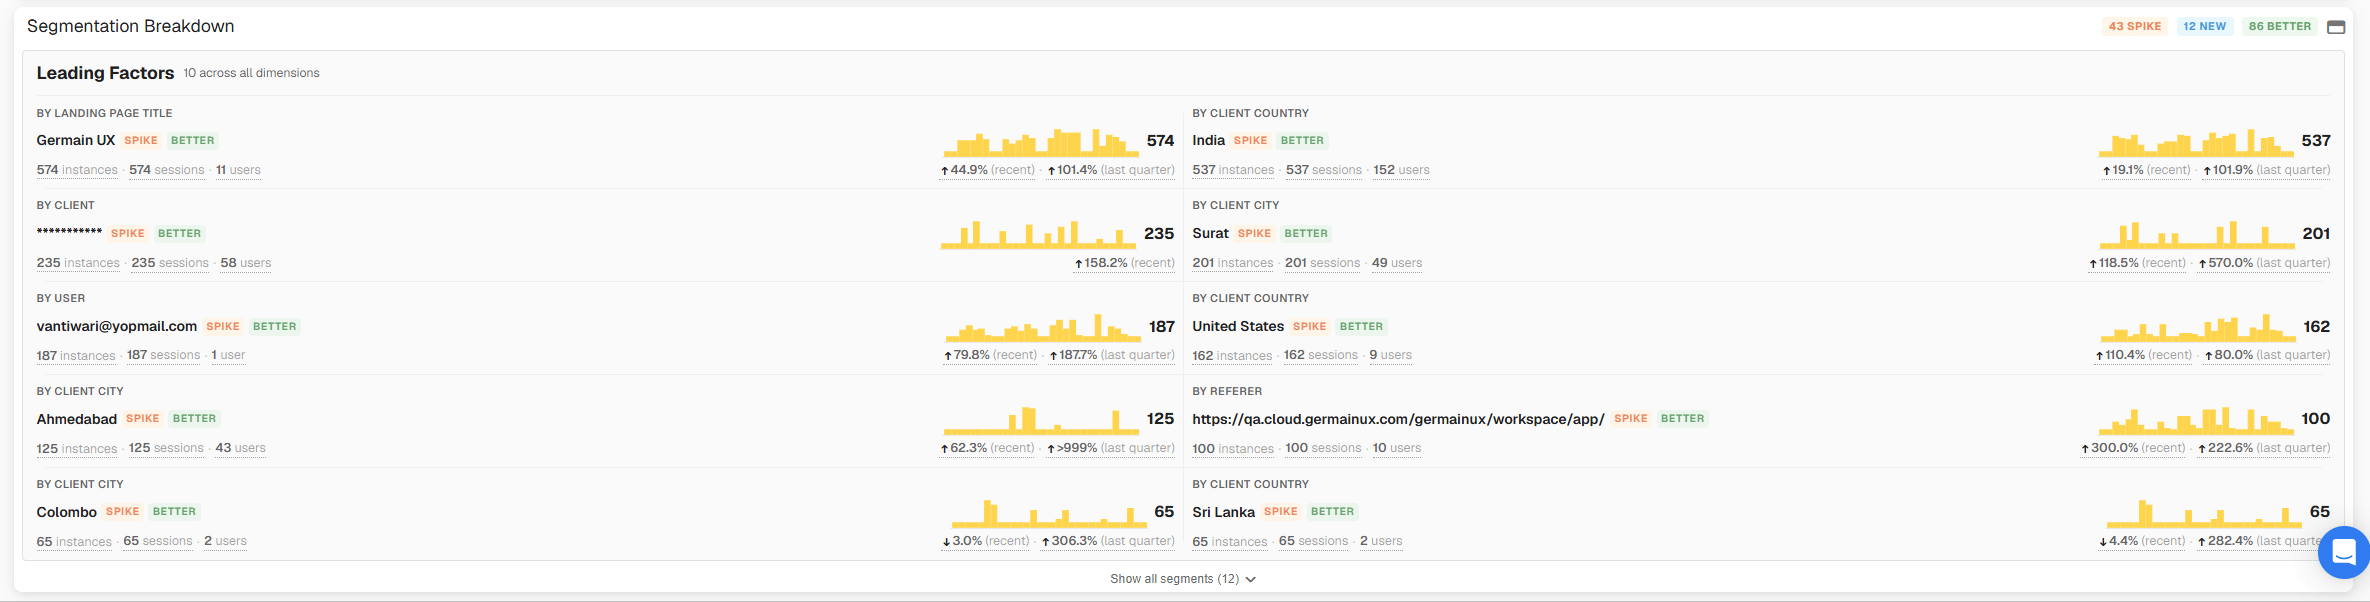
Segmentation breakdown with Leading Factors - GermainUX
AI-Assisted Analysis
Where AI capabilities are enabled, GermainUX can assist the investigation by analyzing available monitored data and providing additional insights and recommendations. AI can help users explore an issue, understand available evidence, identify relevant patterns, and obtain recommendations for resolving or improving the condition being investigated.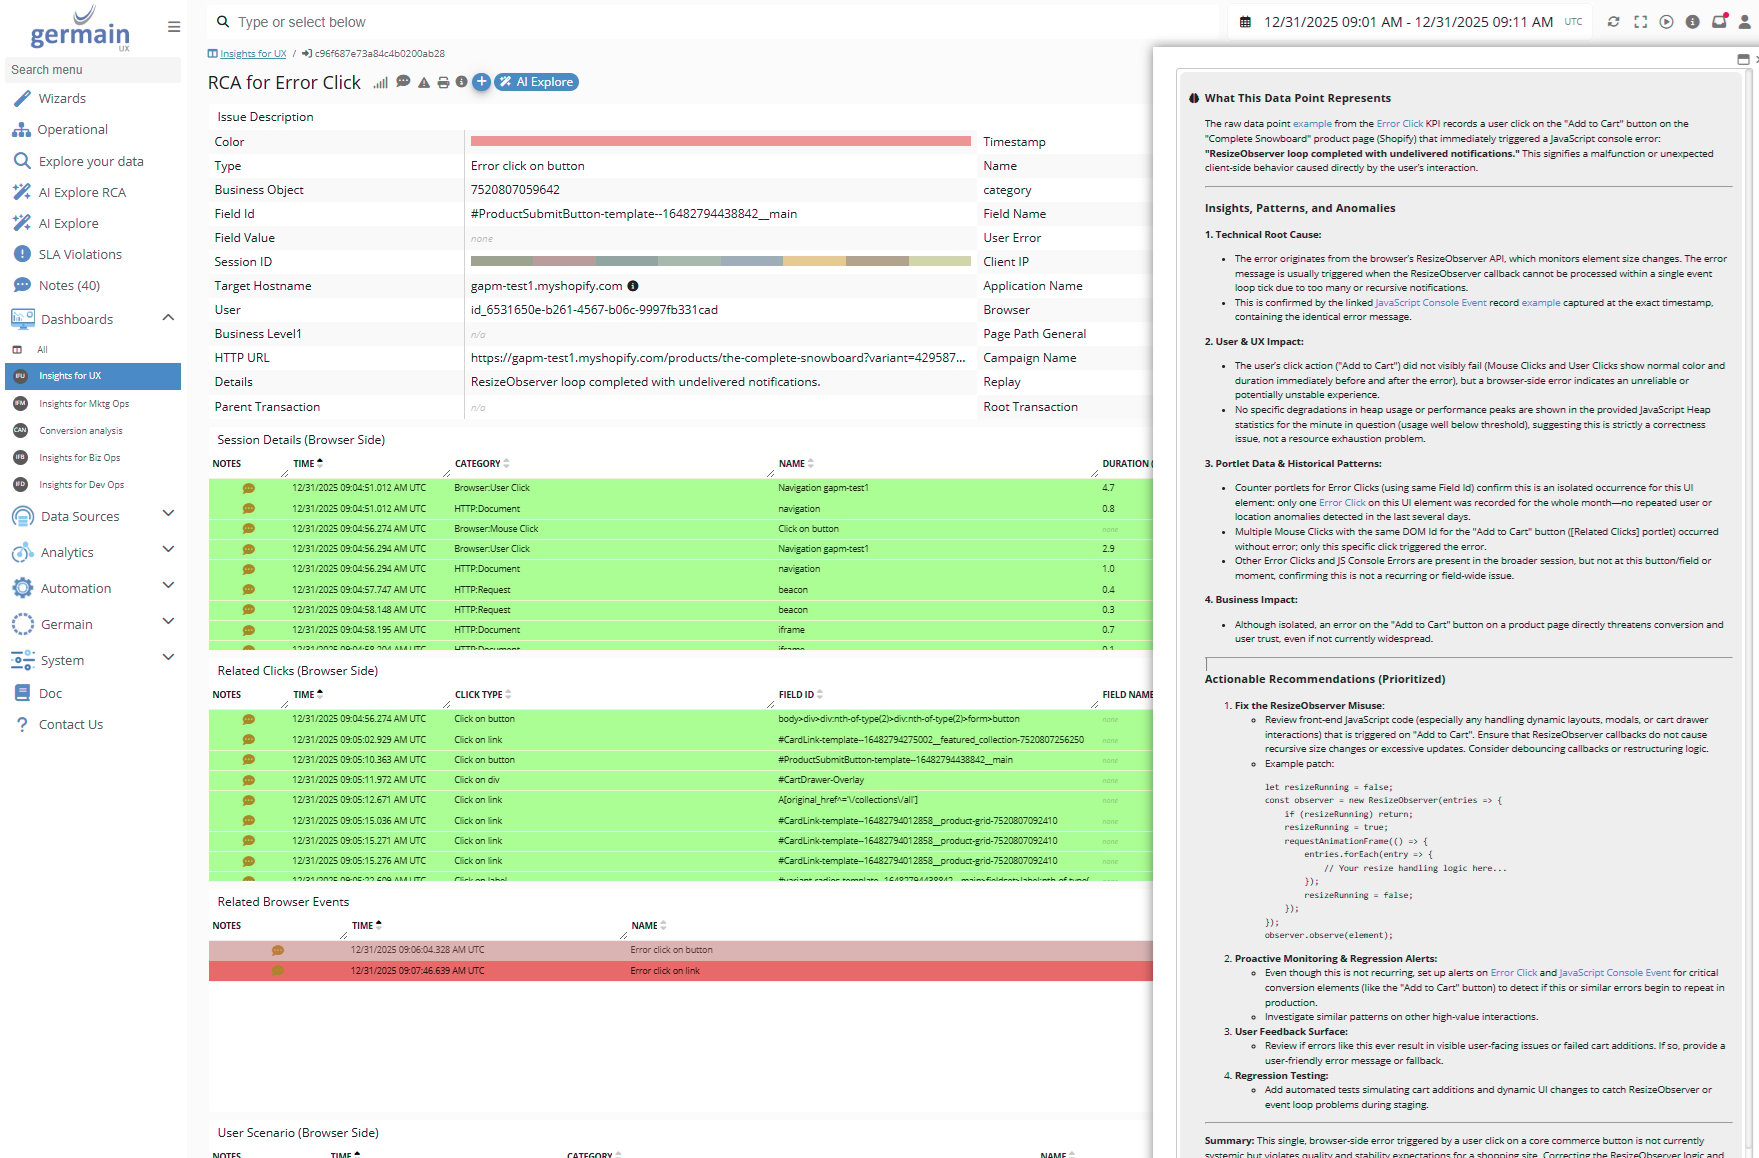
AI Explore answering questions about an issue - GermainUX
From Detection to Resolution
Root-Cause Analysis is part of the broader GermainUX operational workflow:ObserveAnalyzePrioritizeActValidate
For example:
KPI degradation detected → Analyze abnormal behavior
→ Identify related KPIs
→ Determine affected users or population
→ Inspect individual instances
→ Trace related activity
→ Review Session Replay or technical evidence
→ Identify likely root cause
→ Take corrective action
→ Validate that the KPI and affected experience have recovered Depending on the configured GermainUX Automation capabilities, findings can also be connected to alerts, tickets, notifications, scripts, APIs, or other approved automated actions.
Related Documentation
Root-Cause Analysis capabilities depend on the monitored technology and deployed GermainUX components.
Get Help
Contact GermainUX Support
The GermainUX team helps you get up and running faster, empower your team, turn data into actionable insights, and optimize performance to deliver measurable business outcomes.
Can't Find What You Need?
Search all GermainUX docs with Ctrl + K, or use the feedback buttons at the bottom of this page to tell us what is missing.
The content of this document is proprietary to GERMAIN SOFTWARE.